Nasdaq 100 2026 YTD Highs & Lows Radar: Apple (AAPL), PepsiCo (PEP) and more
MarketsFN Team

Nasdaq 100 2026 YTD Highs & Lows Radar: Apple (AAPL), PepsiCo (PEP) and more
Screening all 101 Nasdaq 100 constituents for stocks nearest to their 2026 year-to-date high and their 2026 YTD low. Data as of July 16, 2026. % Realized = total return since Jan 1 2026.
Legend: RSI > 70 = overbought · RSI < 30 = oversold · Green % Realized = positive YTD return · Red = negative.
📈 Nearest to 2026 High
Sectors represented: Consumer Defensive (2), Technology (1), Communication Services (1), Consumer Cyclical (1)
| Ticker | Company | Sector | Price Last | % Realized | 2026 YTD High Date | RSI | % above MA200 | Trend |
|---|---|---|---|---|---|---|---|---|
| AAPL | Apple Inc | Technology | $327.50 | +20.84% | 2026-07-15 | 69.1 | +19.6% | Above MA20, MA50, MA200 |
| EA | Electronic Arts, Inc | Communication Services | $207.27 | +1.40% | 2026-07-15 | 74.0 | +2.5% | Above MA20, MA50, MA200 |
| KHC | Kraft Heinz Co | Consumer Defensive | $25.45 | +4.35% | 2026-07-15 | 65.1 | +6.4% | Above MA20, MA50, MA200 |
| ABNB | Airbnb Inc | Consumer Cyclical | $148.38 | +11.56% | 2026-07-02 | 57.8 | +13.2% | Above MA20, MA50, MA200 |
| MNST | Monster Beverage Corp | Consumer Defensive | $97.57 | +28.11% | 2026-07-14 | 69.2 | +23.4% | Above MA20, MA50, MA200 |
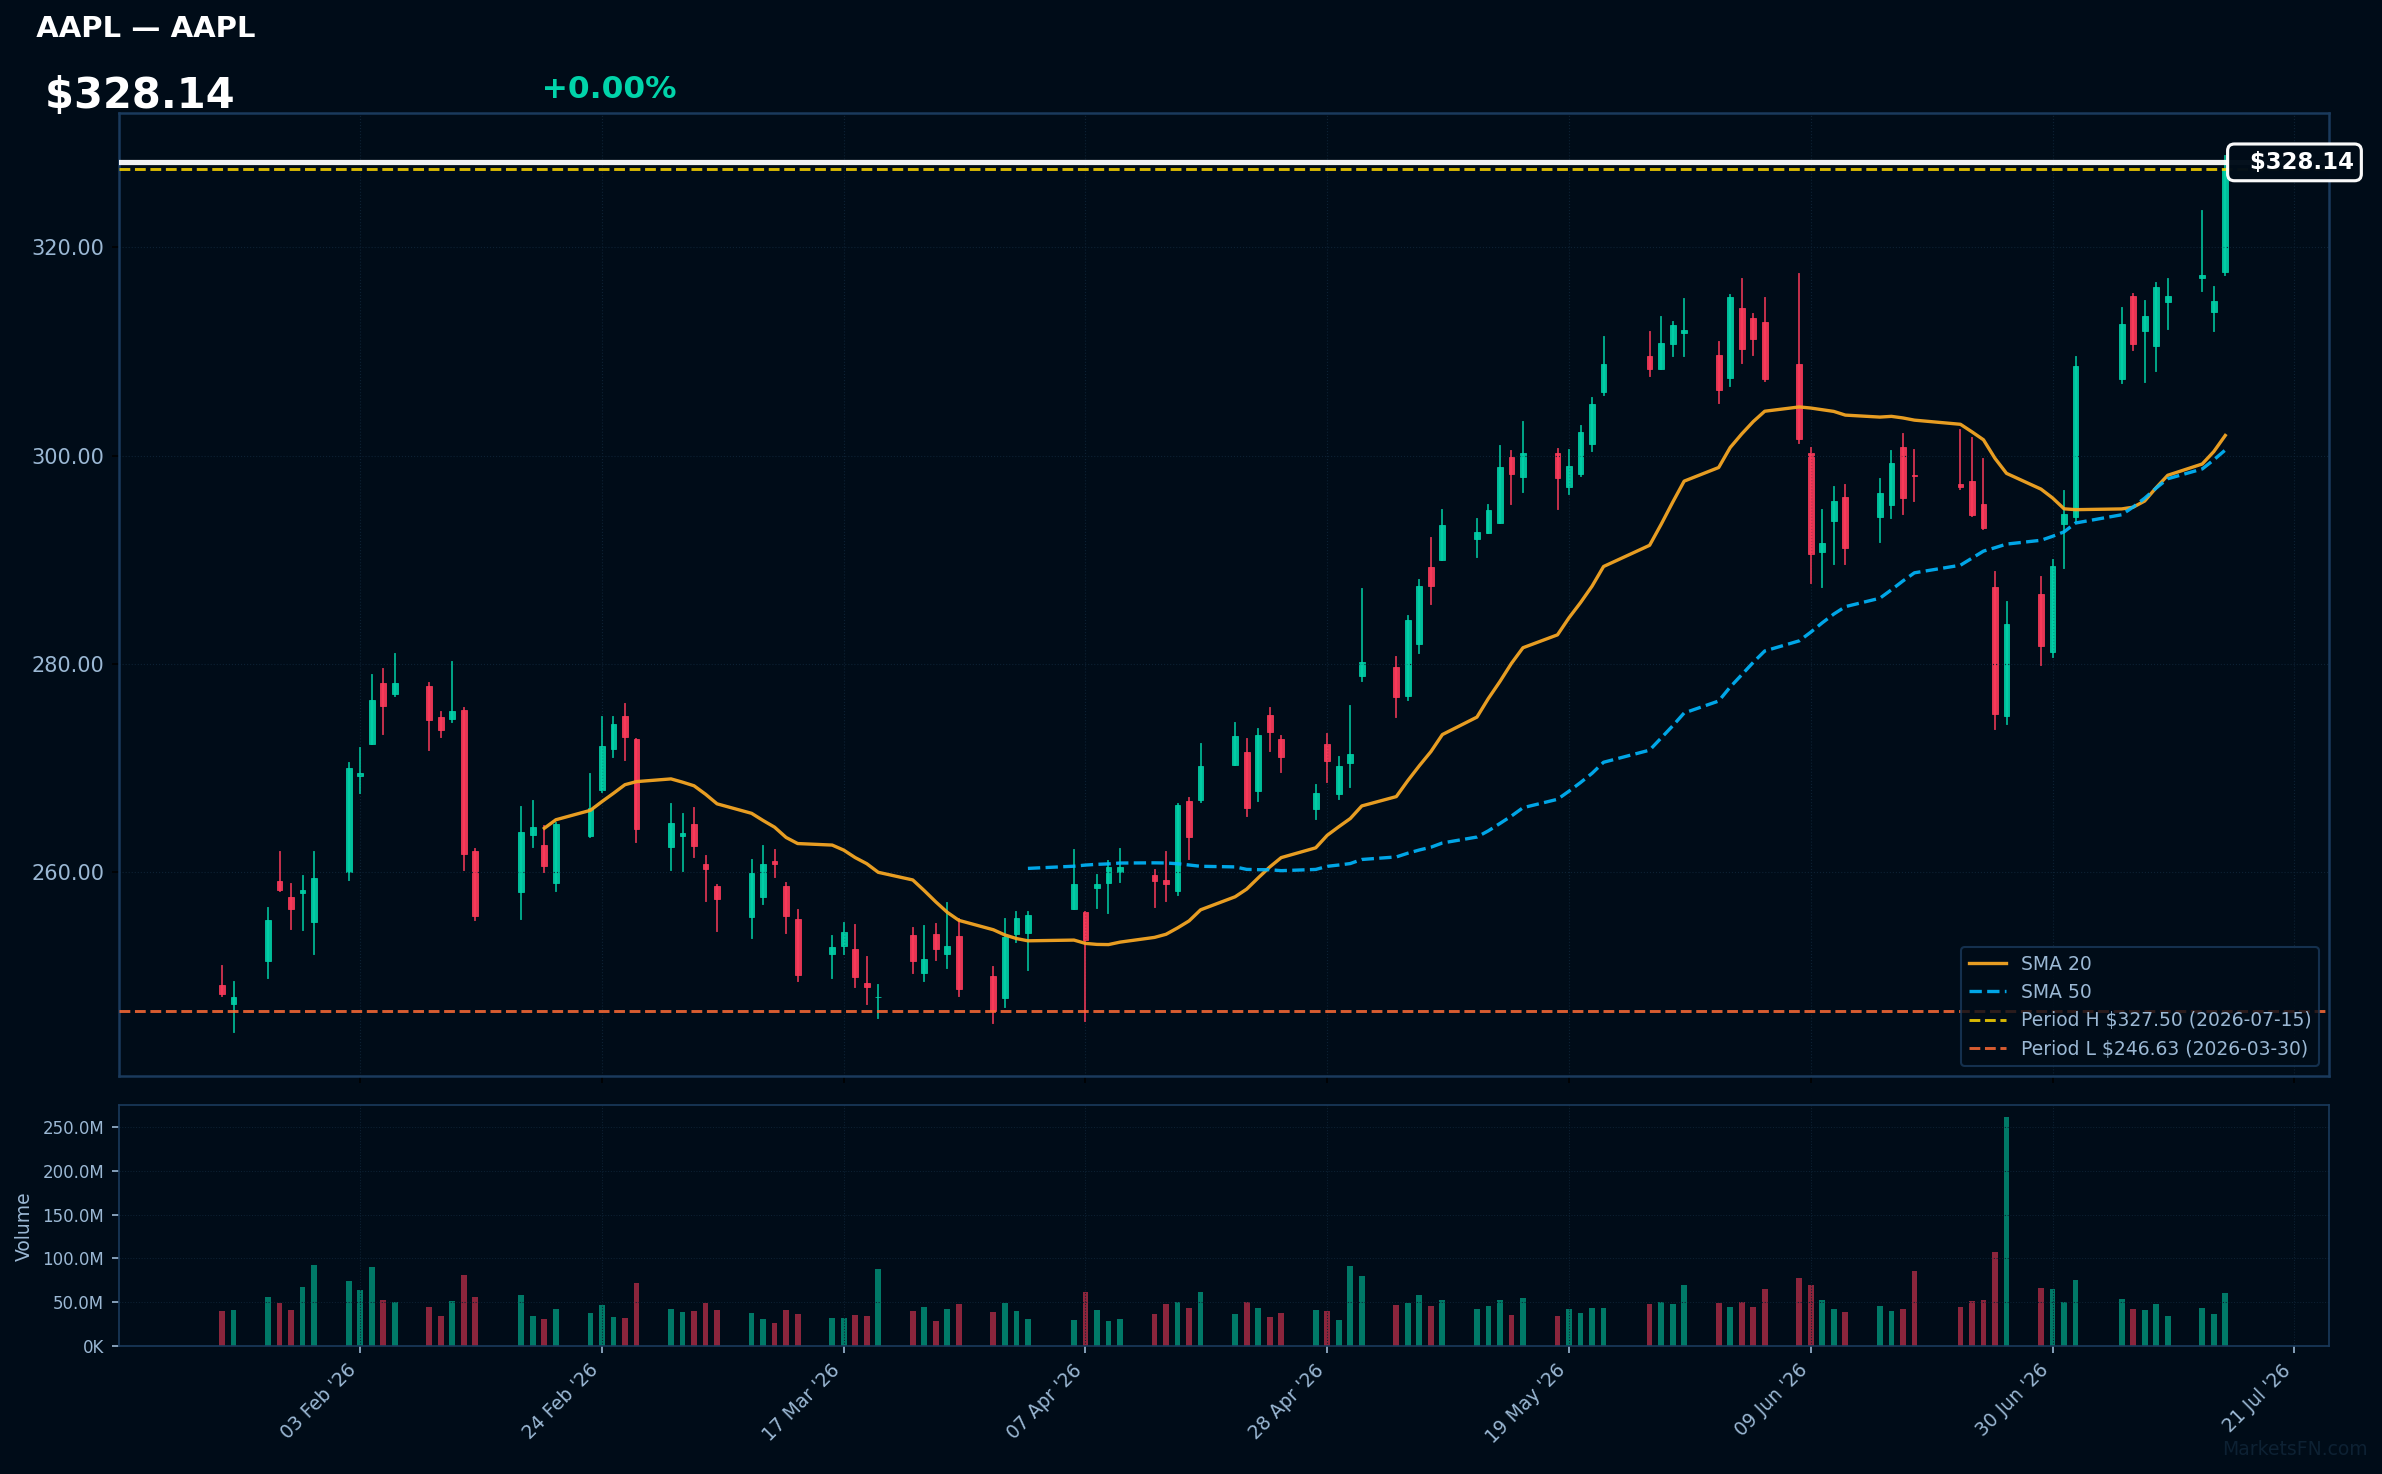
AAPL | Apple Inc | Technology | Price Last: $327.50 | % Realized: +20.84% | RSI: 69.1 | % above MA200: +19.6% | Trend: Above MA20, MA50, MA200
Apple Inc designs, manufactures, and markets consumer electronics, software, and services. Investors care about its innovative product ecosystem, services growth, and profitability. Specific areas of interest include iPhone sales, Services segment revenue, and wearables adoption.
AAPL's RSI(14) is 69.1, nearing overbought territory. The MA alignment is bullish with price > MA20 > MA50 > MA200, indicating a sustained uptrend. The stock is 0.0% below its 2026 YTD high, suggesting a potential breakout.
Related headlines
- Apple Intelligence approved for launch in China with Alibaba and Baidu
- AAPL's China Memory Chip Plans Draw National Security Scrutiny Lawmakers Say Every Memory Chip Purchase Will Subsidize PLA
- AI Weekly: SK Hynix shares jump up and down, Apple sues OpenAI
- These Chinese Tech Stocks Are on the Rise. Thank Apple and Its AI.
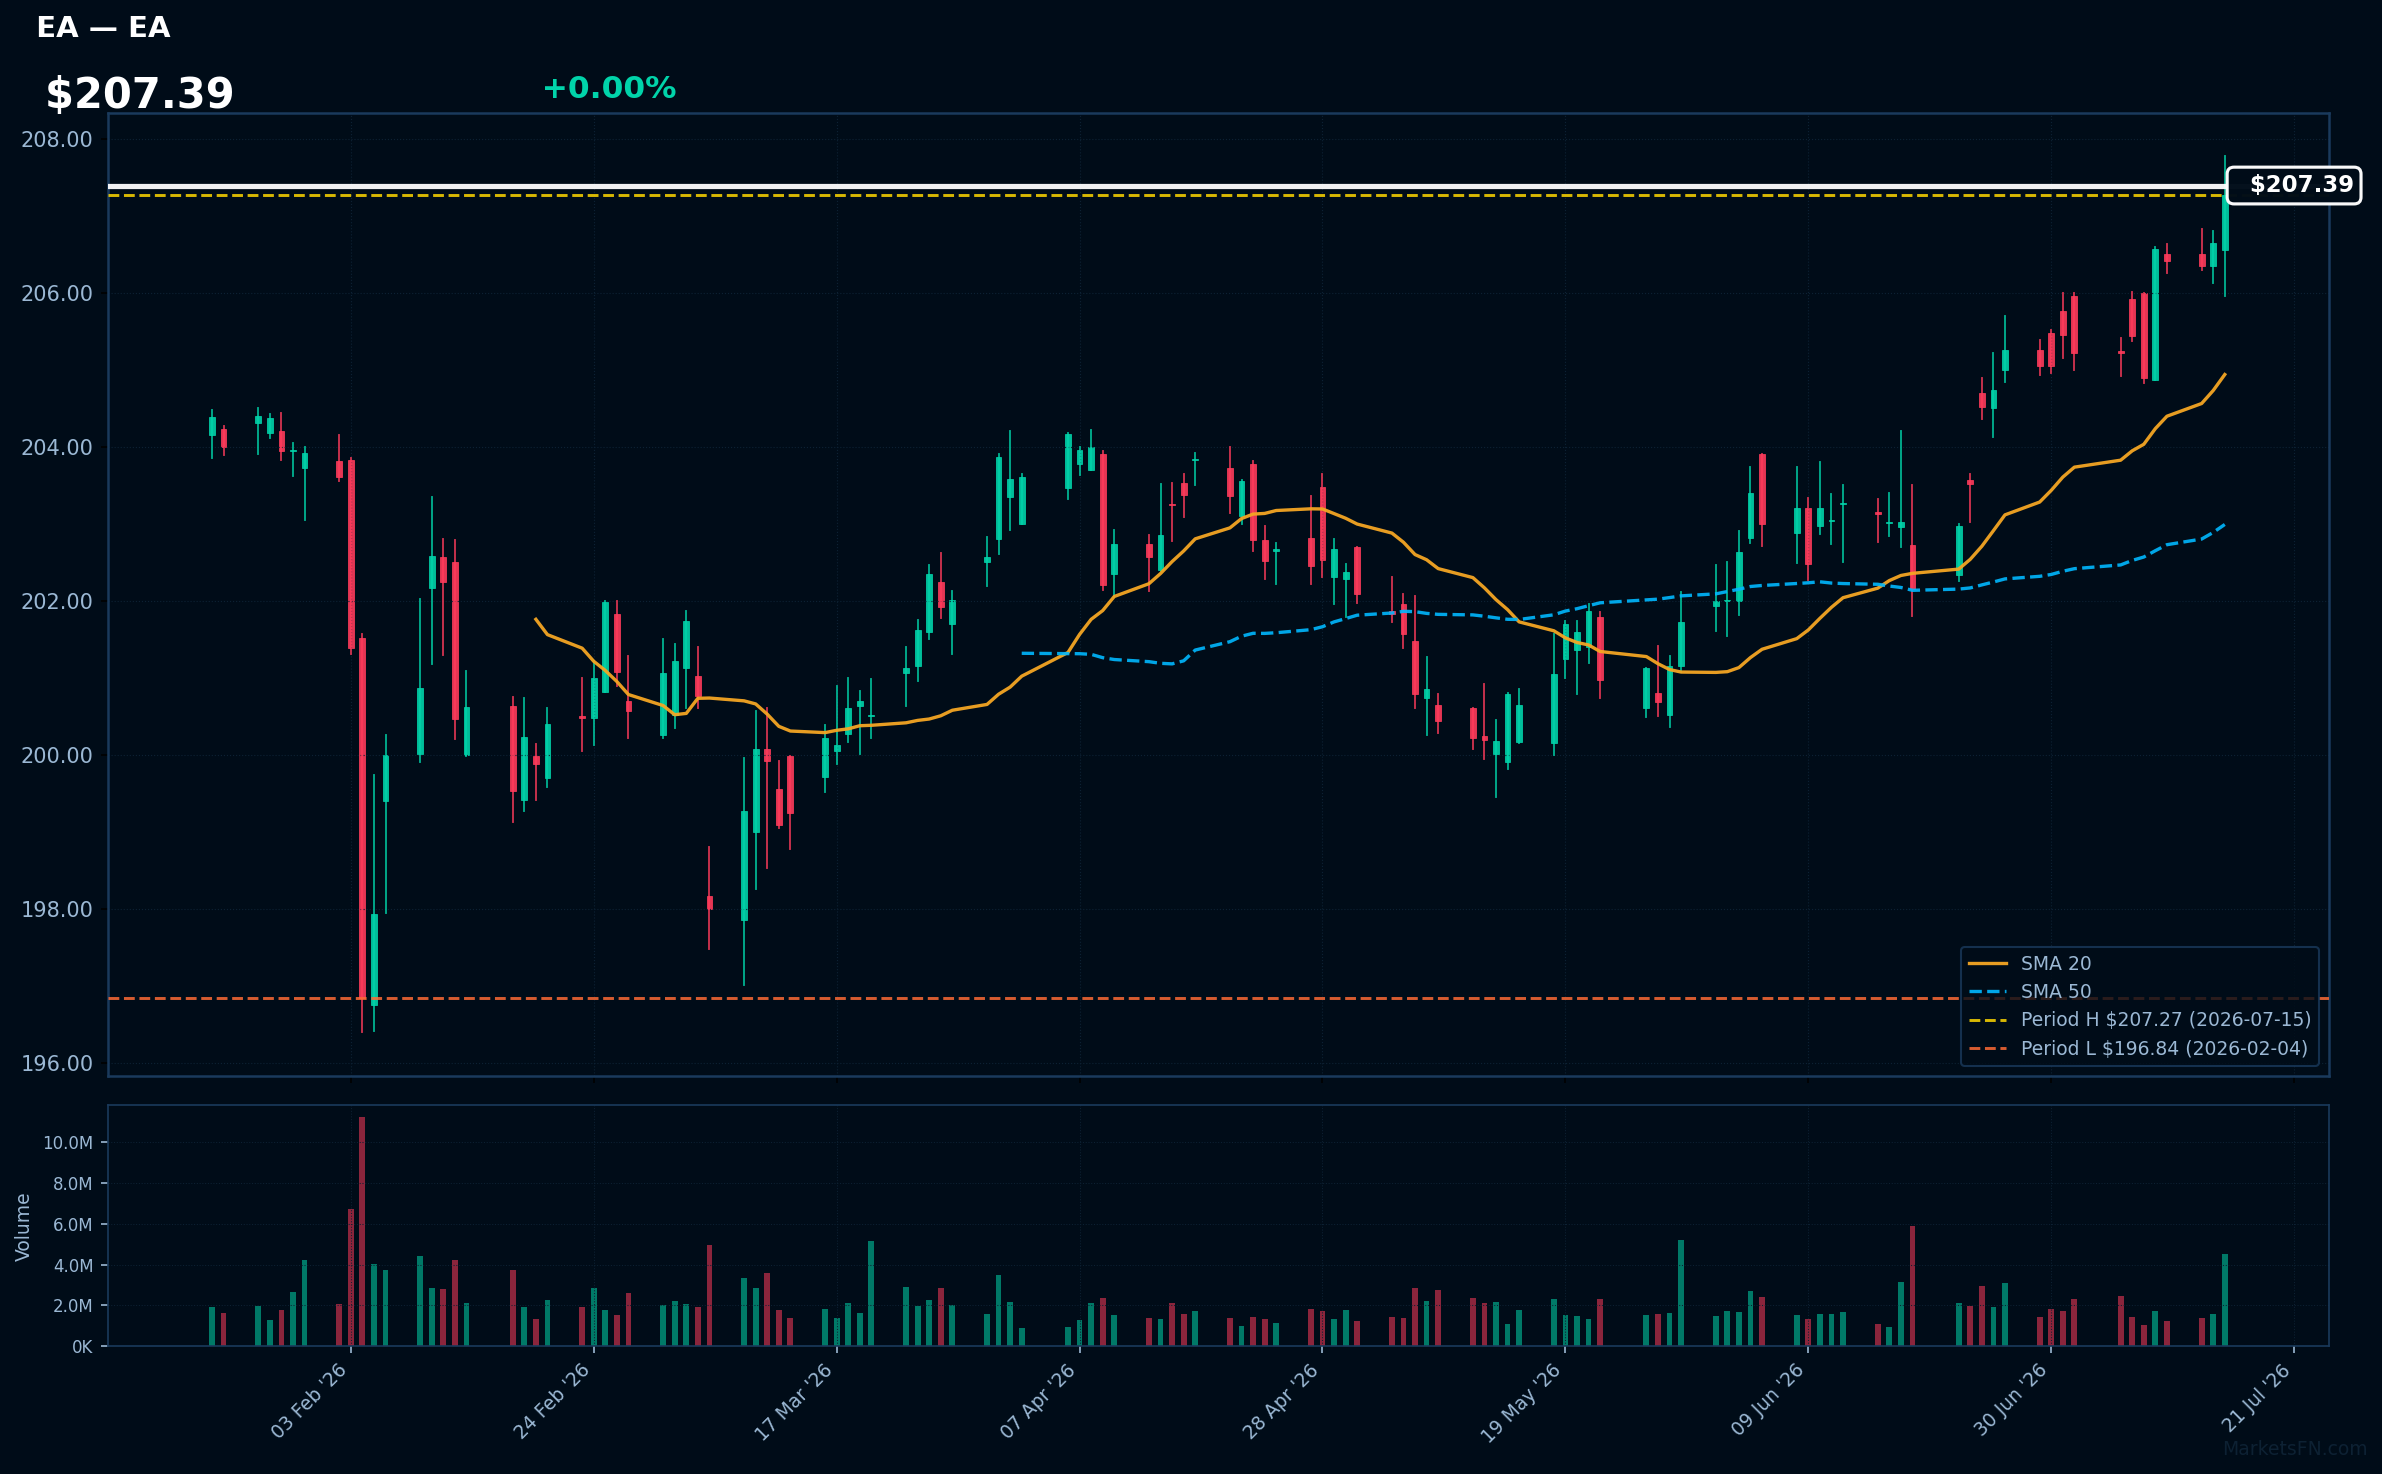
EA | Electronic Arts, Inc | Communication Services | Price Last: $207.27 | % Realized: +1.40% | RSI: 74.0 | % above MA200: +2.5% | Trend: Above MA20, MA50, MA200
Electronic Arts, Inc (EA) is a leading interactive entertainment software company that develops and publishes games such as FIFA, Madden NFL, and The Sims. Investors should care about its performance in the gaming market and its ability to innovate and release successful titles.
EA's current technical situation indicates strong momentum: RSI(14) is 74.0, and the stock is in a sustained uptrend with price > MA20 > MA50 > MA200. It's near a potential breakout level, 0.0% below its 2026 YTD high.
Related headlines
- Oak-Eagle AcquireCo, Inc. Announces Extension of the Expiration Time and Settlement Date for the Previously Announced Tender Offers and Consent Solicitations for Any and All of Electronic Arts Inc.'s 1.850% Senior Notes Due 2031 and 2.950% Senior Notes Due 2051
- EA SPORTS College Football 27 Launches Worldwide, Bringing New Era of College Football to Life
- Fitch Withdraws EA Bond Rating Amid $55 Billion Buyout Dispute
- NBCU And Gaming: Possible Merger Deals?
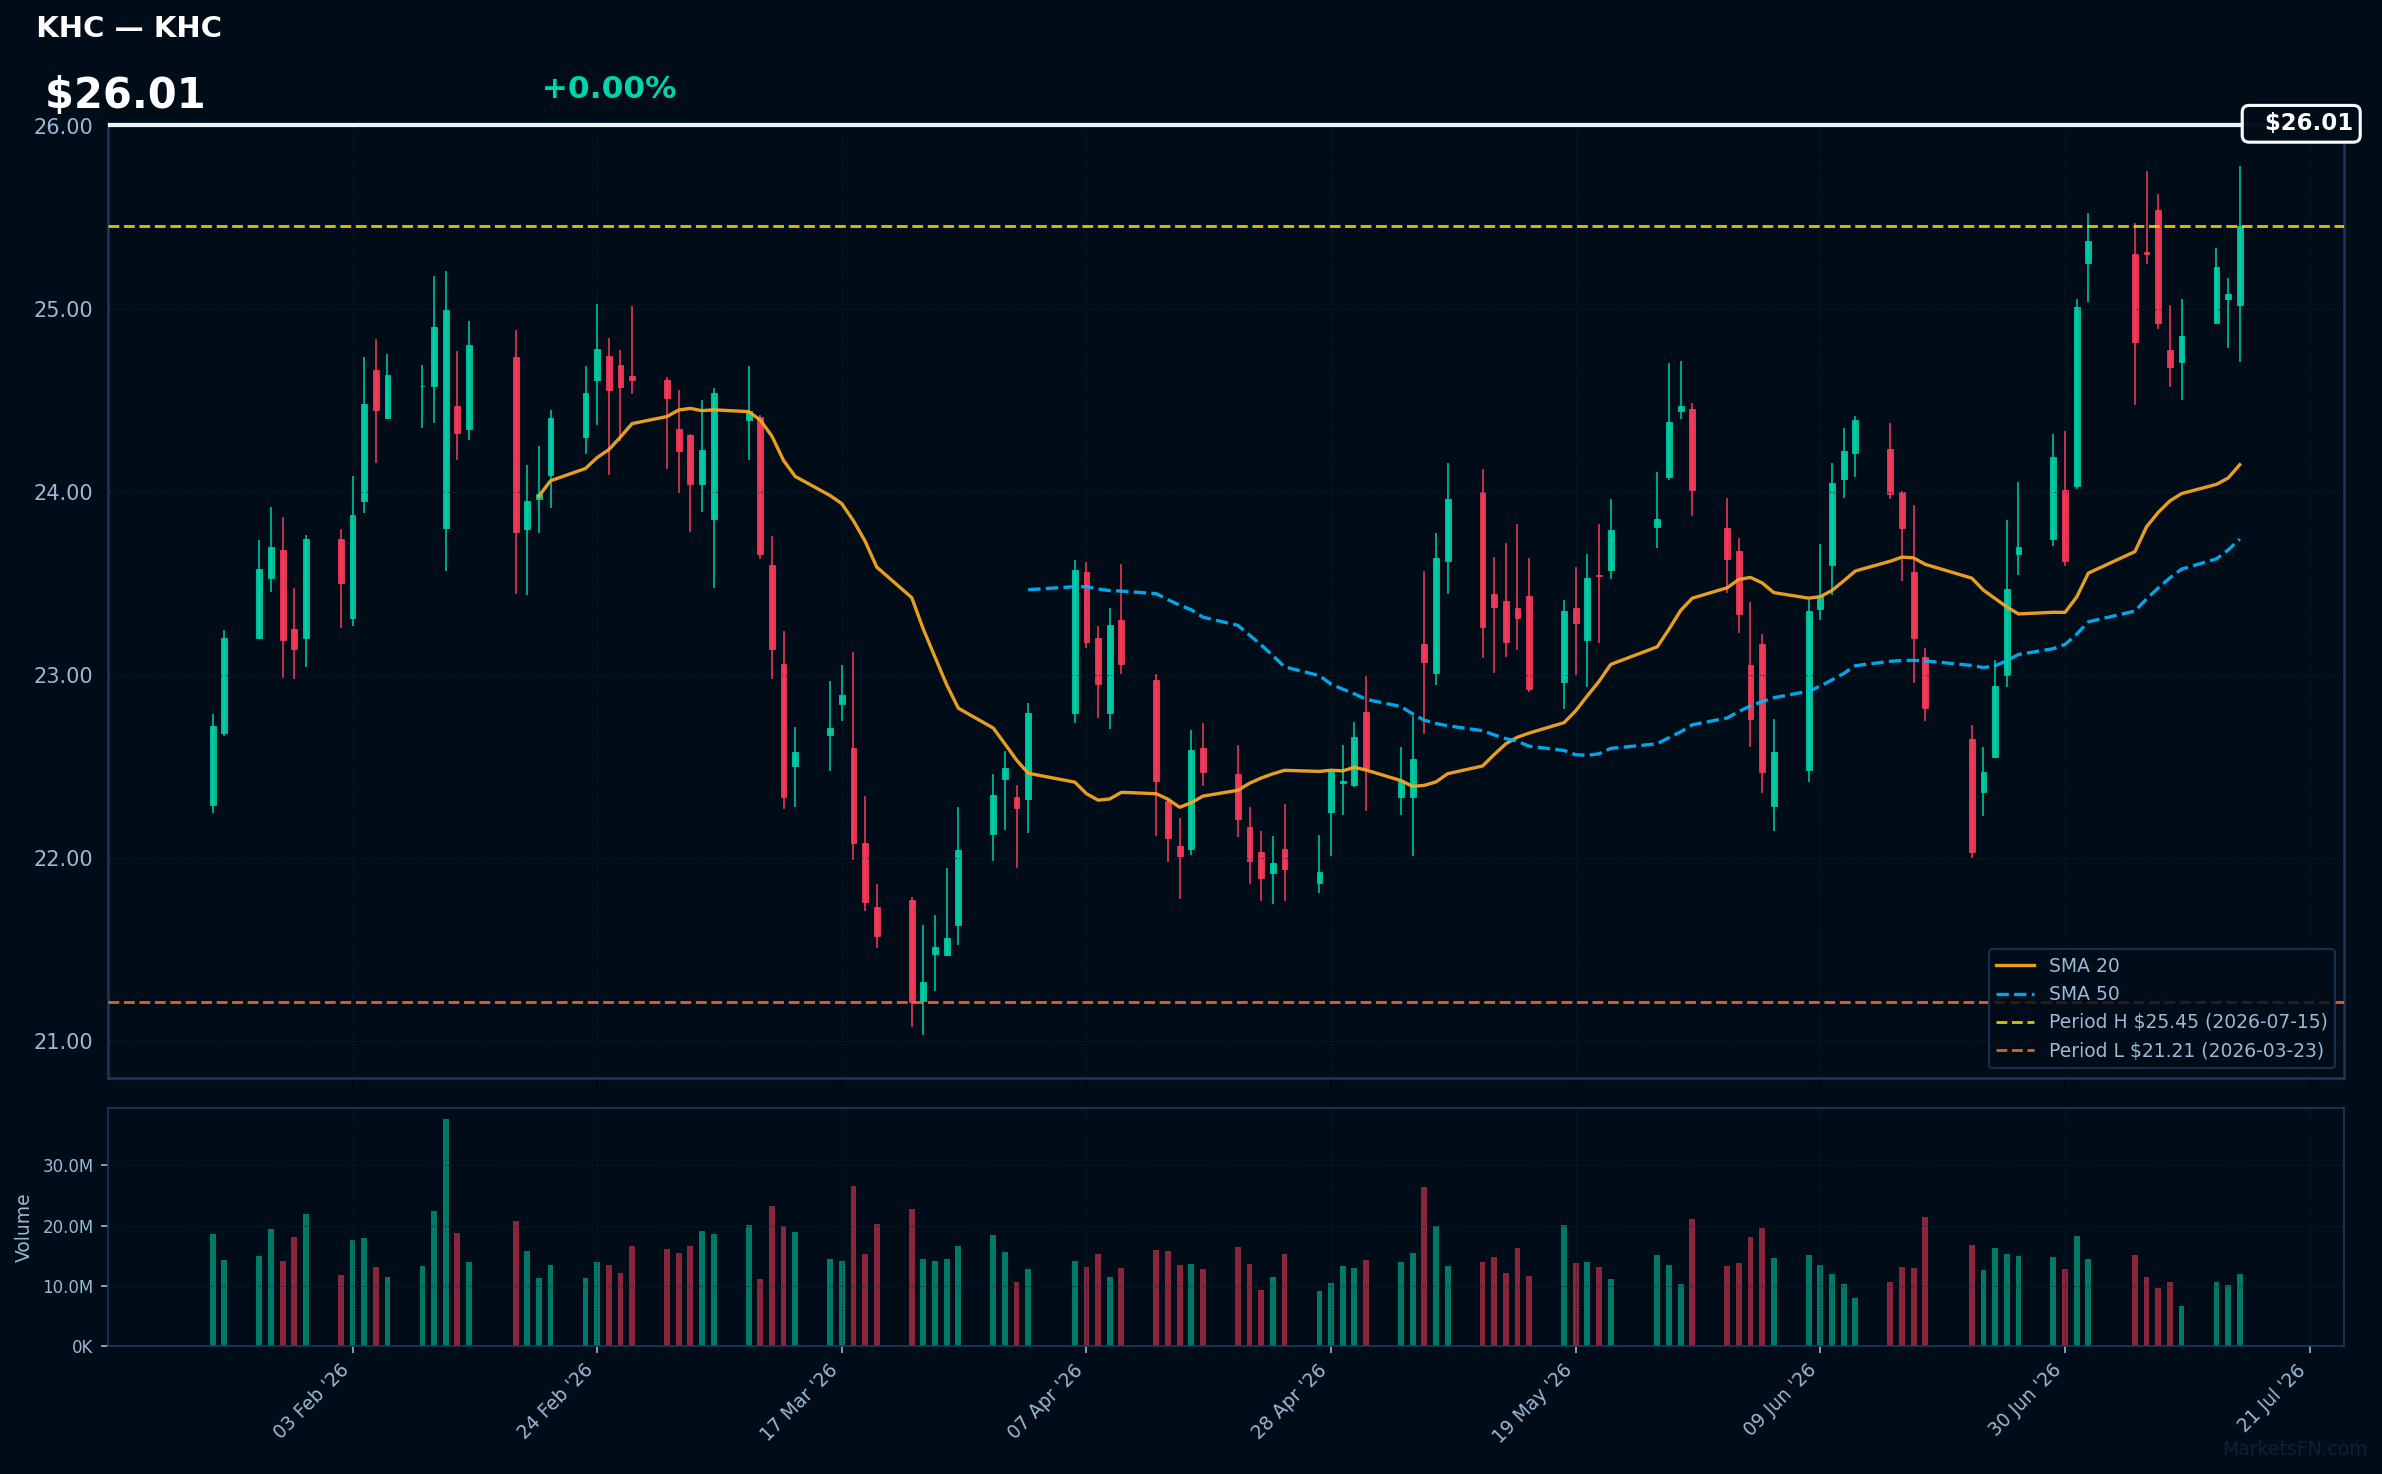
KHC | Kraft Heinz Co | Consumer Defensive | Price Last: $25.45 | % Realized: +4.35% | RSI: 65.1 | % above MA200: +6.4% | Trend: Above MA20, MA50, MA200
Kraft Heinz Co is a packaged food company with brands like Kraft and Heinz. Investors should care about its ability to maintain market share and pricing power in a competitive consumer staples market.
Kraft Heinz Co's RSI is 65.1, indicating rising momentum. The stock is above MA20, MA50, and MA200, showing a bullish trend. It's near its 2026 YTD high, up 4.3% YTD, suggesting potential for further breakout.
Related headlines
- The Kraft Heinz Company to Report Second Quarter 2026 Results on August 5, 2026
- Kraft Heinz Co. stock outperforms competitors on strong trading day
- From blacked out ketchup bottles to tiny ranch packets, Kraft Heinz adapts to World Cup
- Kraft Dinner Expands Beyond Mac n Cheese with All-New KD Ramen Lineup
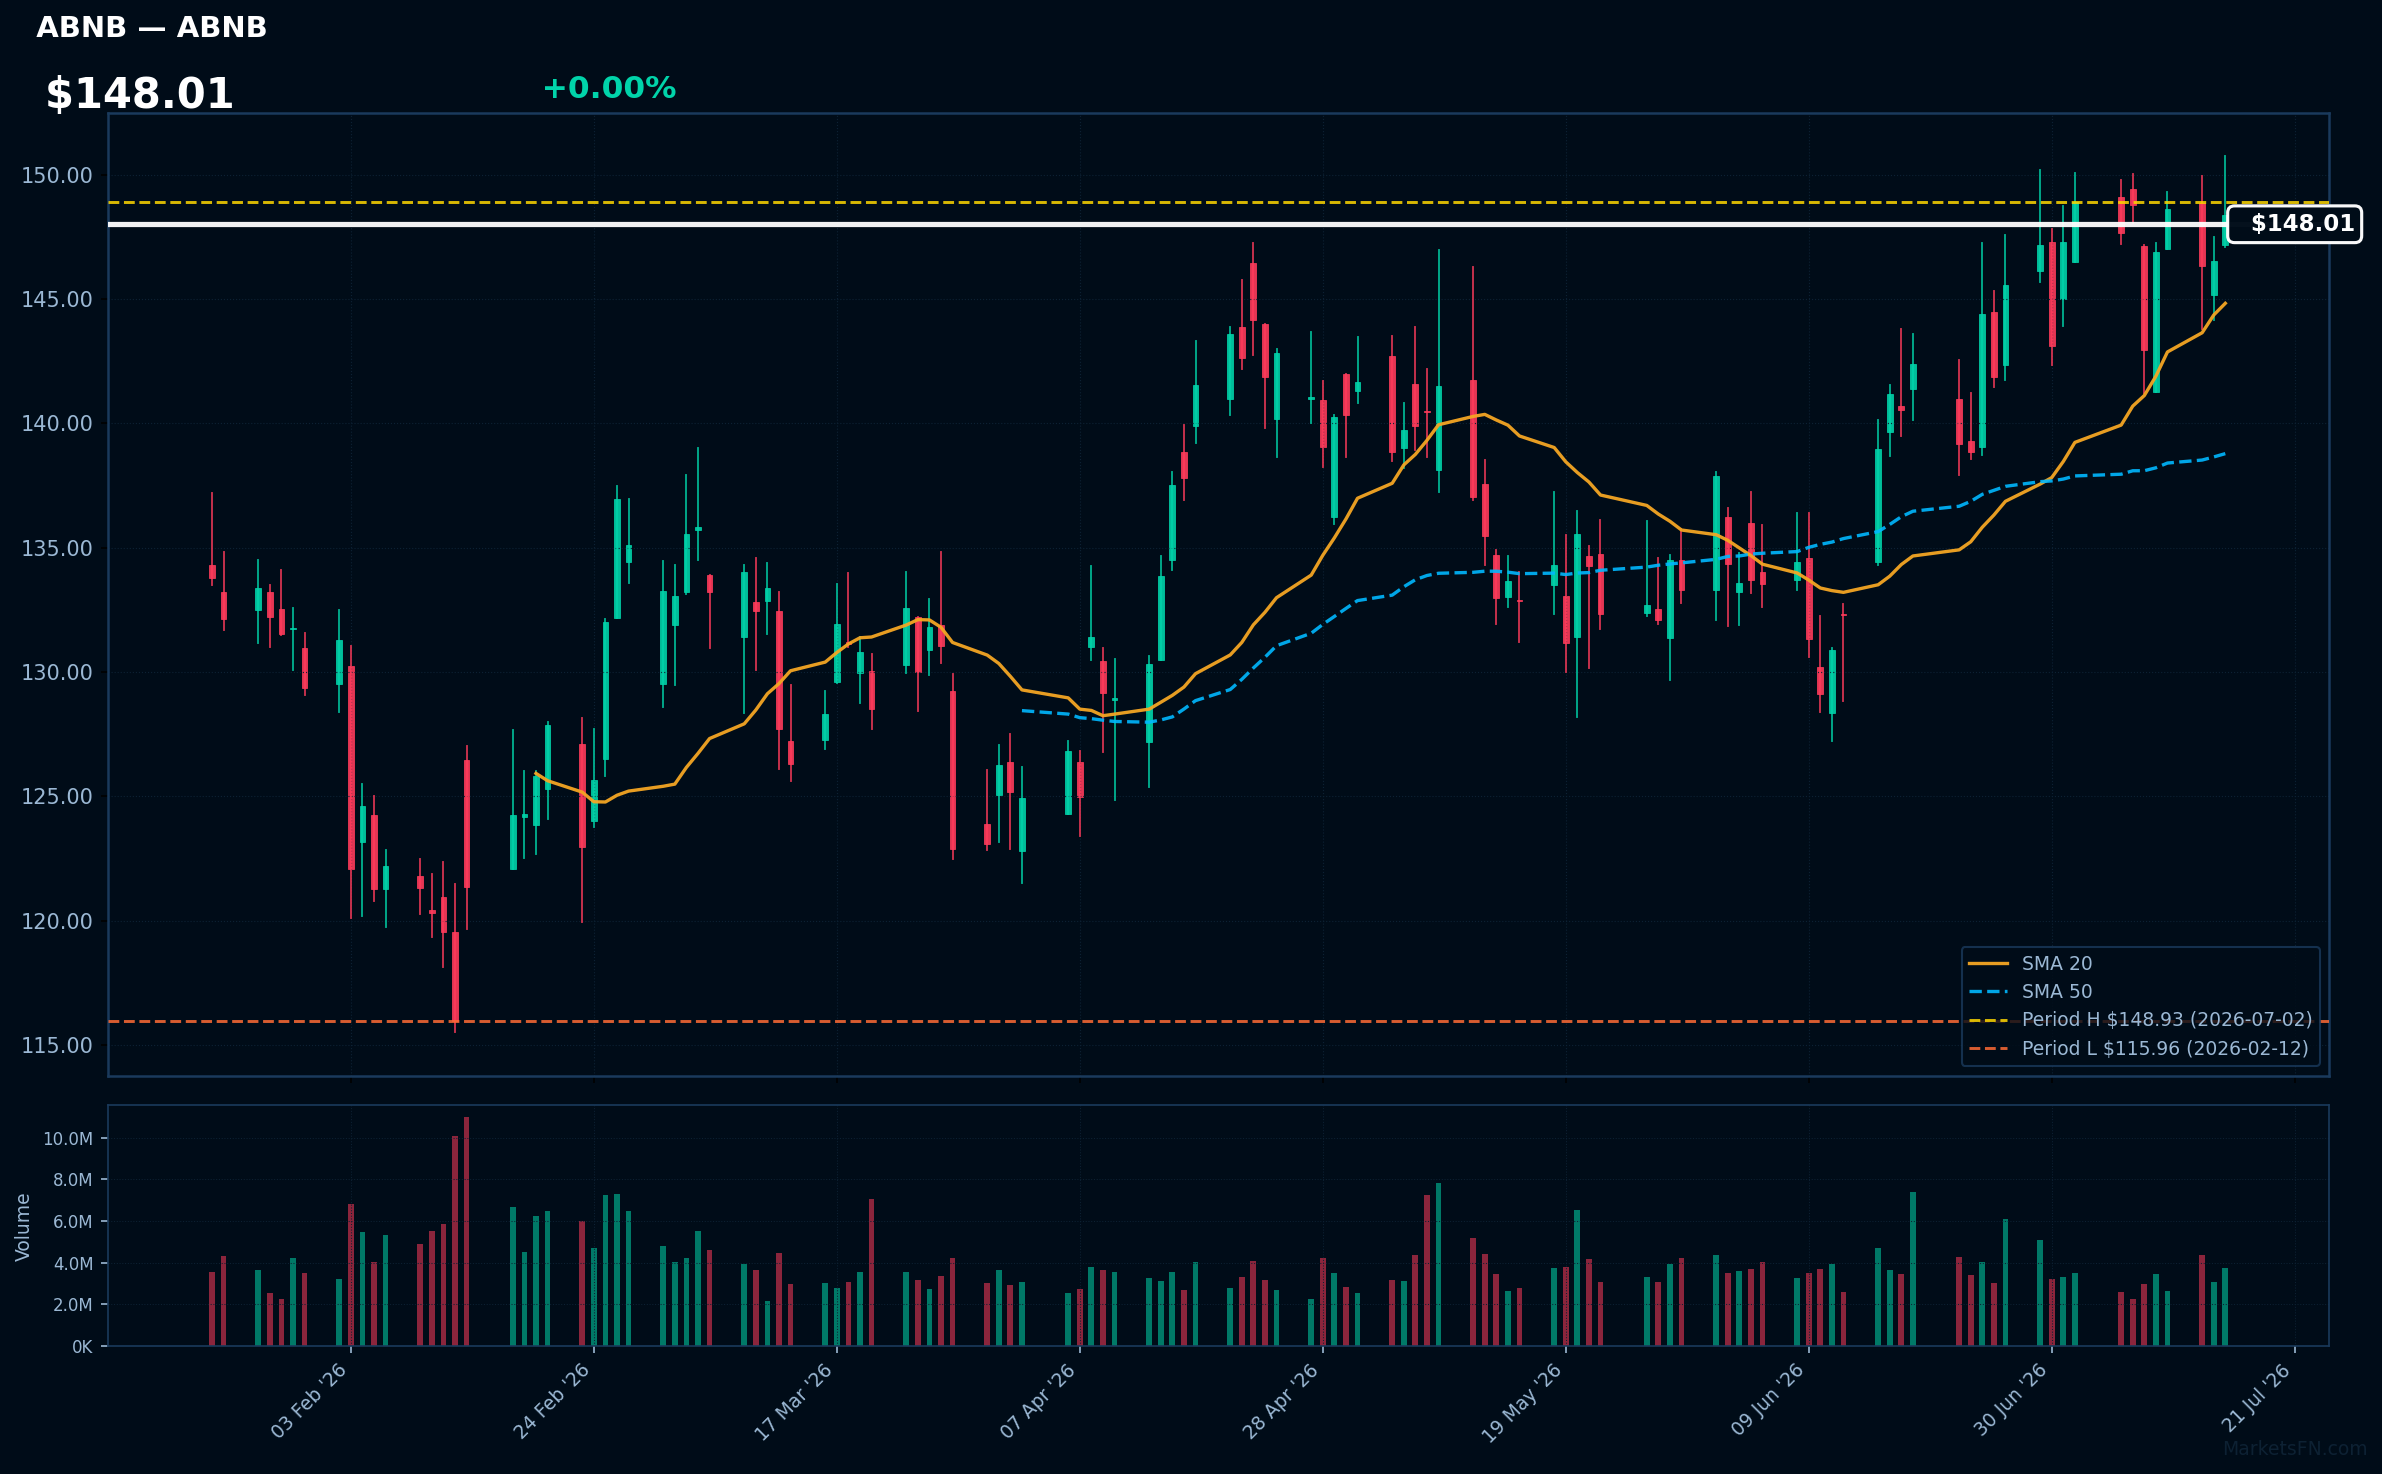
ABNB | Airbnb Inc | Consumer Cyclical | Price Last: $148.38 | % Realized: +11.56% | RSI: 57.8 | % above MA200: +13.2% | Trend: Above MA20, MA50, MA200
Airbnb Inc operates a short-term rental platform connecting hosts with travelers, generating revenue through service fees. Investors should care about its growth potential in the travel industry and competitive positioning.
Airbnb shows bullish technicals with RSI(14) at 57.8, price above MA20, MA50, and MA200, indicating sustained uptrend. Nearing its 2026 YTD high, being only 0.4% below, suggests potential breakout; 11.6% 2026 YTD return reinforces positive momentum.
Related headlines
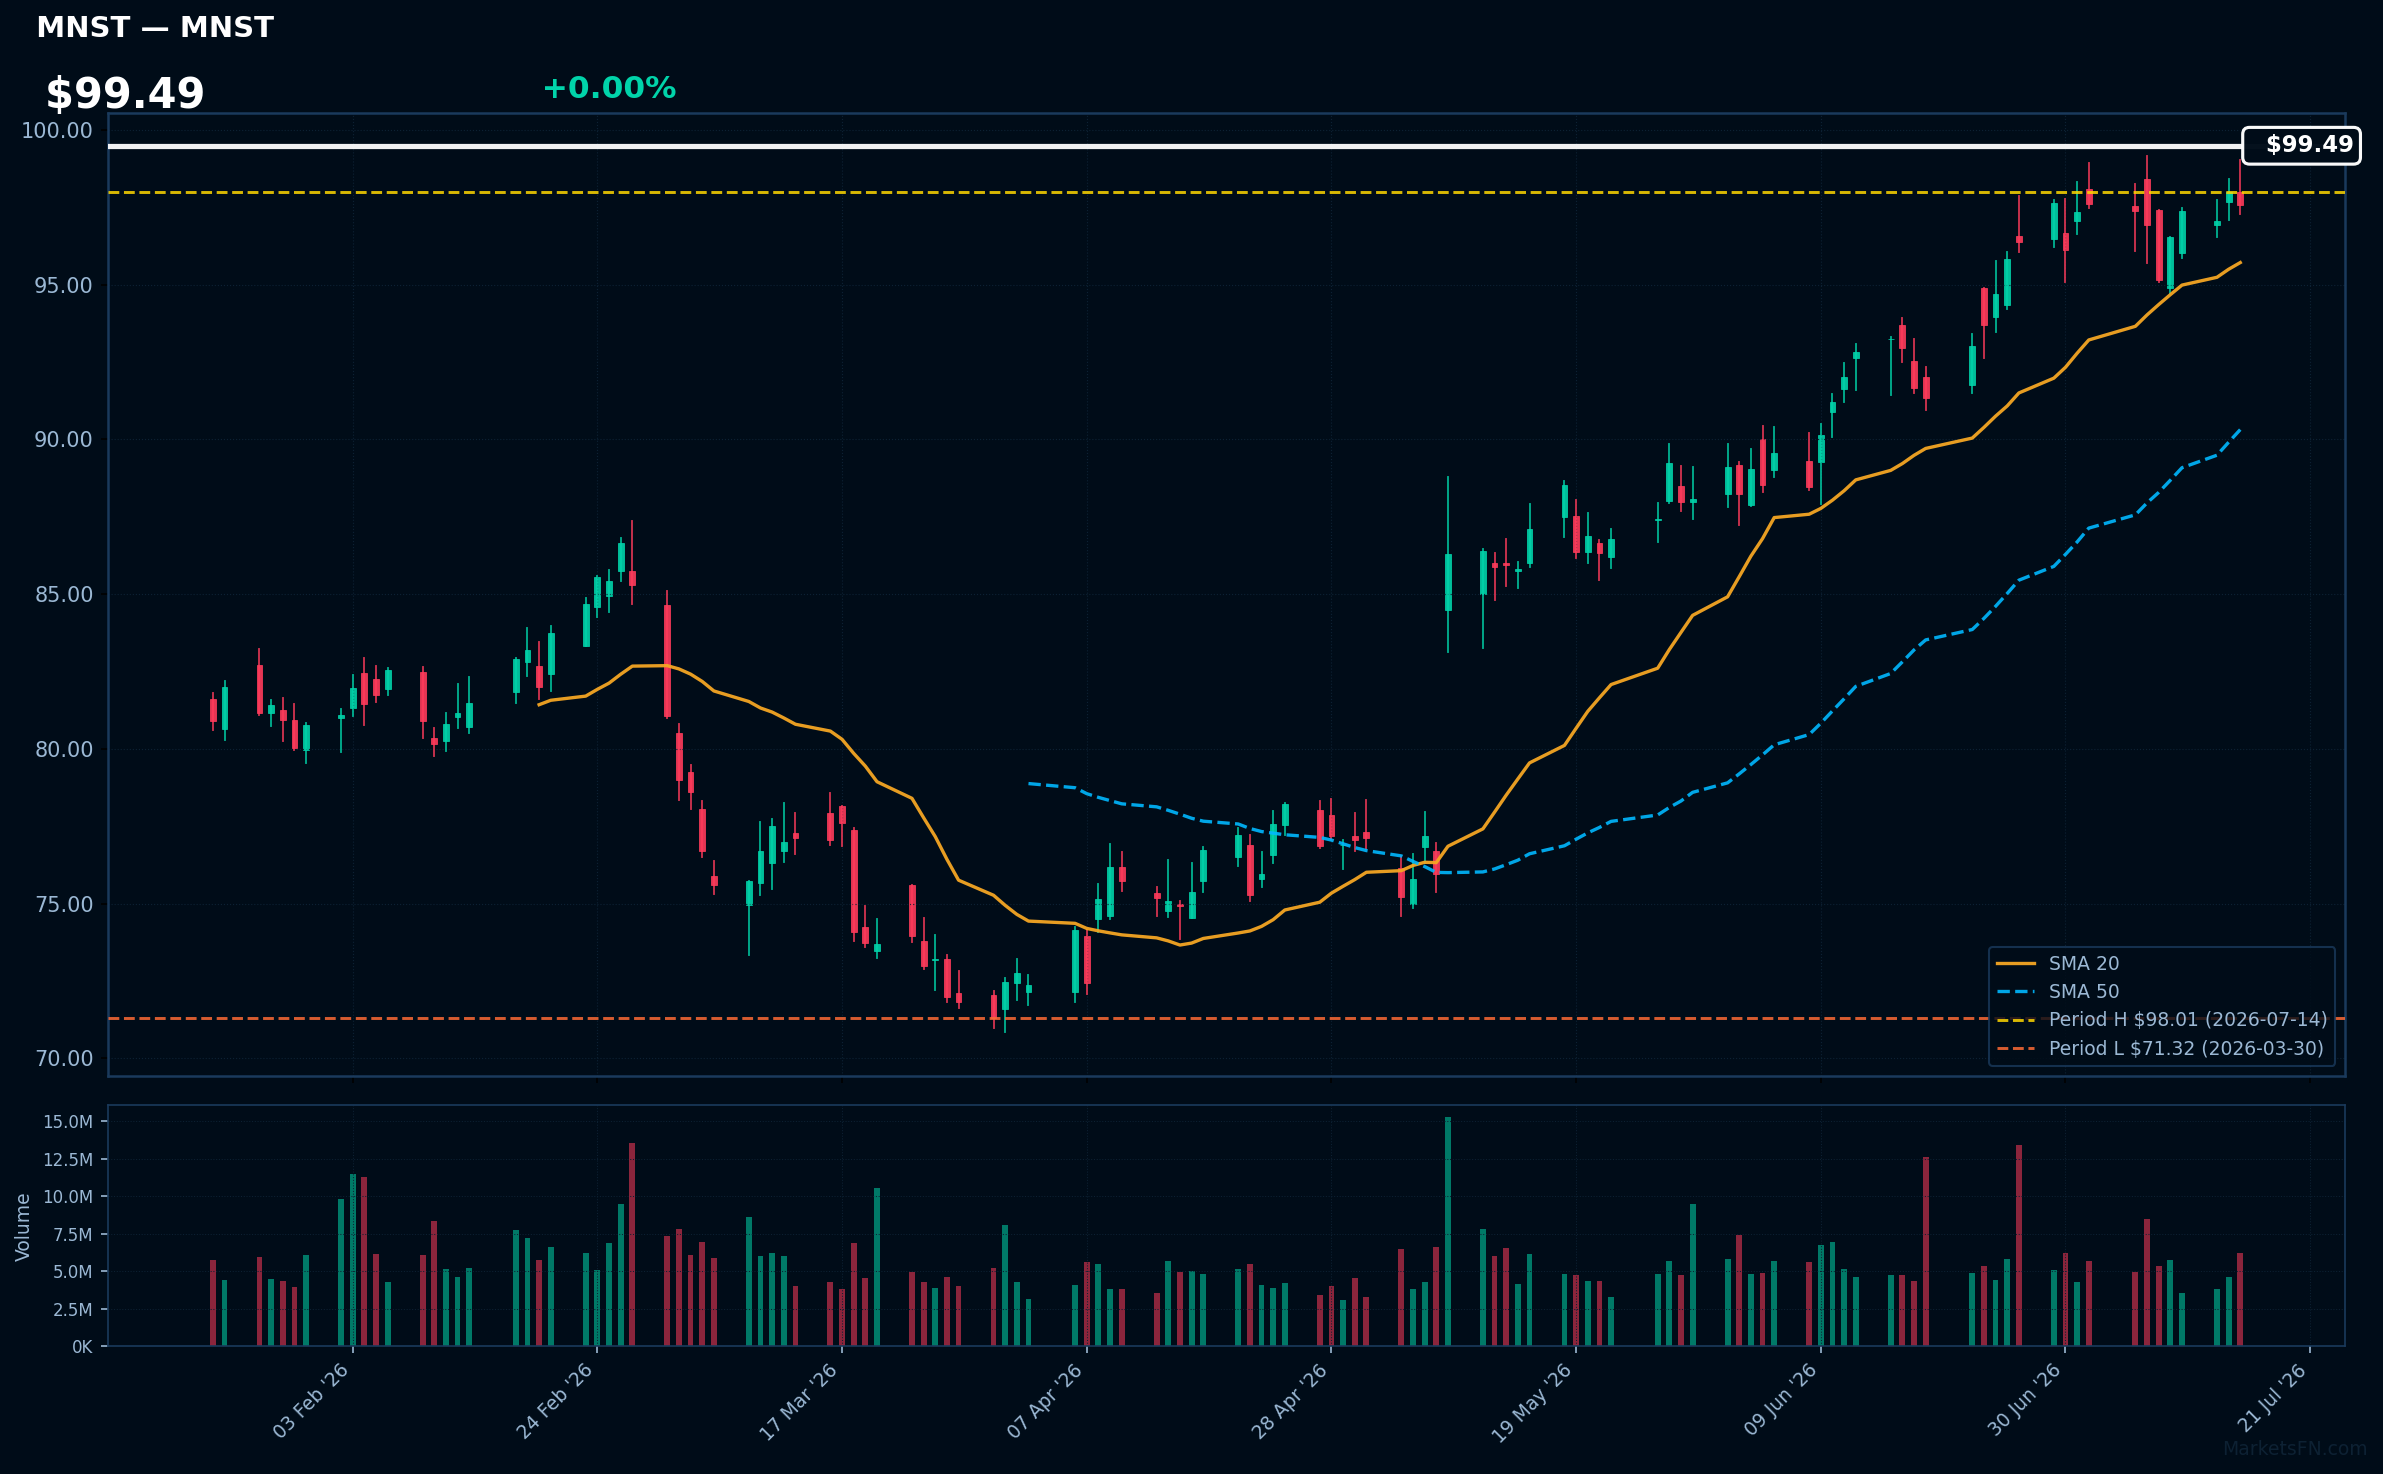
MNST | Monster Beverage Corp | Consumer Defensive | Price Last: $97.57 | % Realized: +28.11% | RSI: 69.2 | % above MA200: +23.4% | Trend: Above MA20, MA50, MA200
Monster Beverage Corp (MNST) is a leading energy drink manufacturer with popular brands like Monster Energy. Investors should care due to its strong brand portfolio and growth potential in the energy drink market.
The stock shows bullish technicals with RSI(14) at 69.2, price > MA20 > MA50 > MA200, and is 0.4% below its 2026 YTD high, indicating sustained uptrend and potential breakout momentum.
Related headlines
- Monster Beverage Declares Two-for-One Stock Split
- Massive Gap-Up Propels This Monster To Record High. These Clues Point To More Gains Ahead.
- Monster Beverage Announces Participation in dbAccess Global Consumer Conference 2026
- Dow Jones Leader Amazon, AI Stock Quanta, Monster Beverage In Or Near Buy Zones
📉 Nearest to 2026 Low
Sectors represented: Healthcare (2), Consumer Defensive (1), Consumer Cyclical (1), Industrials (1)
| Ticker | Company | Sector | Price Last | % Realized | 2026 YTD Low Date | RSI | % above MA200 | Trend |
|---|---|---|---|---|---|---|---|---|
| PEP | PepsiCo Inc | Consumer Defensive | $135.40 | -4.80% | 2026-06-30 | 44.8 | -9.7% | Below MA20, MA50, MA200 |
| ORLY | O'Reilly Automotive, Inc | Consumer Cyclical | $82.73 | -8.42% | 2026-07-15 | 44.6 | -12.0% | Below MA20, MA50, MA200 |
| CPRT | Copart, Inc | Industrials | $27.28 | -27.77% | 2026-07-15 | 39.8 | -25.8% | Below MA20, MA50, MA200 |
| AZN | Astrazeneca plc ADR | Healthcare | $168.37 | -8.06% | 2026-07-14 | 38.4 | -8.8% | Below MA20, MA50, MA200 |
| ISRG | Intuitive Surgical Inc | Healthcare | $388.97 | -30.79% | 2026-07-14 | 46.0 | -20.1% | Below MA20, MA50, MA200 |
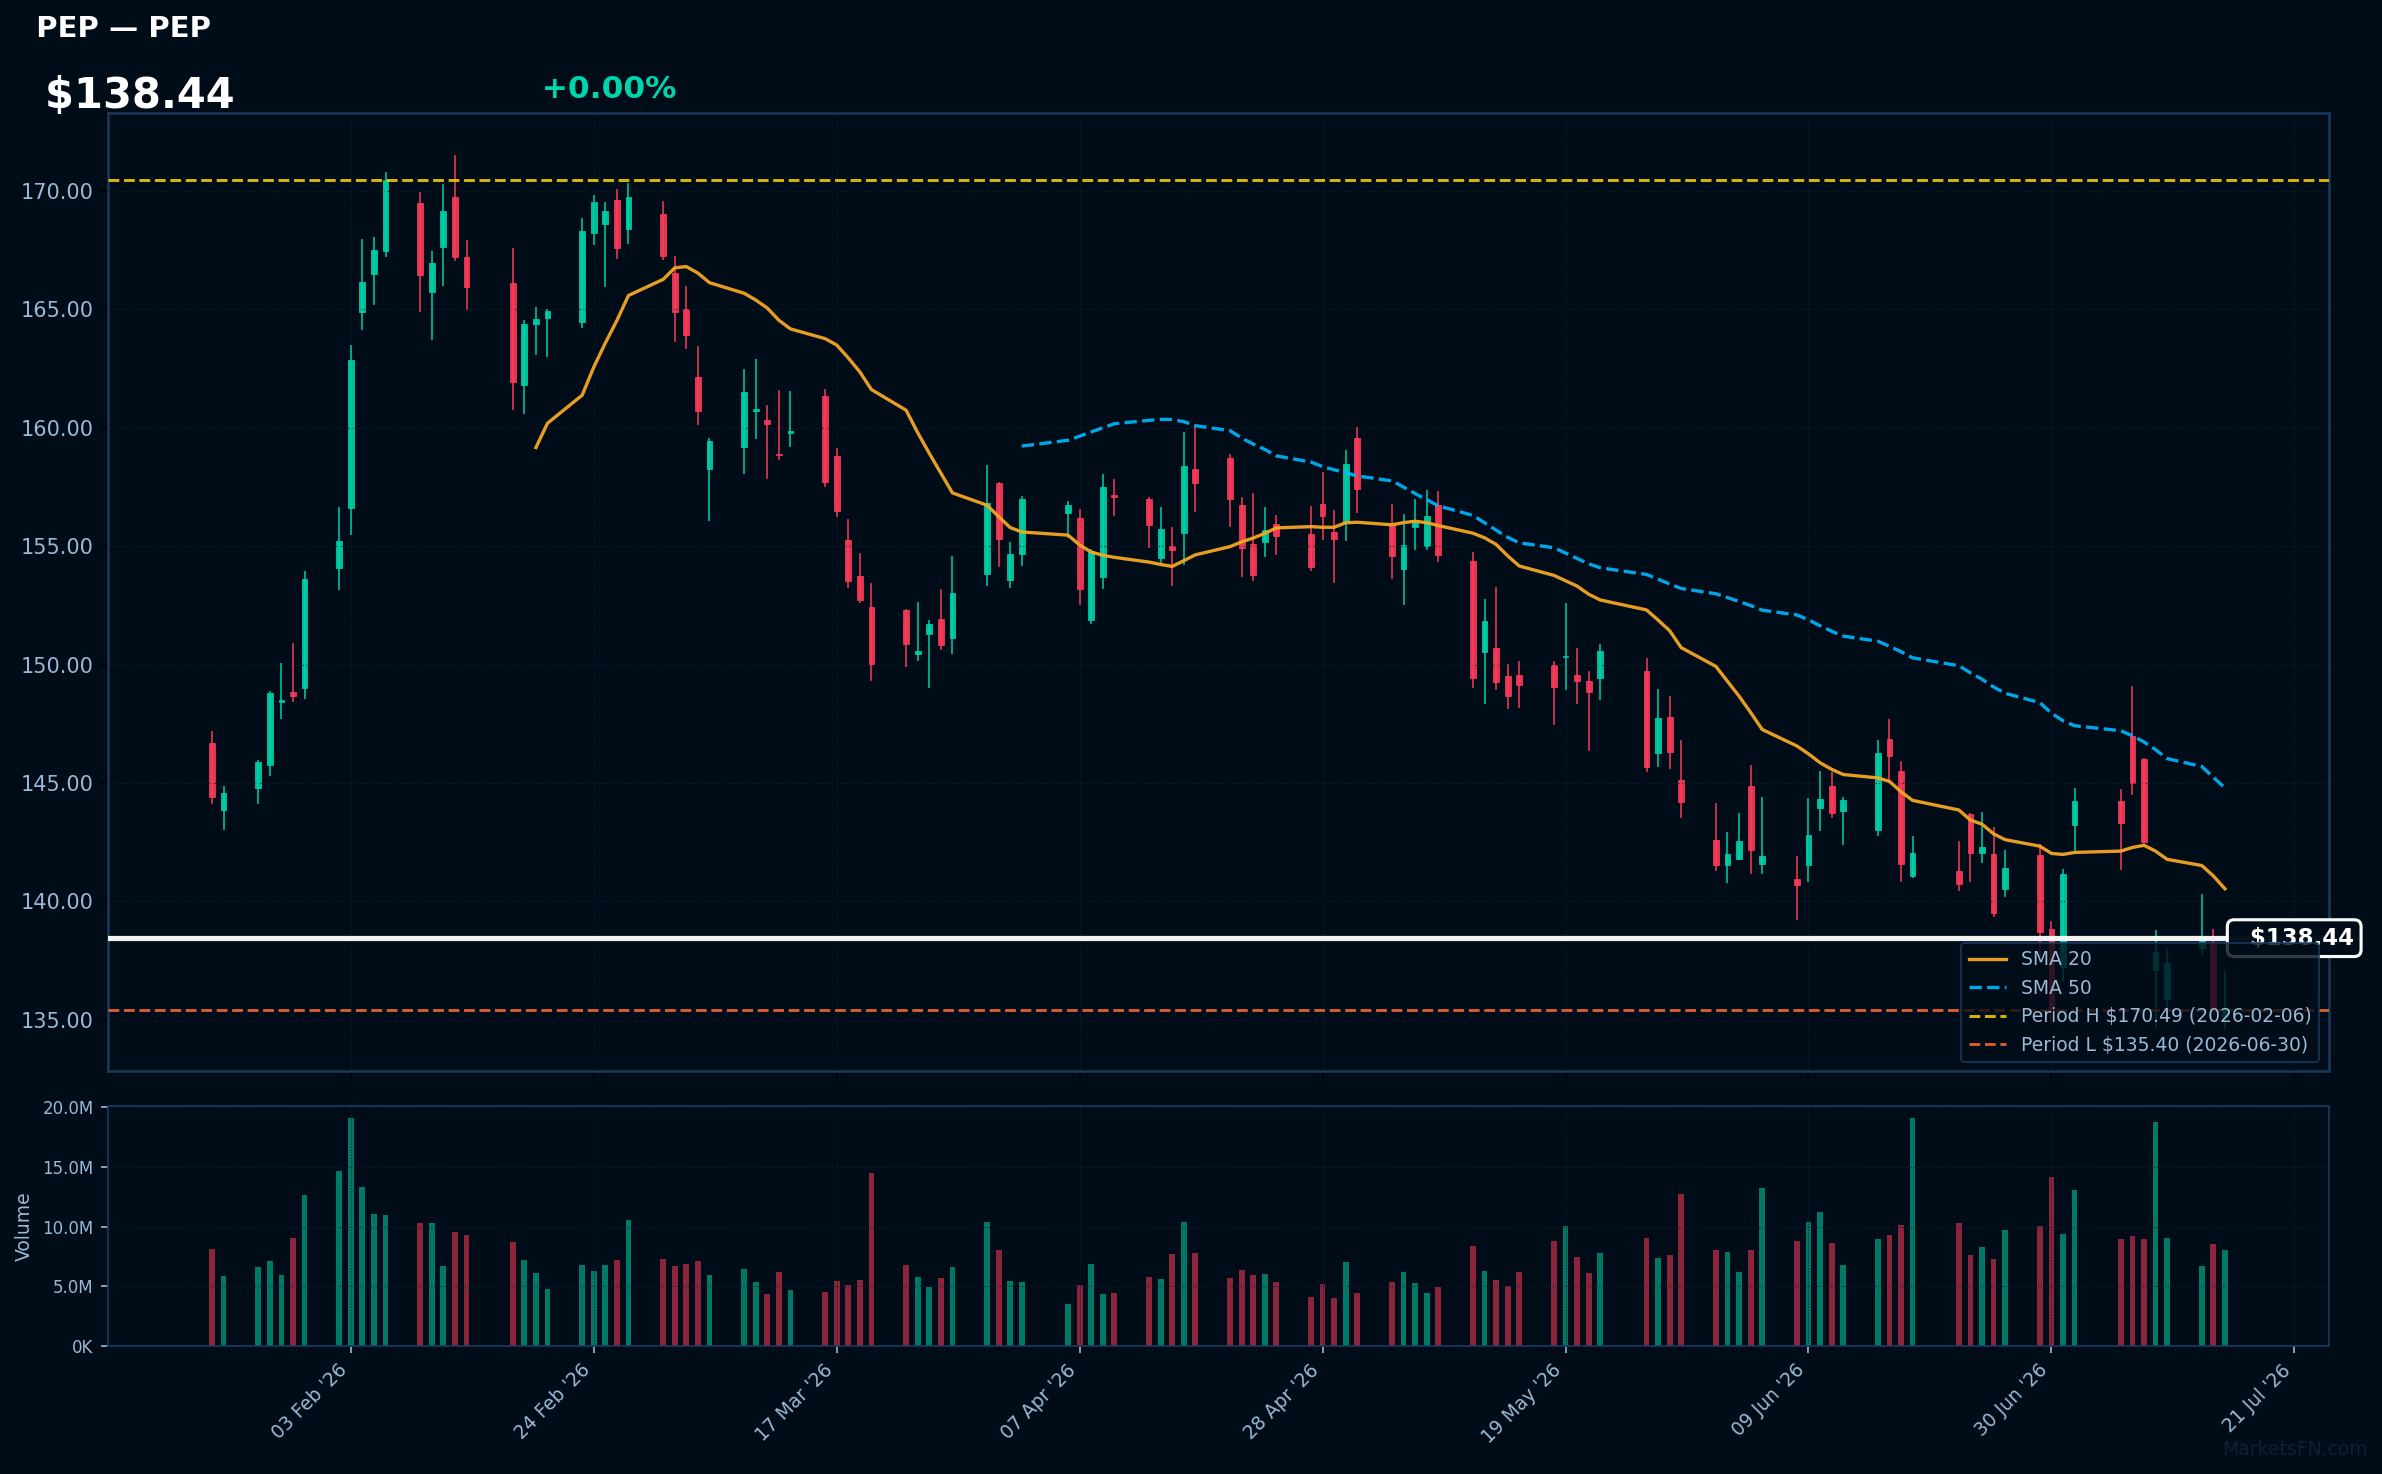
PEP | PepsiCo Inc | Consumer Defensive | Price Last: $135.40 | % Realized: -4.80% | RSI: 44.8 | % above MA200: -9.7% | Trend: Below MA20, MA50, MA200
PepsiCo Inc is a global food and beverage leader with brands like Pepsi, Lay's, and Gatorade, generating revenue through beverage sales, snack foods, and other categories. Investors care about its diversified portfolio and market share in the consumer staples sector.
PepsiCo Inc's current technical situation is bearish, with an RSI(14) of 44.8 indicating neutral momentum, but a sustained downtrend as price ($138.44) remains below MA20, MA50, and MA200, and is 0.0% above its 2026 YTD low, testing major support.
Related headlines
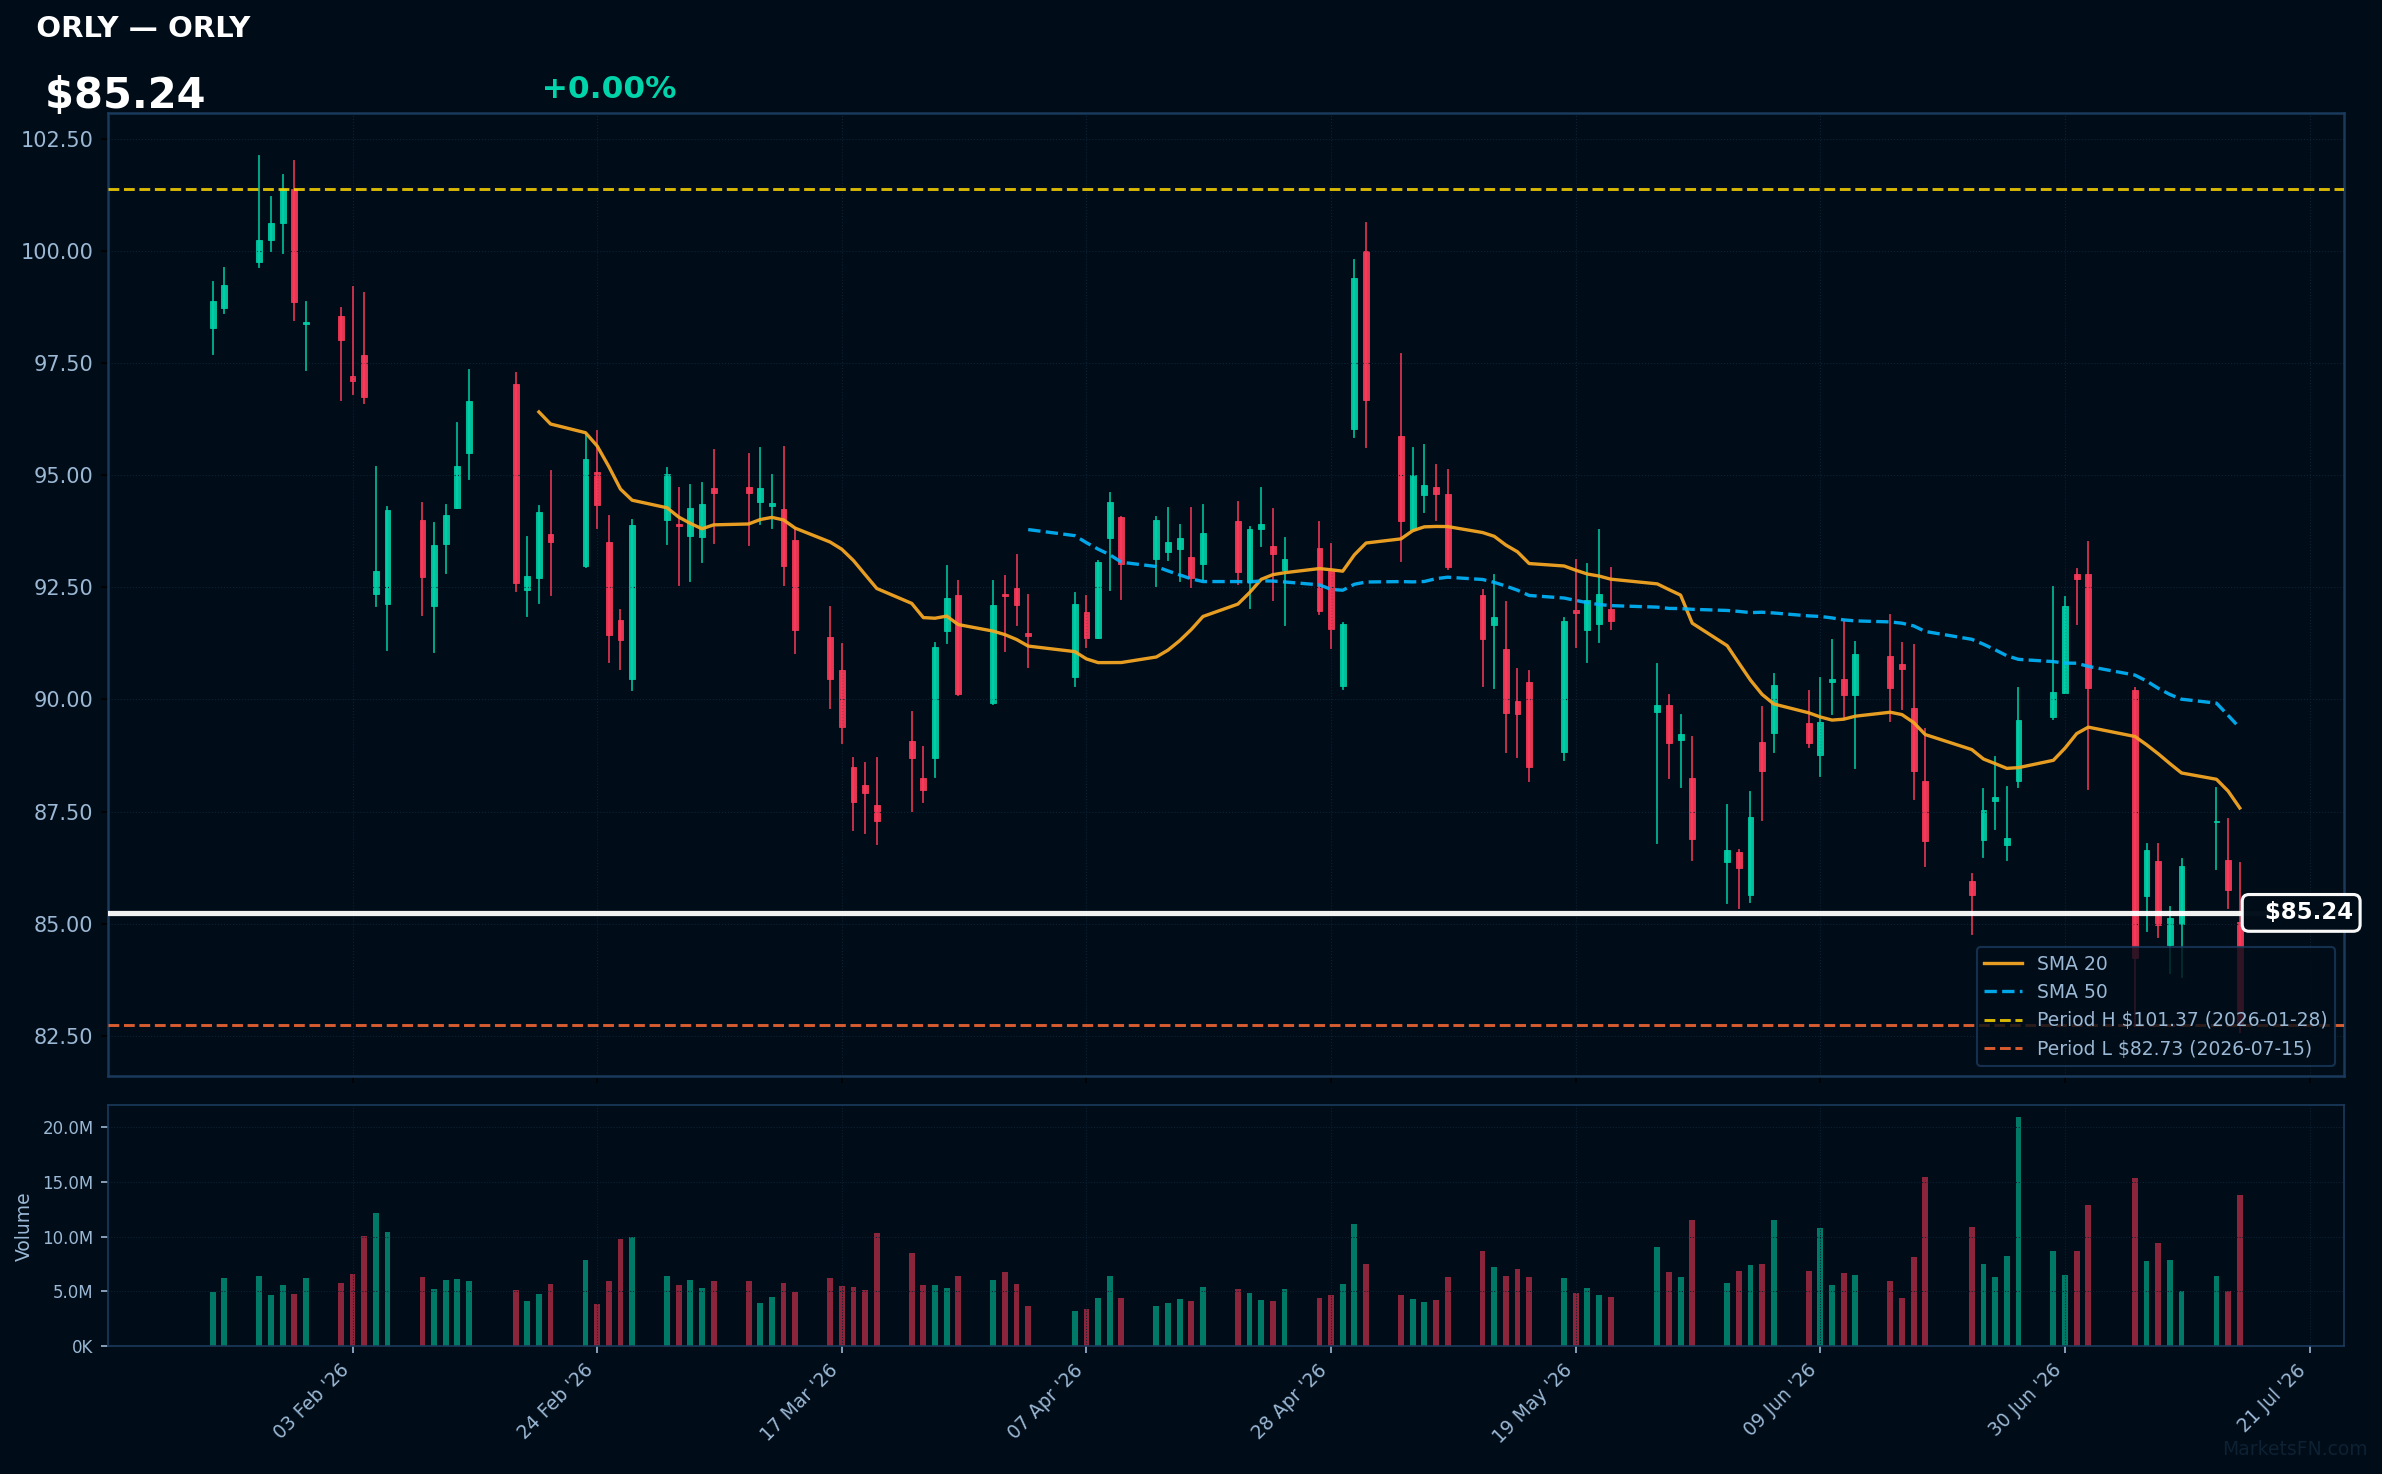
ORLY | O'Reilly Automotive, Inc | Consumer Cyclical | Price Last: $82.73 | % Realized: -8.42% | RSI: 44.6 | % above MA200: -12.0% | Trend: Below MA20, MA50, MA200
O'Reilly Automotive, Inc (ORLY) operates a network of retail stores selling automotive aftermarket parts, tools, and supplies. Investors care due to its market share and exposure to the large and relatively stable auto parts replacement market.
ORLY's technicals indicate a sustained downtrend with price at $85.24, below MA20, MA50, and MA200. RSI(14) is 44.6, nearing oversold territory. The stock is testing major support at its 2026 YTD low, having returned -8.4% YTD.
Related headlines
- Why Did REE, HTZ, ORLY Stocks Slump To 52-Week Lows Today?
- O'Reilly Stock Sinks on Report of Possible NAPA Bid
- GPC Stock Pops 13%, ORLY Falls 5% OReilly Makes Cash Bid For Genuine Parts $10B Auto Unit, Says Report
- O'Reilly Automotive, Inc. Announces Dates for Its Second Quarter 2026 Earnings Release and Conference Call
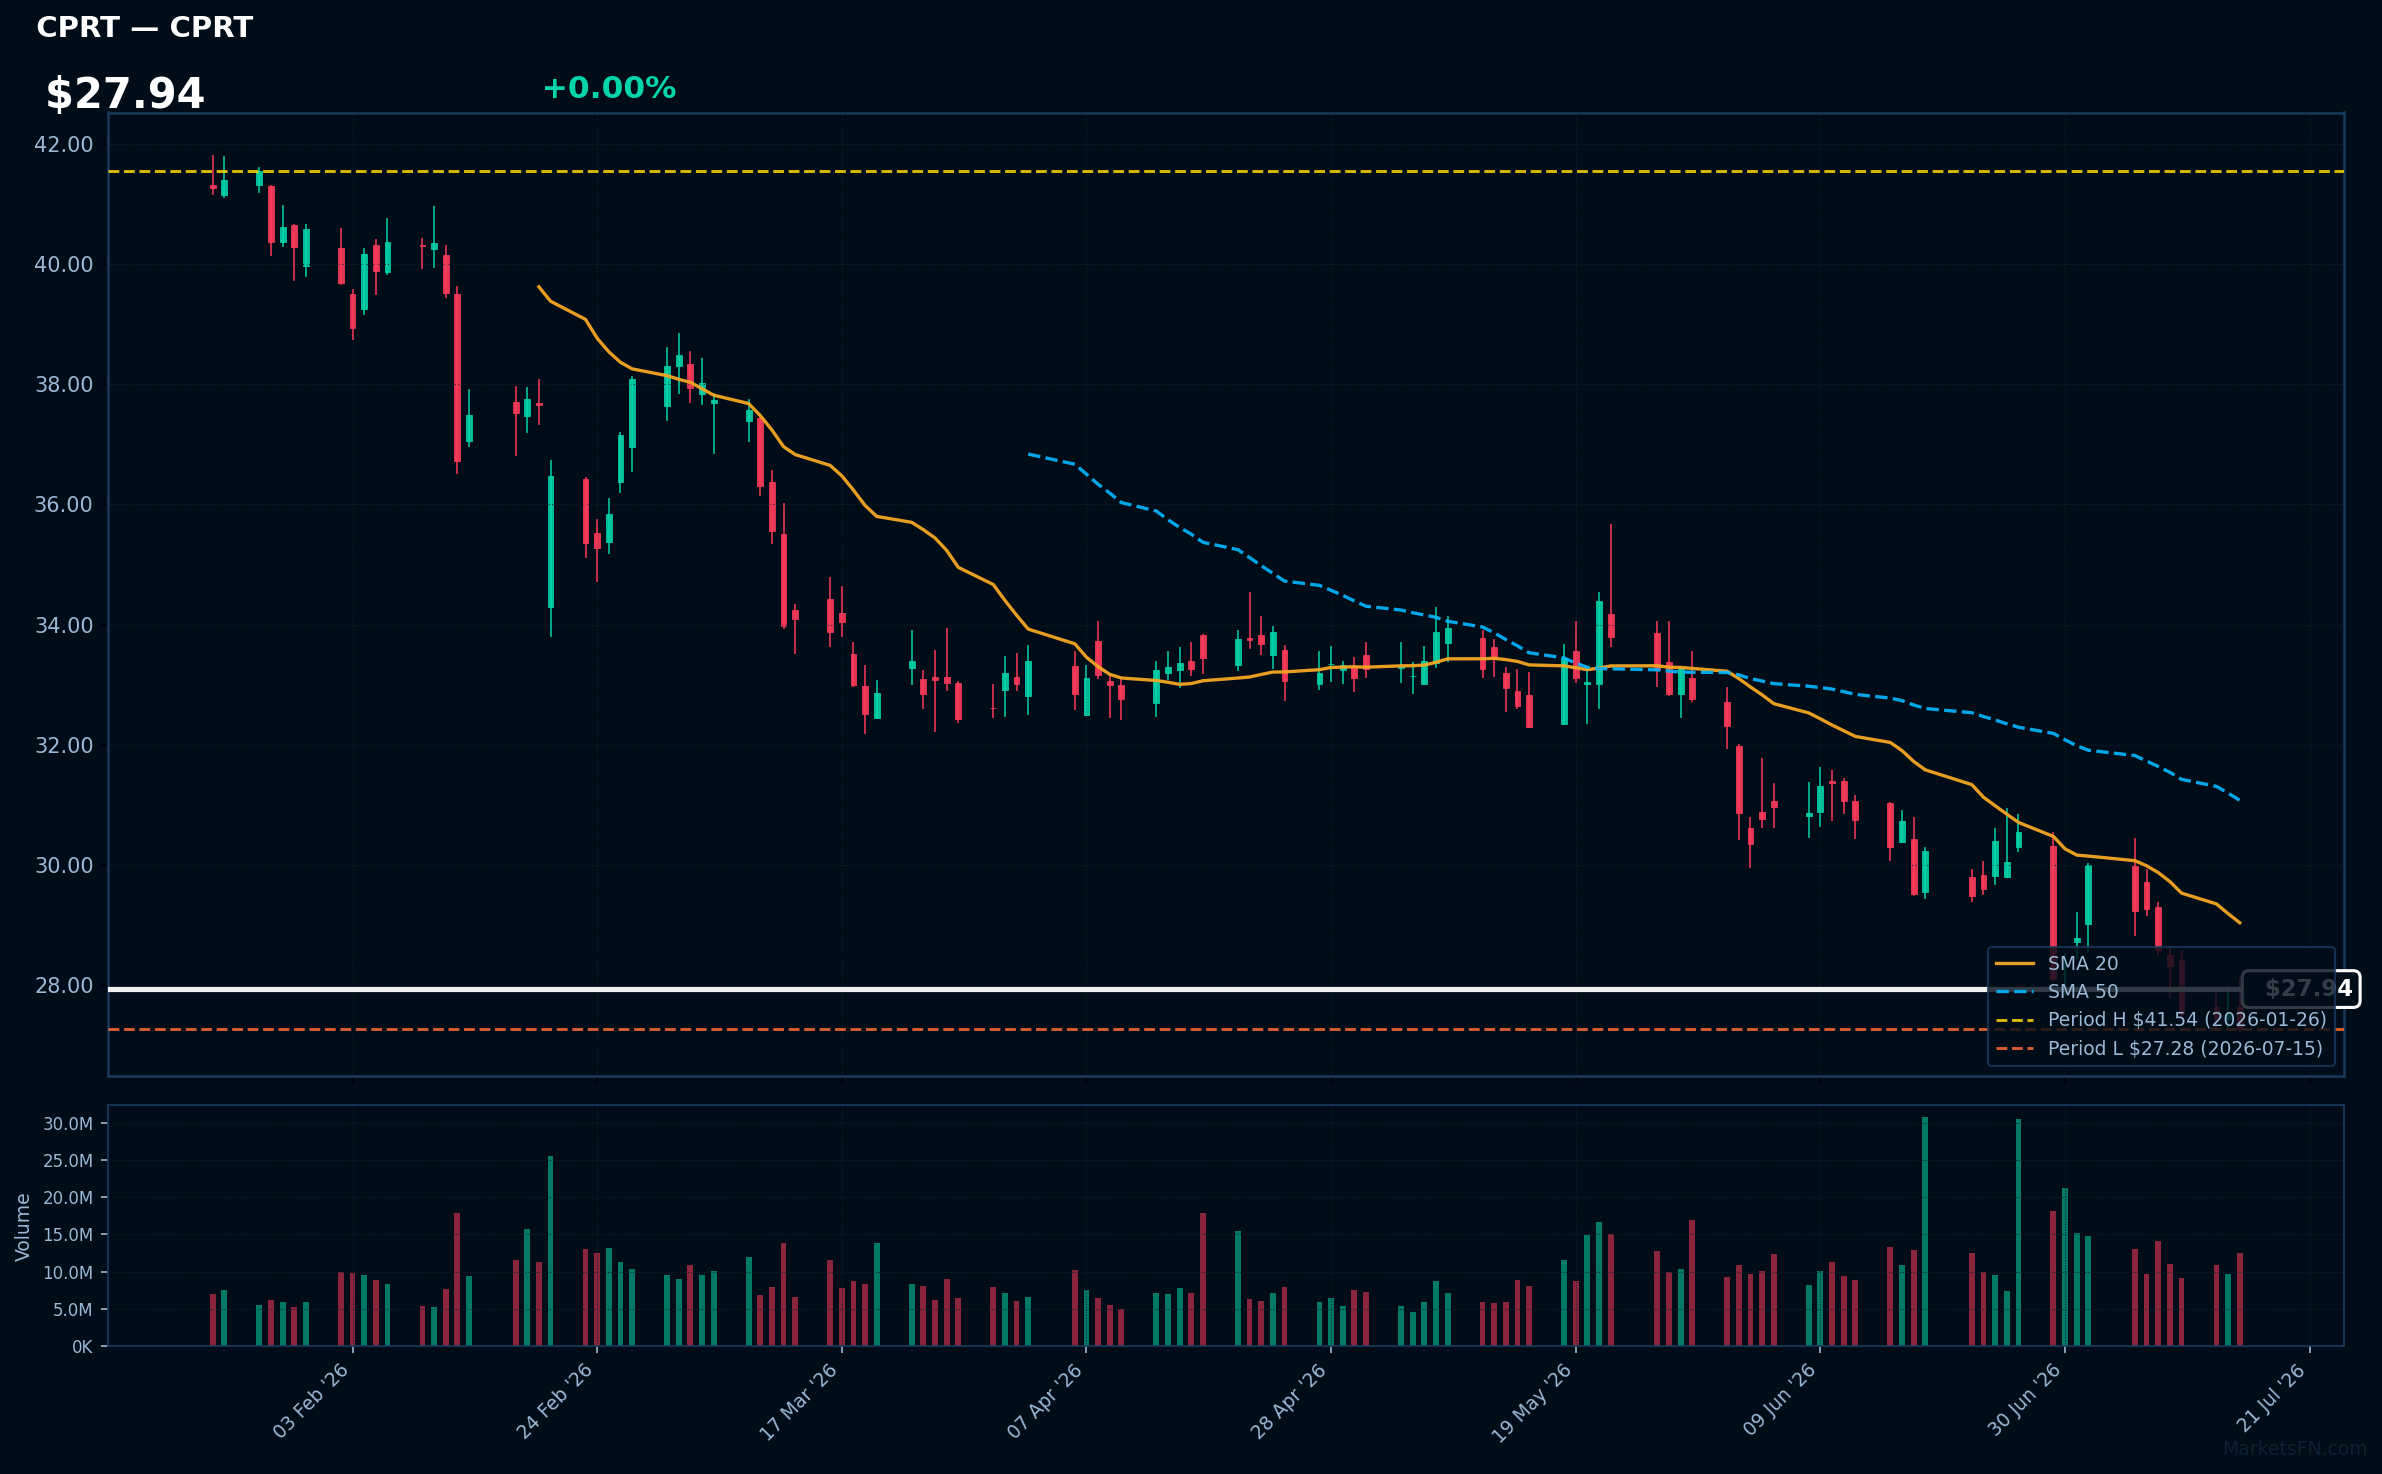
CPRT | Copart, Inc | Industrials | Price Last: $27.28 | % Realized: -27.77% | RSI: 39.8 | % above MA200: -25.8% | Trend: Below MA20, MA50, MA200
Copart, Inc (CPRT) operates an online vehicle auction platform and provides related services, allowing insurance companies and other sellers to sell damaged or used vehicles to buyers worldwide. Investors care due to its market dominance and growth potential in the vehicle remarketing industry.
Copart's technical situation indicates a sustained downtrend with price ($27.94) below MA20, MA50, and MA200. The RSI(14) is 39.8, nearing oversold territory. The stock is testing major support at its 2026 YTD low, having fallen 27.8% YTD, potentially a warning sign.
Related headlines
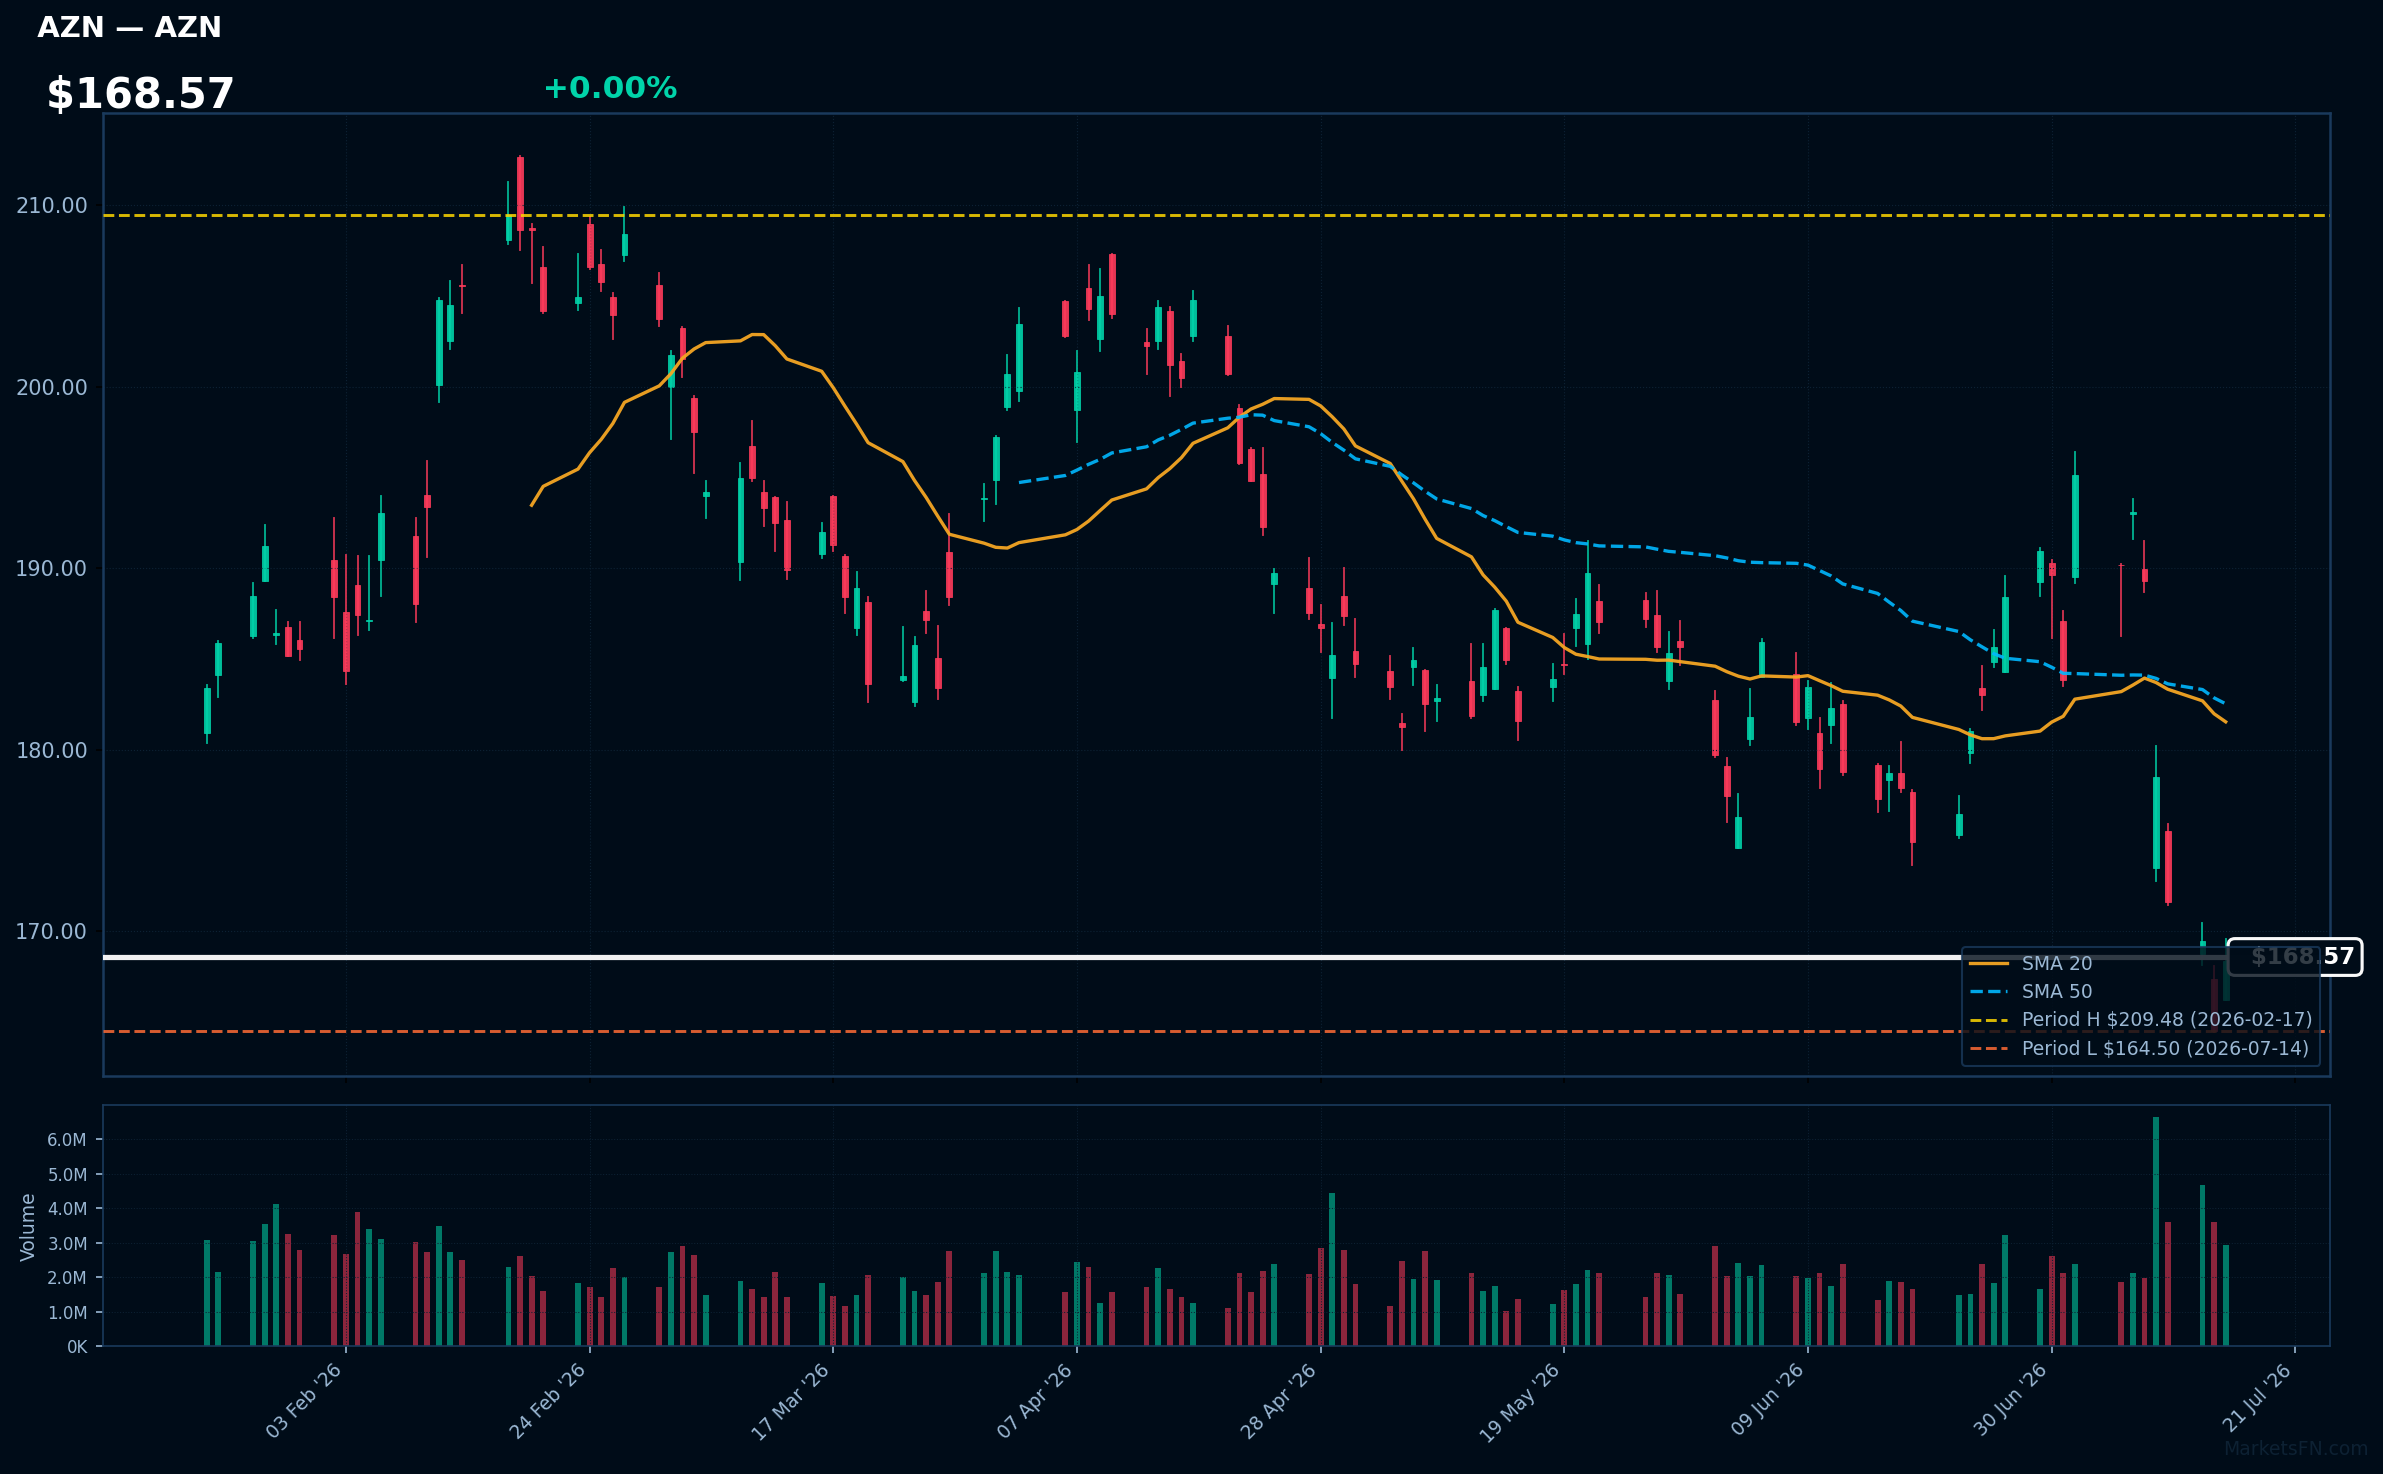
AZN | Astrazeneca plc ADR | Healthcare | Price Last: $168.37 | % Realized: -8.06% | RSI: 38.4 | % above MA200: -8.8% | Trend: Below MA20, MA50, MA200
Astrazeneca plc ADR is a biopharmaceutical company that discovers, develops, and commercializes prescription medicines. Investors should care about its pipeline and product portfolio, particularly for treatments in areas like oncology and cardiovascular diseases, which drive revenue growth.
Astrazeneca plc ADR's current technical situation is bearish, with an RSI(14) of 38.4 indicating oversold conditions, and a sustained downtrend as price ($168.57) remains below MA20, MA50, and MA200, with the stock 2.4% above its 2026 YTD low.
Related headlines
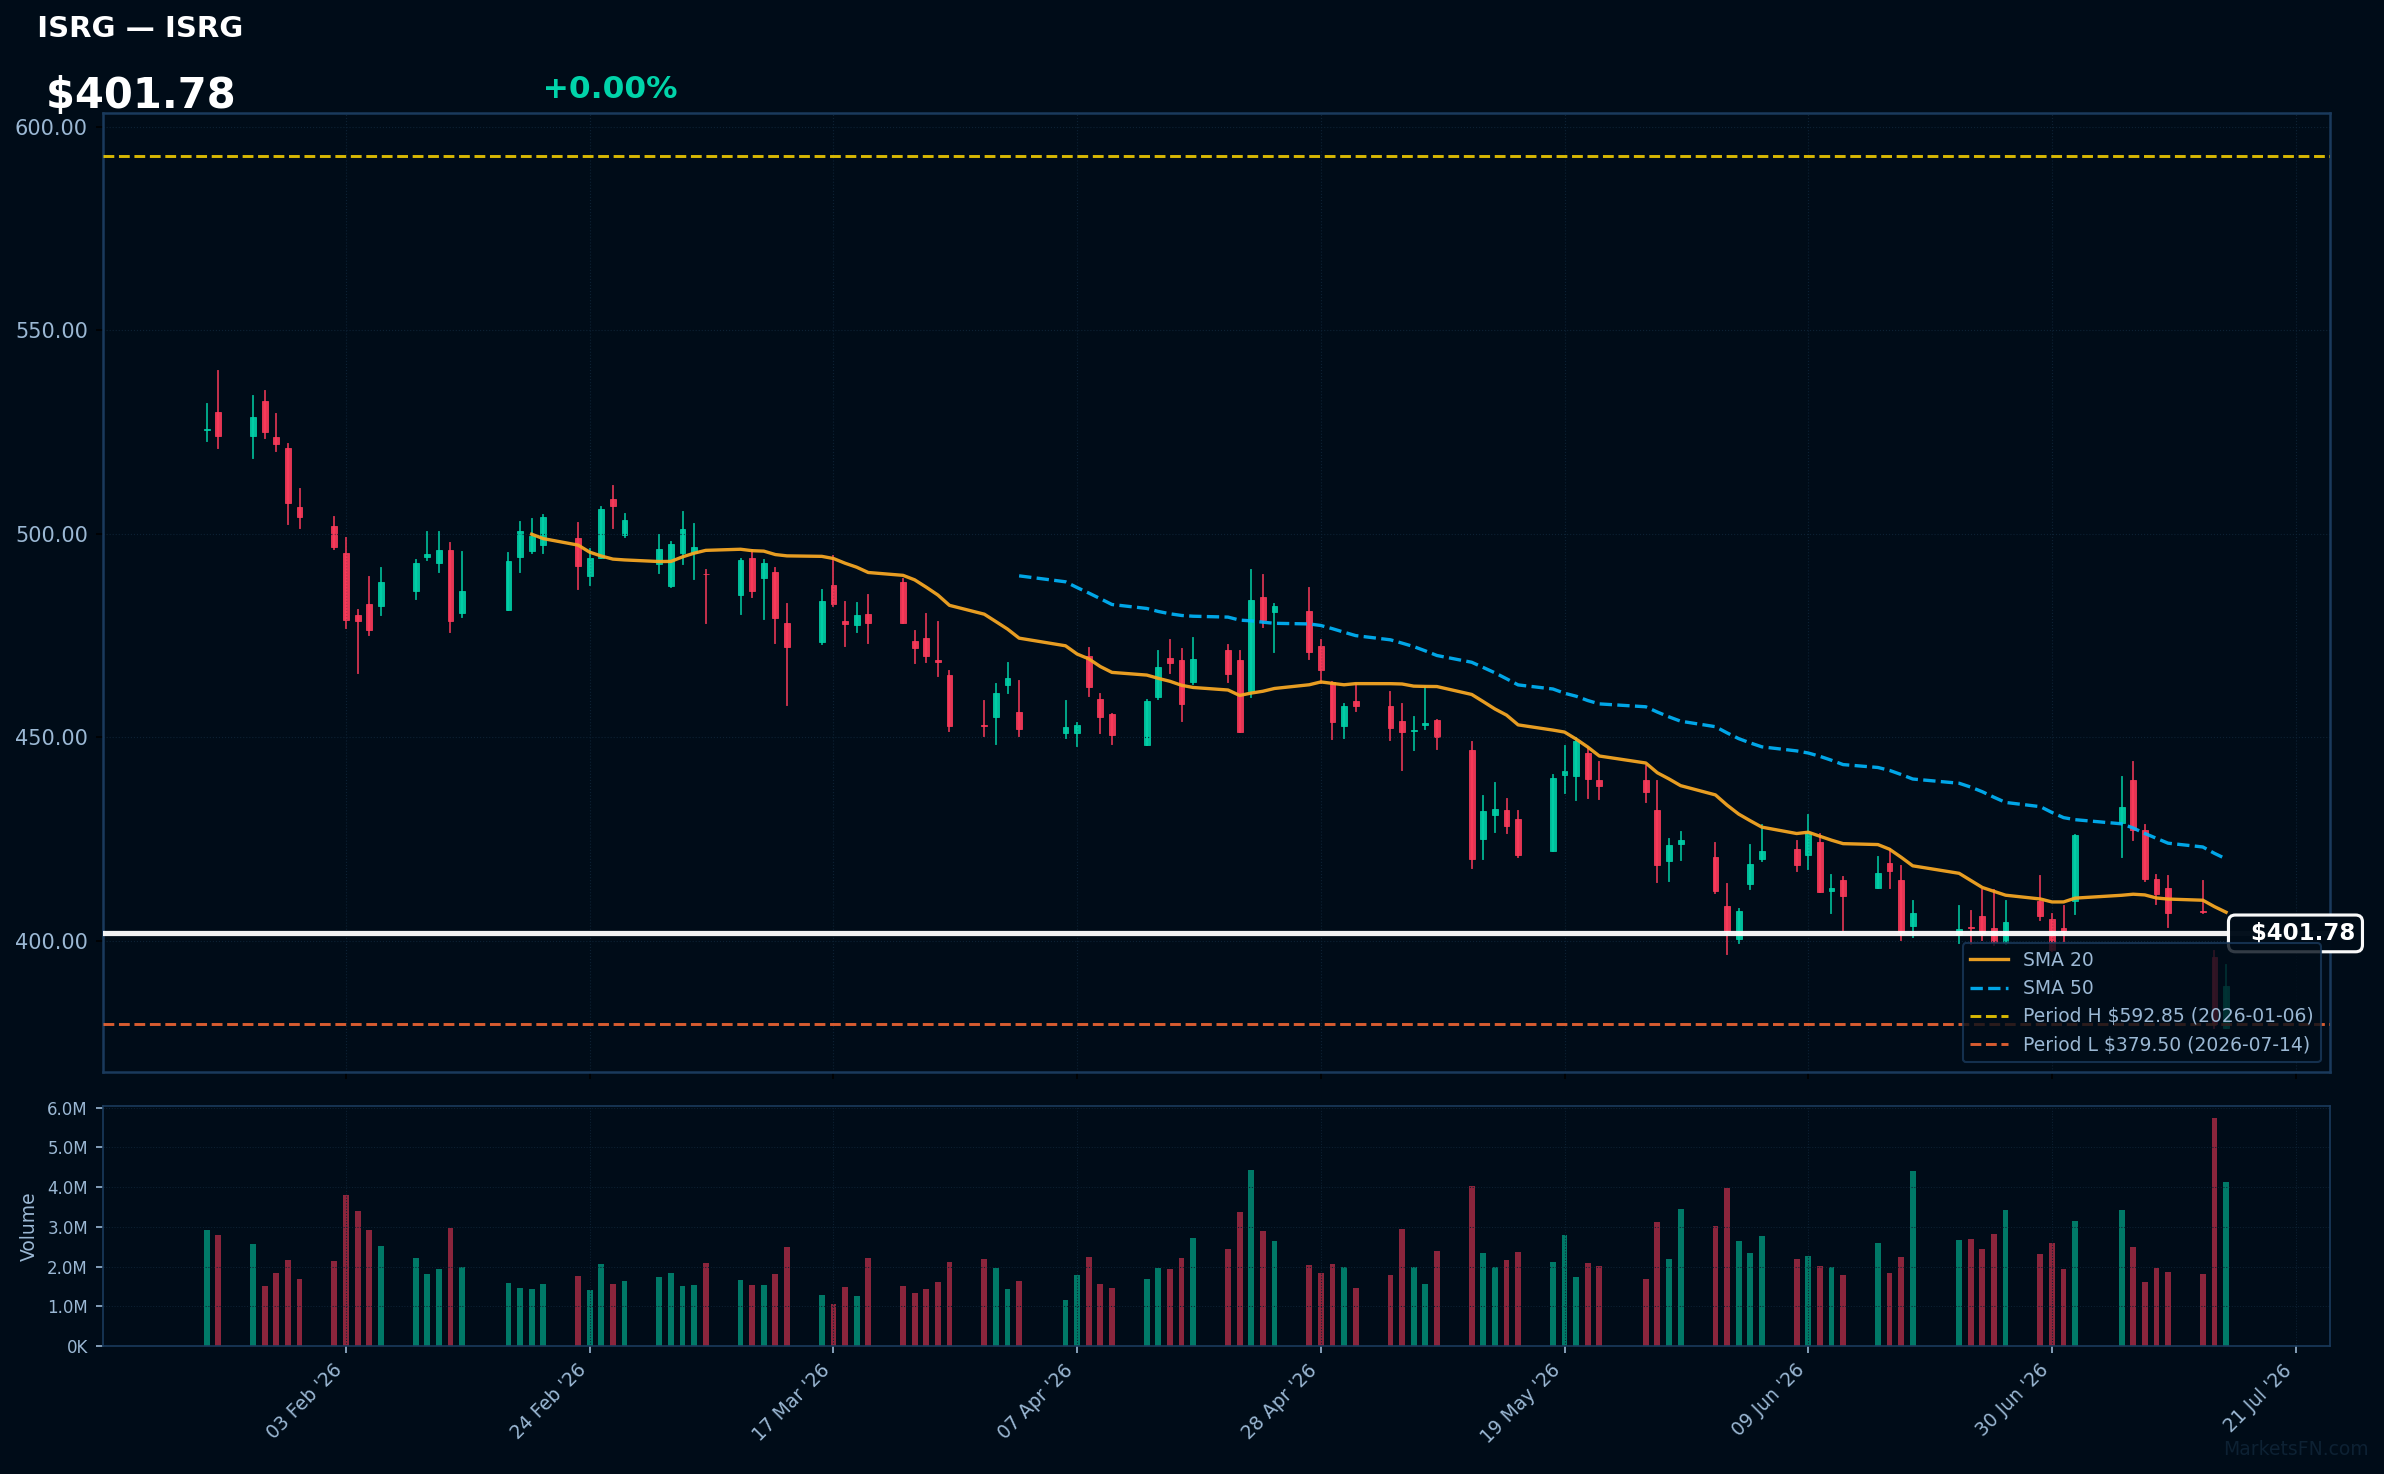
ISRG | Intuitive Surgical Inc | Healthcare | Price Last: $388.97 | % Realized: -30.79% | RSI: 46.0 | % above MA200: -20.1% | Trend: Below MA20, MA50, MA200
Intuitive Surgical Inc develops and manufactures robotic-assisted surgical systems, enabling minimally invasive procedures. Investors should care because the company's technology is widely adopted in urology, gynecology, and other specialties, driving growth and disruption in the healthcare industry.
ISRG's technical situation is bearish, with RSI(14) at 46.0, indicating neutral momentum. The stock is in a sustained downtrend (price < MA20 < MA50 < MA200) and testing major support, only 2.5% above its 2026 YTD low, with a -30.8% YTD return, signaling a warning sign.
Related headlines
Market Commentary
The Nasdaq 100 stocks listed are near their 2026 year-to-date (YTD) extremes, with some at their highs and others at their lows. Stocks like AAPL, EA, and KHC are at their 2026 YTD highs, indicating strong performance, while PEP, ORLY, and CPRT are at their YTD lows, suggesting weaker performance.
The technology sector themes driving these moves include the performance of individual companies and broader macro conditions. The fact that stocks like ABNB and MNST are near their highs, with only a -0.4% deviation, suggests that consumer discretionary and tech-enabled services are performing well. Conversely, stocks like PEP and ORLY at their YTD lows may indicate challenges in consumer staples and automotive retail.
Investors and traders should watch the next moves in these stocks, particularly how they react to upcoming earnings reports and macroeconomic data releases. Monitoring the percentage changes from their YTD extremes, such as AZN's +2.4% and ISRG's +2.5% above their lows, will be crucial in understanding the direction of the market and making informed investment decisions.
Methodology: All 101 Nasdaq 100 constituents screened. Close prices downloaded from 2026-01-01. Period high = highest close since Jan 1 2026; period low = lowest close since Jan 1 2026. Distance = (current price / period extreme − 1) × 100. Technical indicators computed on up to 1 year of daily OHLCV data.
Disclaimer: For informational purposes only. Not investment advice. Past performance is not indicative of future results.

