Nasdaq 100 Bull & Bear Radar — June 17, 2026
· Stocks · QuoteReporter
Nasdaq 100 Bull & Bear Radar — June 17, 2026
A daily technical sweep of 101 Nasdaq 100 constituents ranked by session performance, enriched with RSI, MA20/MA50/MA200 trend signals, Bloomberg-style charts, and recent news.
Index-Wide Breadth
| Constituents tracked | 101 |
| Advancing | 17 (16.8%) |
| Declining | 83 (82.2%) |
| Average daily change | 1.77% |
| Above MA200 | 12 (11.9%) |
Top 10 Gainers
Today's strongest Nasdaq 100 performers. Sector leadership: Technology (9), Healthcare (1).
| Ticker | Company | Sector | Price | Day % | 1W % | 1M % | RSI | vs MA200 | Trend |
|---|---|---|---|---|---|---|---|---|---|
| ARM | Arm Holdings plc. ADR | Technology | $418.88 | +5.69% | +36.25% | +94.72% | 66.7 | +151.9% | Above MA20, MA50, MA200 |
| AMAT | Applied Materials Inc | Technology | $592.92 | +4.35% | +19.30% | +43.37% | 73.4 | +87.9% | Above MA20, MA50, MA200 |
| AVGO | Broadcom Inc | Technology | $392.90 | +4.30% | +5.59% | -6.61% | 46.1 | +9.3% | Above MA200 · Below MA20, MA50 |
| MRVL | Marvell Technology Inc | Technology | $289.54 | +3.90% | +14.63% | +71.40% | 61.2 | +158.9% | Above MA20, MA50, MA200 |
| ASML | ASML Holding NV | Technology | $1867.83 | +3.54% | +7.71% | +26.86% | 62.7 | +48.1% | Above MA20, MA50, MA200 |
| INTC | Intel Corp | Technology | $121.10 | +3.46% | +13.14% | +11.95% | 57.3 | +120.3% | Above MA20, MA50, MA200 |
| SNPS | Synopsys, Inc | Technology | $461.74 | +2.98% | +0.26% | -7.36% | 43.7 | +0.3% | Above MA200 · Below MA20, MA50 |
| MU | Micron Technology Inc | Technology | $1043.19 | +2.20% | +16.97% | +53.06% | 61.7 | +163.7% | Above MA20, MA50, MA200 |
| BIIB | Biogen Inc | Healthcare | $198.67 | +1.56% | +2.28% | +3.52% | 55.2 | +13.9% | Above MA20, MA50, MA200 |
| LRCX | Lam Research Corp | Technology | $374.18 | +1.31% | +16.28% | +34.62% | 65.6 | +79.4% | Above MA20, MA50, MA200 |
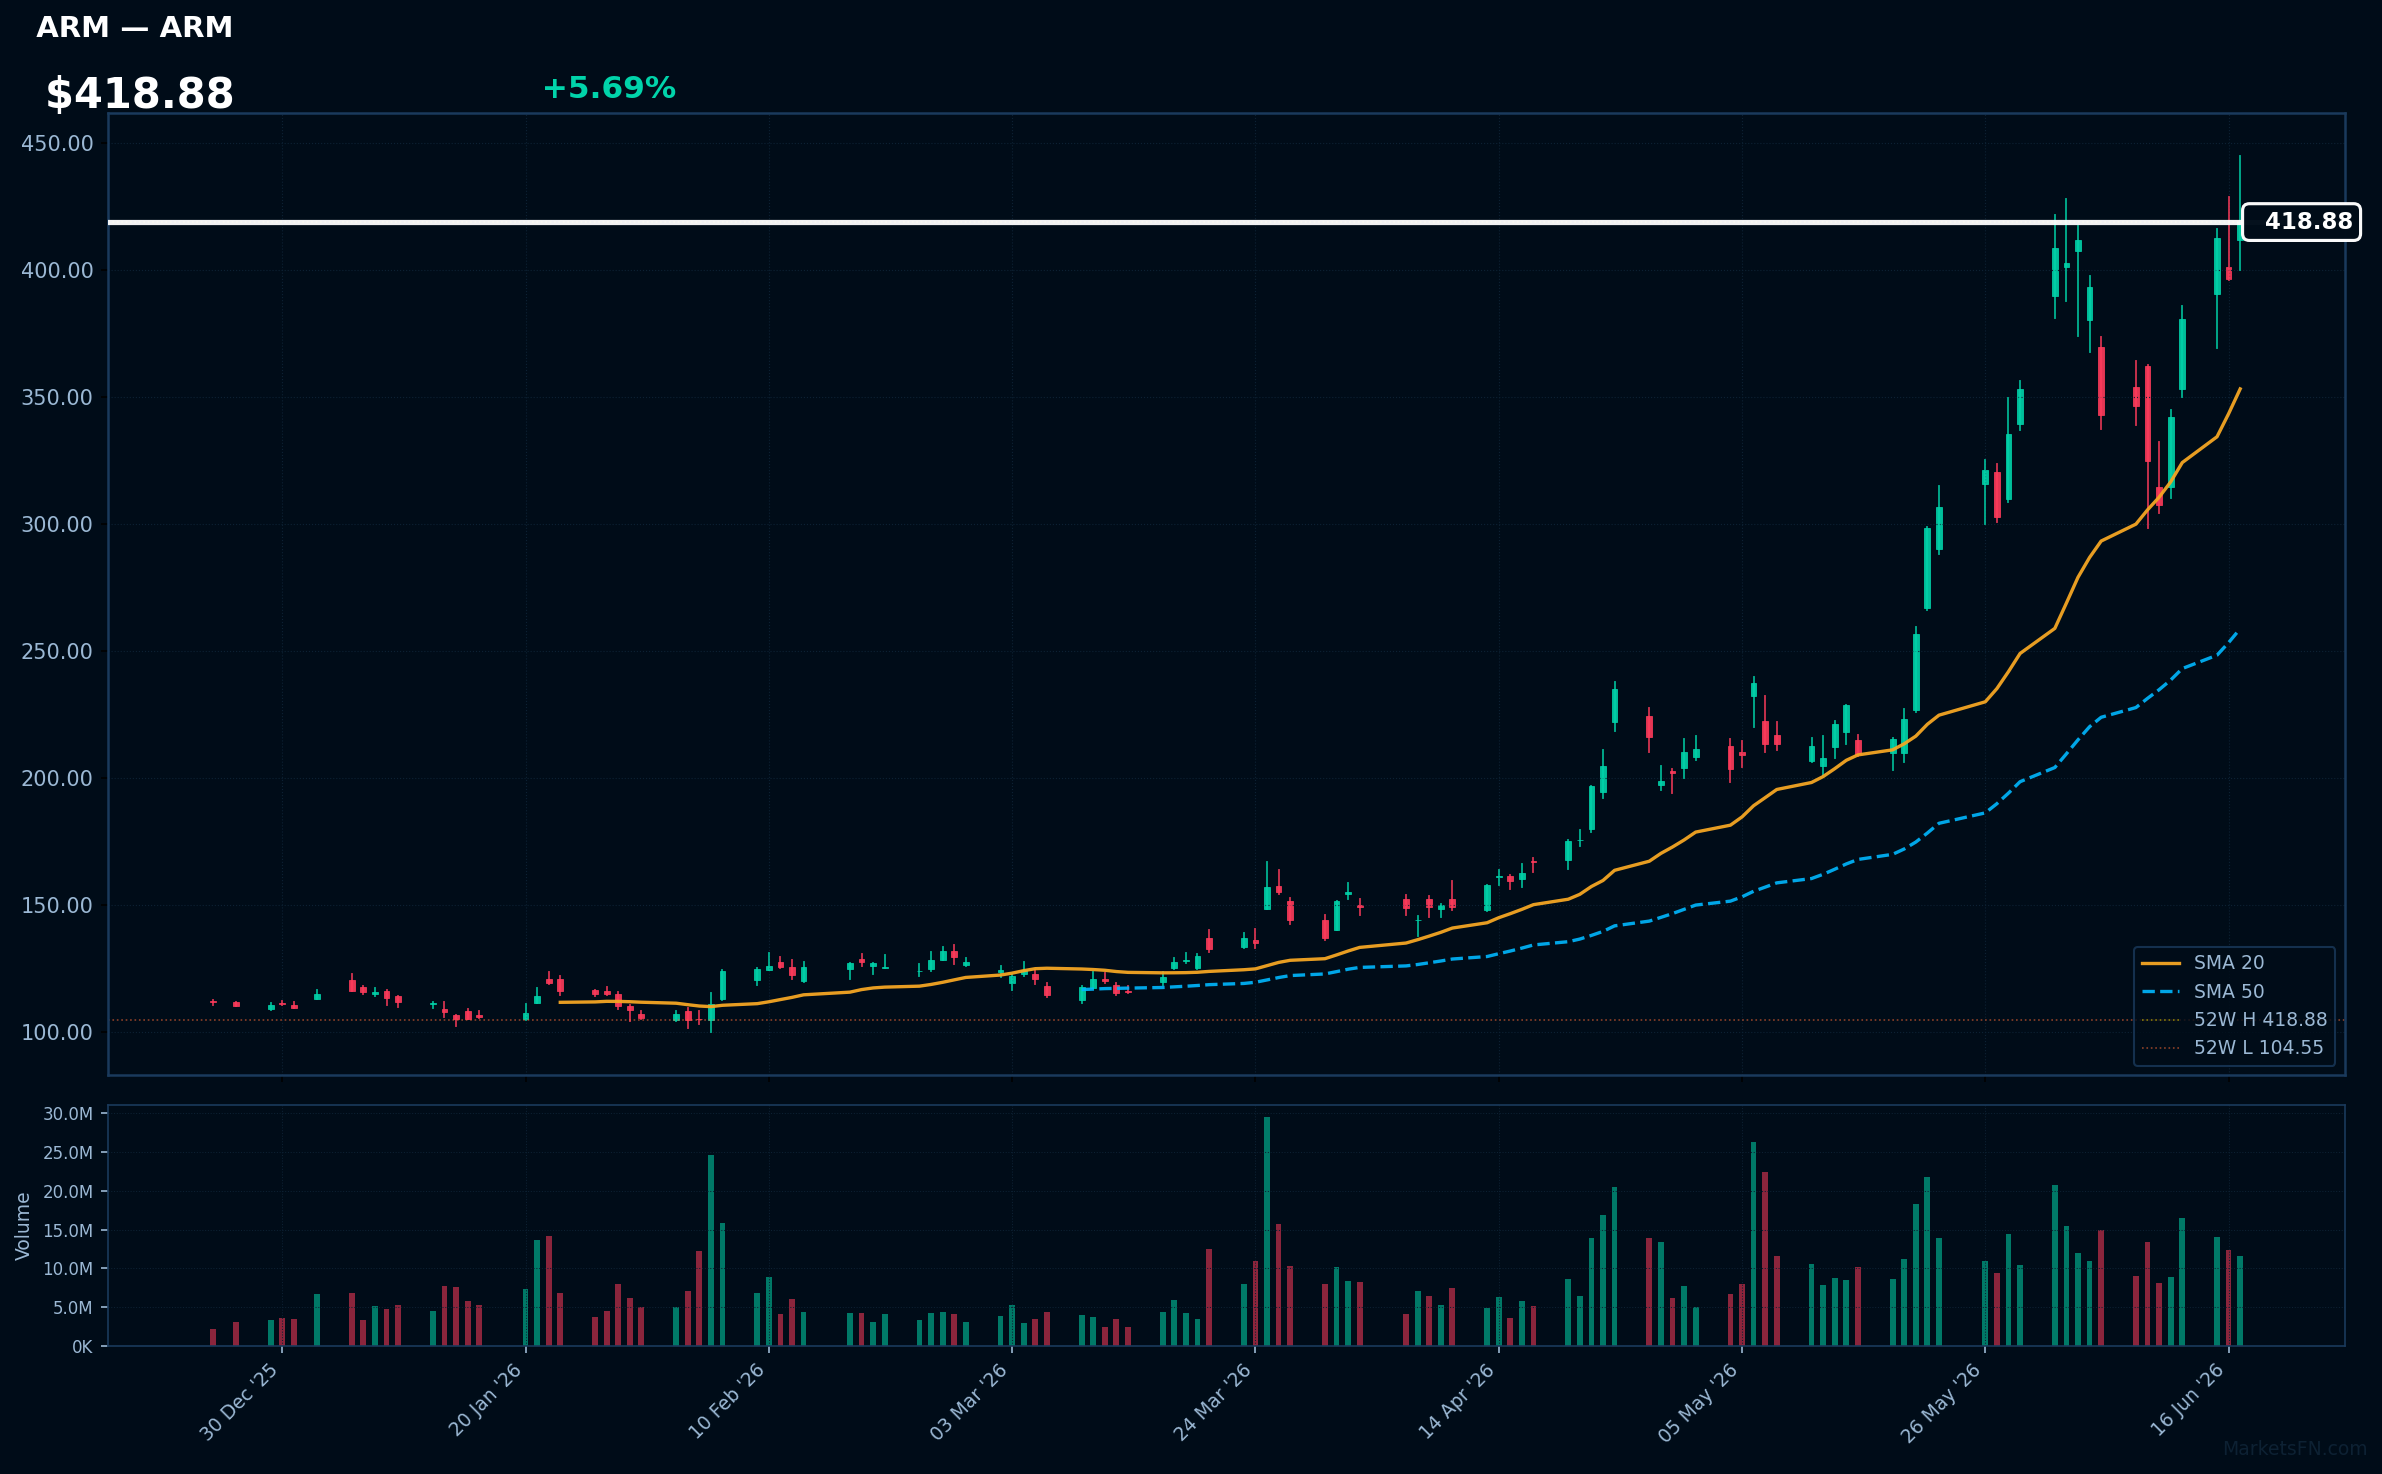
ARM | Arm Holdings plc. ADR | Technology | Price: $418.88 | Day: +5.69% | 1W: +36.25% | 1M: +94.72% | RSI: 66.7 | vs MA200: +151.9% | Trend: Above MA20, MA50, MA200
Recent headlines (last 12h)
- INTC, ARM, AMD Stocks Gain Today Bernstein Supercharges AI Chip Bull Case
- Energy Is A Trillion-Dollar Problem for the AI Boom
- Bernstein flags structural beneficiaries of the CPU renaissance
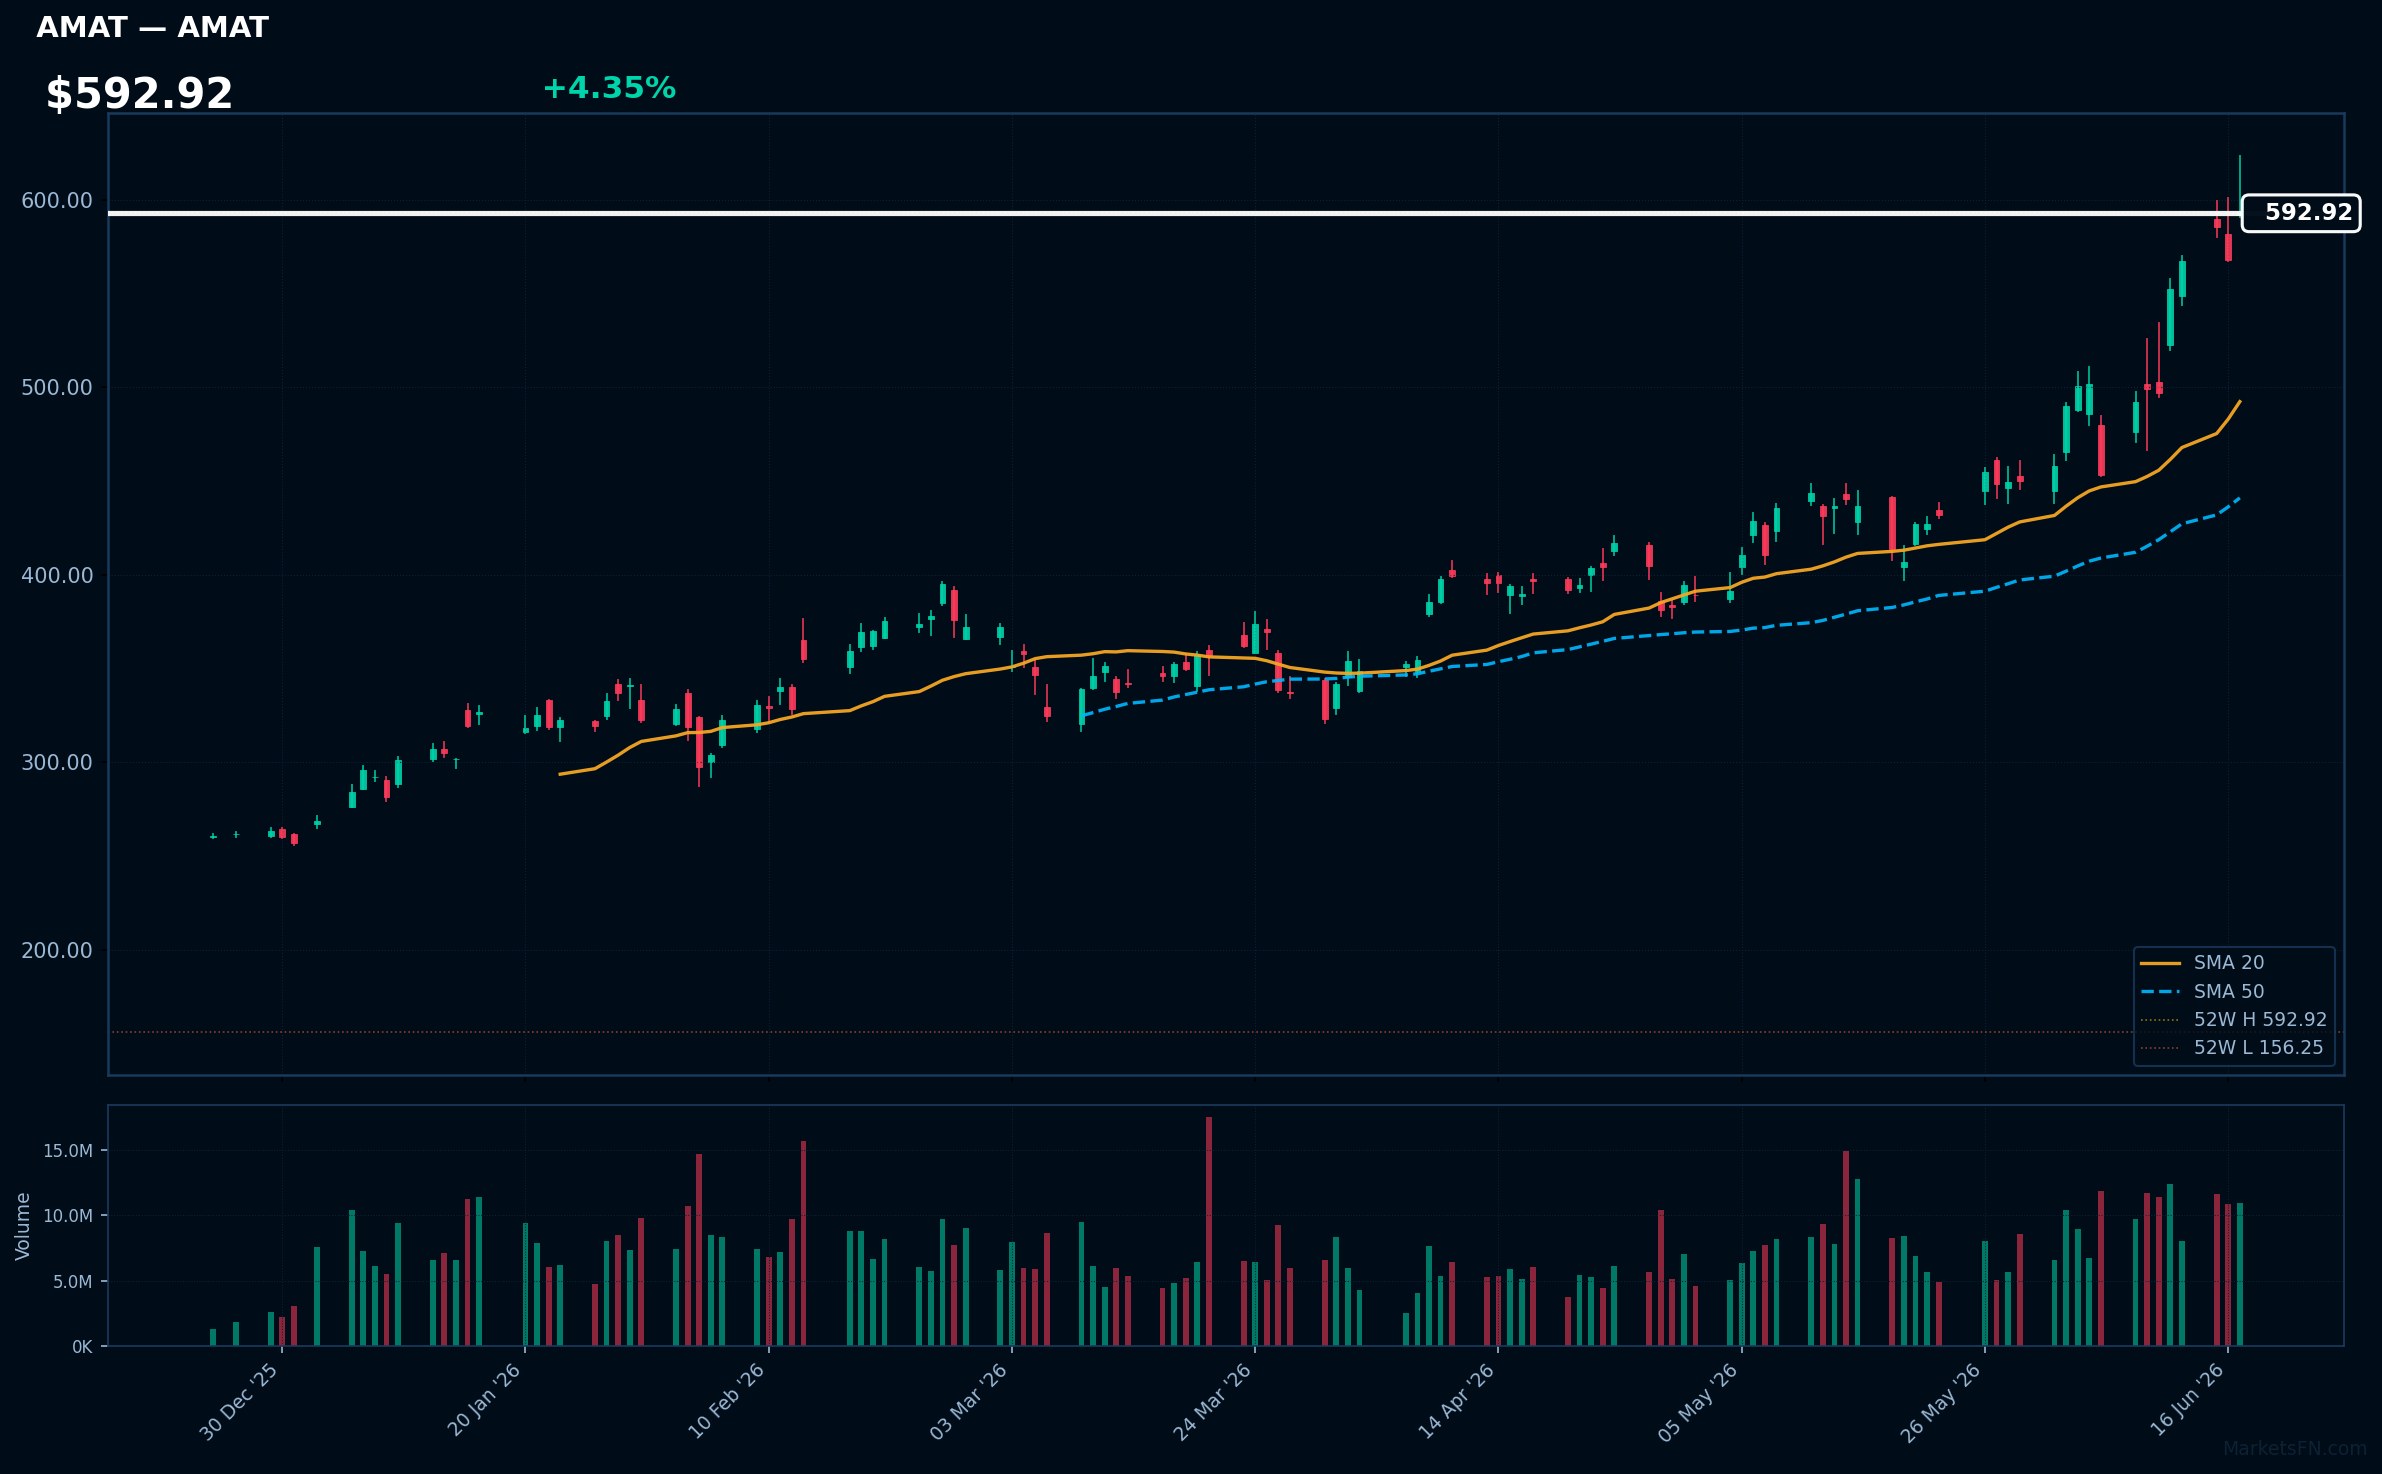
AMAT | Applied Materials Inc | Technology | Price: $592.92 | Day: +4.35% | 1W: +19.30% | 1M: +43.37% | RSI: 73.4 | vs MA200: +87.9% | Trend: Above MA20, MA50, MA200
Recent headlines (last 12h)
- Applied Materials, ASML, Lam Hit Record Highs, Lead Chip Gear Stocks Rally
- Applied Materials shares jump on launch of integrated AR smart glasses system
- Applied Materials Stock Is One Of the S&P 500 Leaders Today. It's AI.
- Applied Materials Unveils SENZ, a Fully Integrated Visual System for Next-Gen Smart Glasses
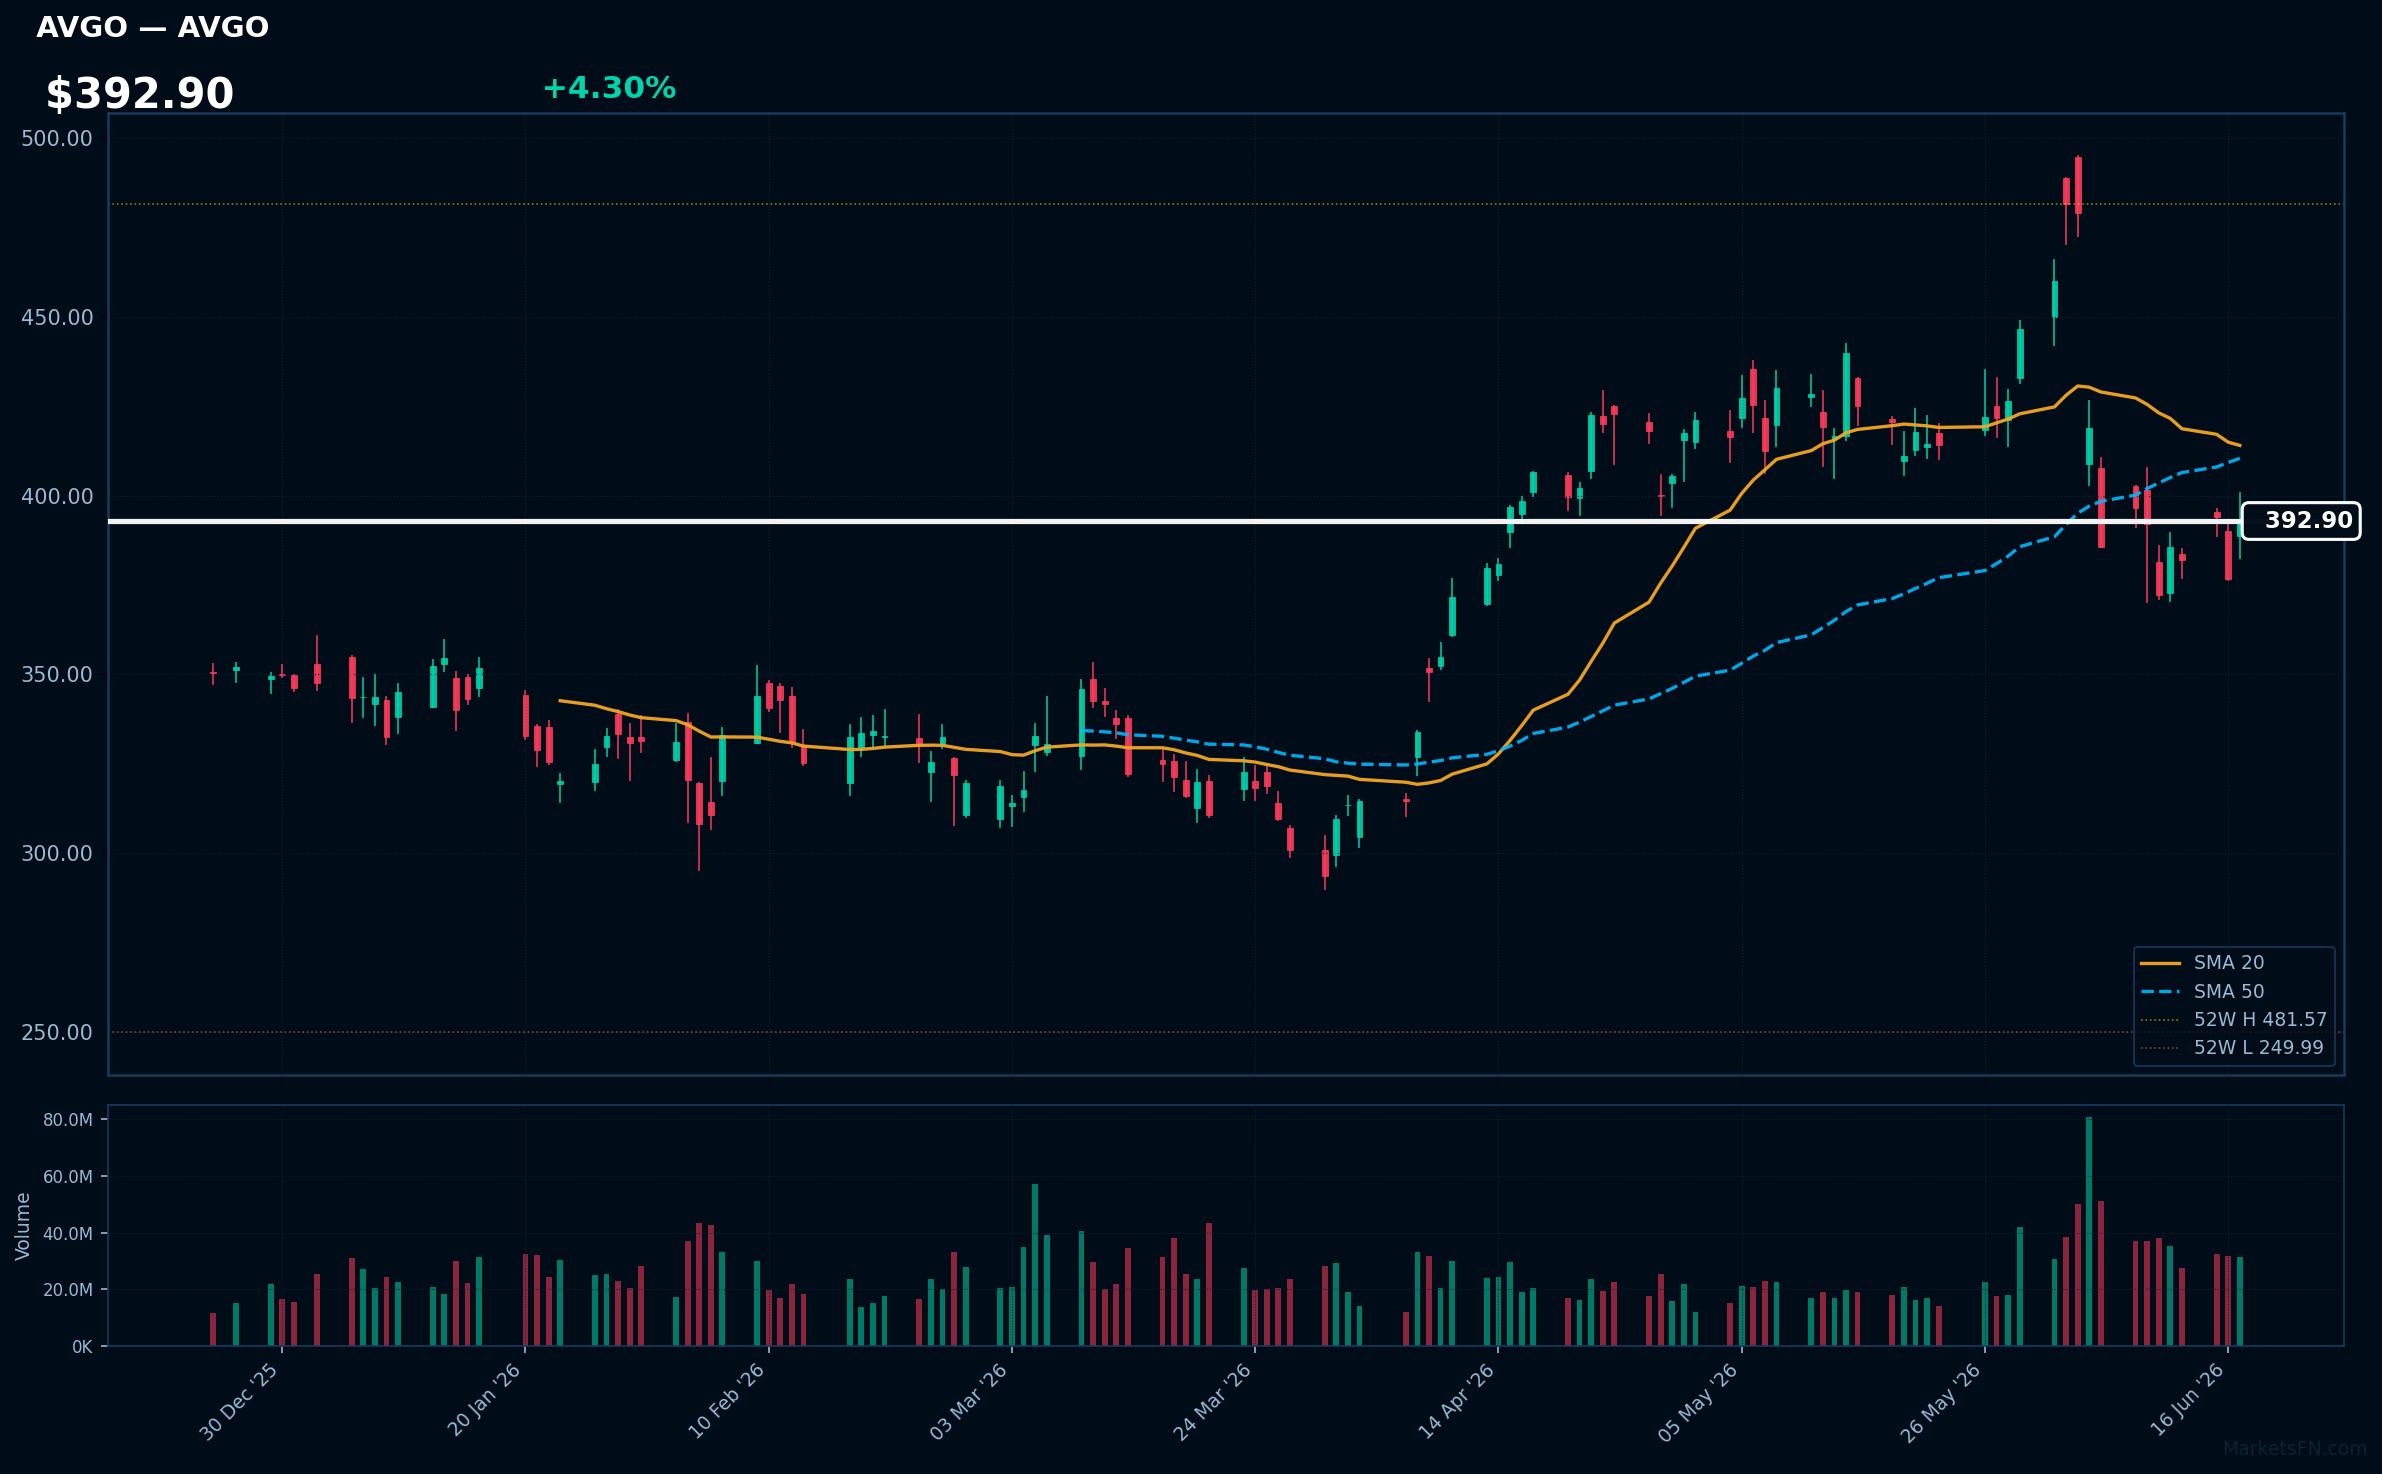
AVGO | Broadcom Inc | Technology | Price: $392.90 | Day: +4.30% | 1W: +5.59% | 1M: -6.61% | RSI: 46.1 | vs MA200: +9.3% | Trend: Above MA200 · Below MA20, MA50
Recent headlines (last 12h)
- What A Patient Holder Is Really Paying For Broadcom Stock
- Nasdaq, US stocks slide as Fed forecasts possible rate hike
- Texas Instruments Stock And The Industrial Recovery Hiding In Plain Sight
- Broadcom Stock Pops After JPMorgan Calls For Aggressive Buying
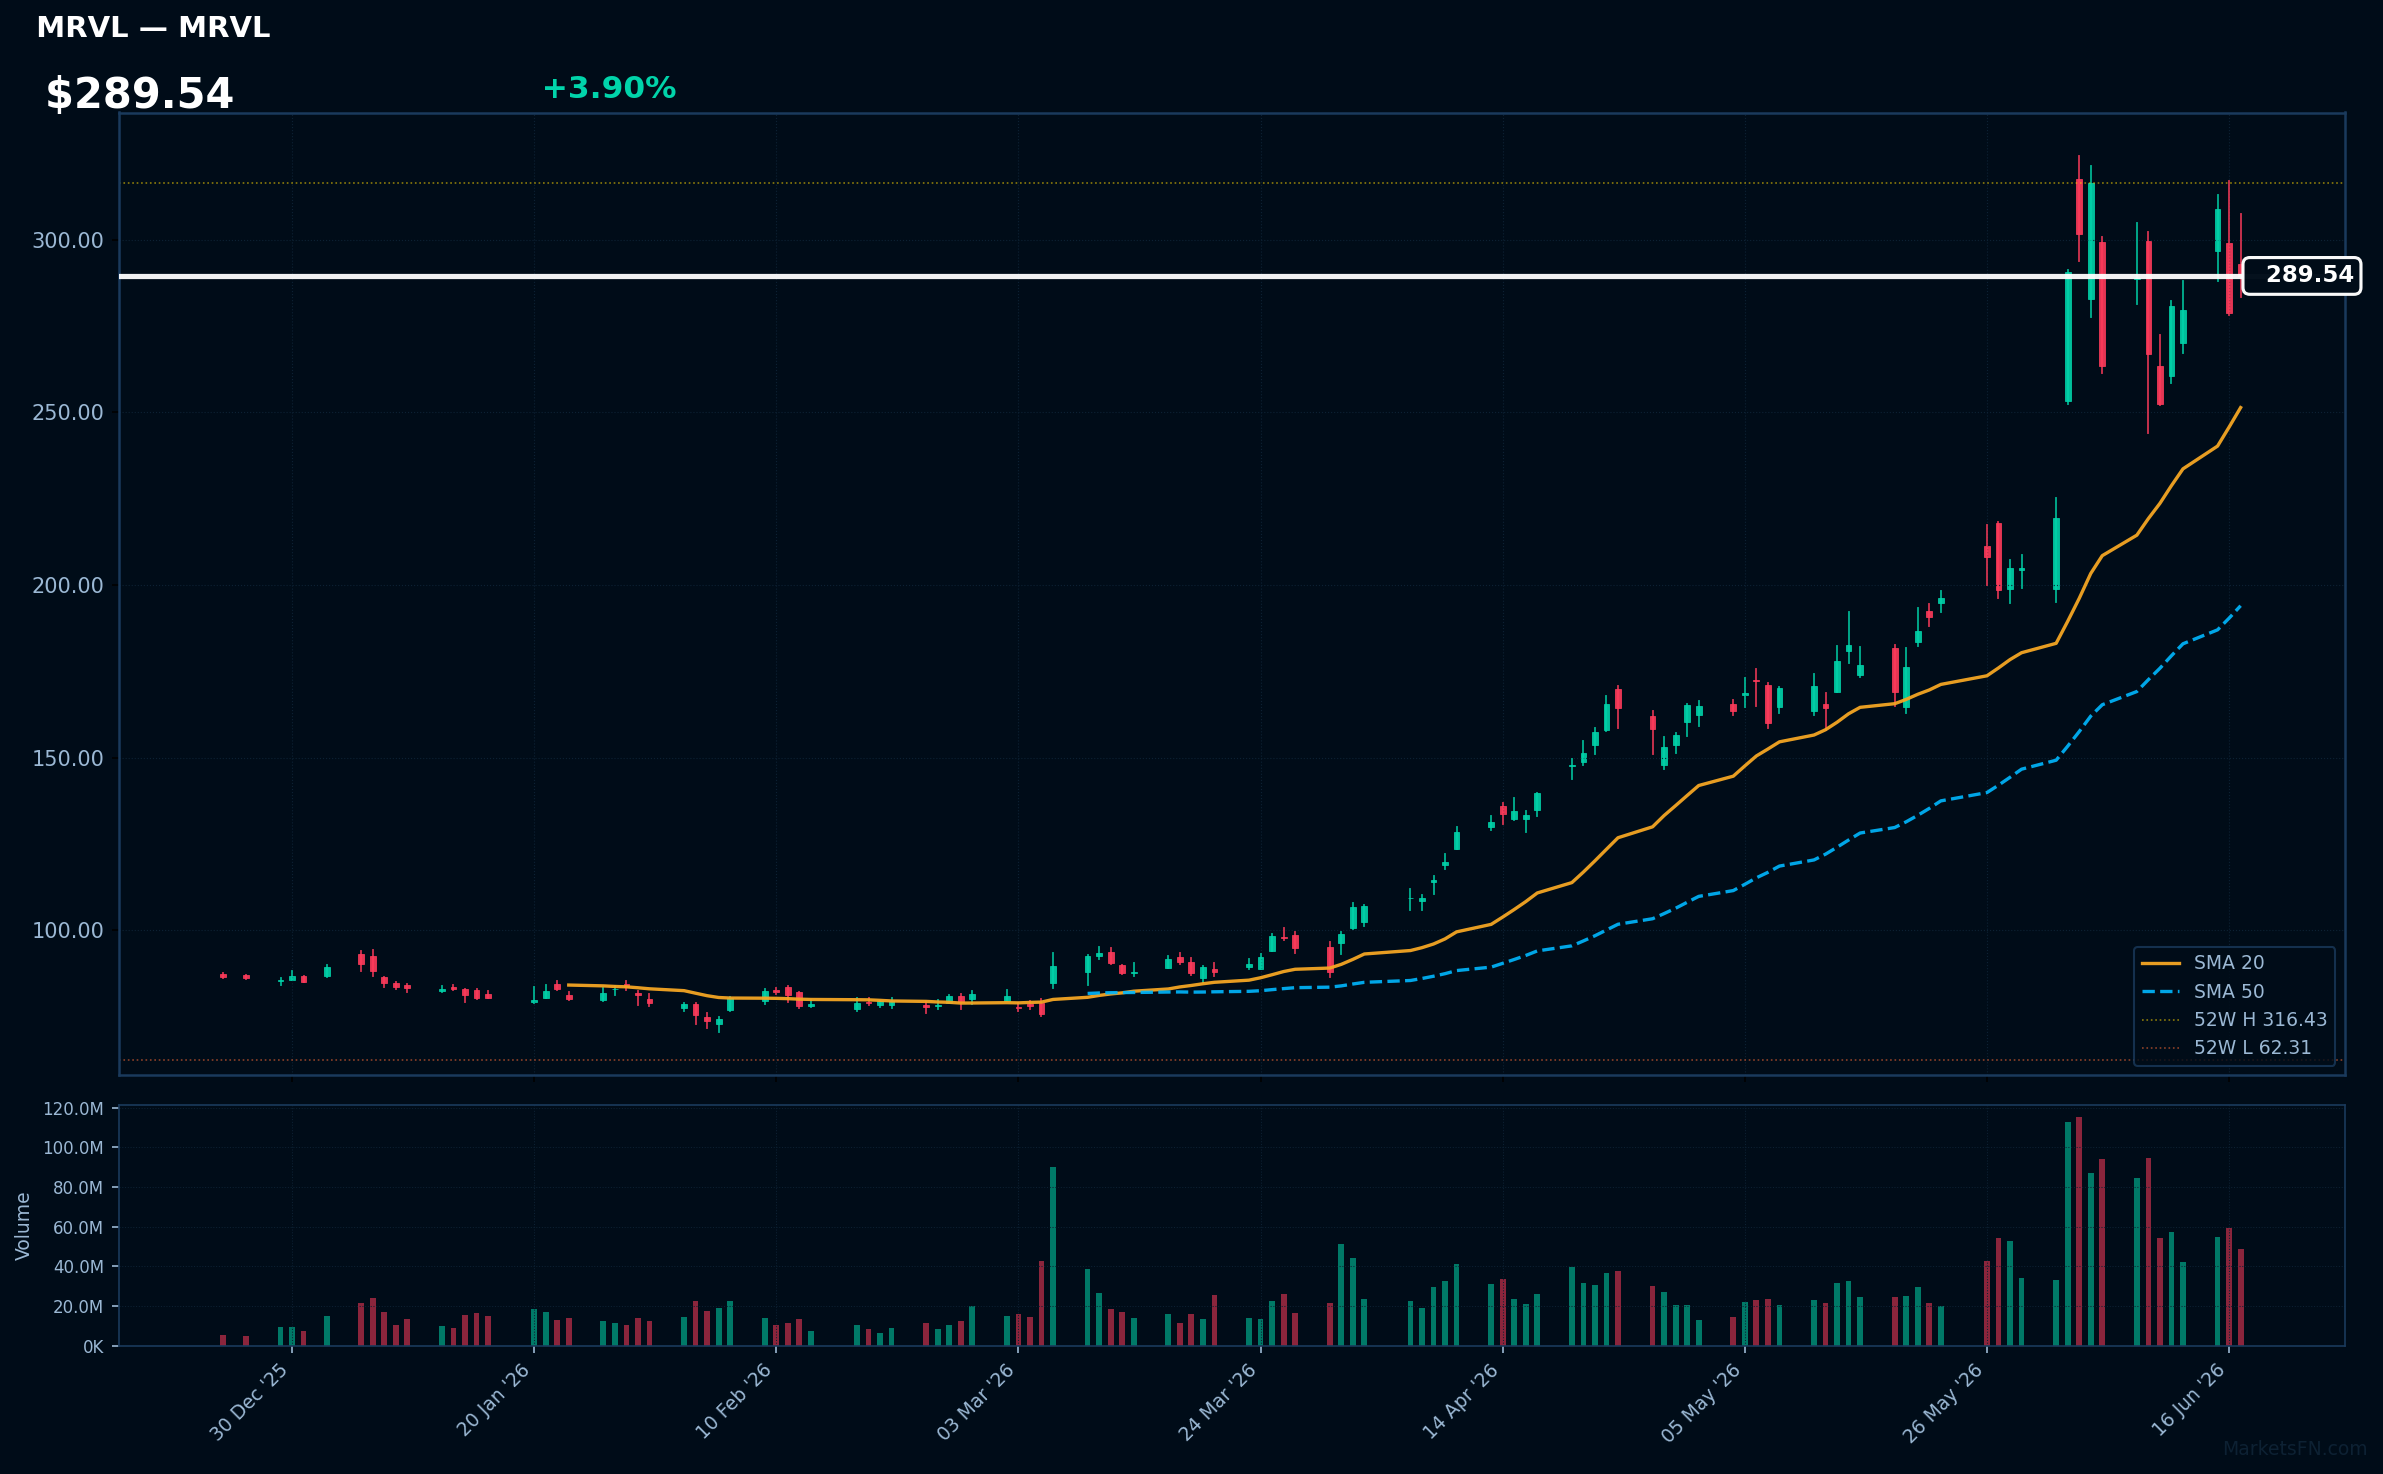
MRVL | Marvell Technology Inc | Technology | Price: $289.54 | Day: +3.90% | 1W: +14.63% | 1M: +71.40% | RSI: 61.2 | vs MA200: +158.9% | Trend: Above MA20, MA50, MA200
Recent headlines (last 12h)
- Marvell Gains Attention After Nvidia Backing
- The Real Engine for Advanced Micro Devices Stock Might Not Be What You Think
- Semiconductor Stocks Climb in Premarket Trade Following Intel Manufacturing Milestone
- Chip stocks rebound premarket as Intel manufacturing update lifts sector
ASML | ASML Holding NV | Technology | Price: $1867.83 | Day: +3.54% | 1W: +7.71% | 1M: +26.86% | RSI: 62.7 | vs MA200: +48.1% | Trend: Above MA20, MA50, MA200
Recent headlines (last 12h)
- ASML CEO Flags Terafab Opportunity as AI Demand Stays Enormous
- Energy Is A Trillion-Dollar Problem for the AI Boom
- ASML hits 52-week high as Intel 18A-P enters risk production
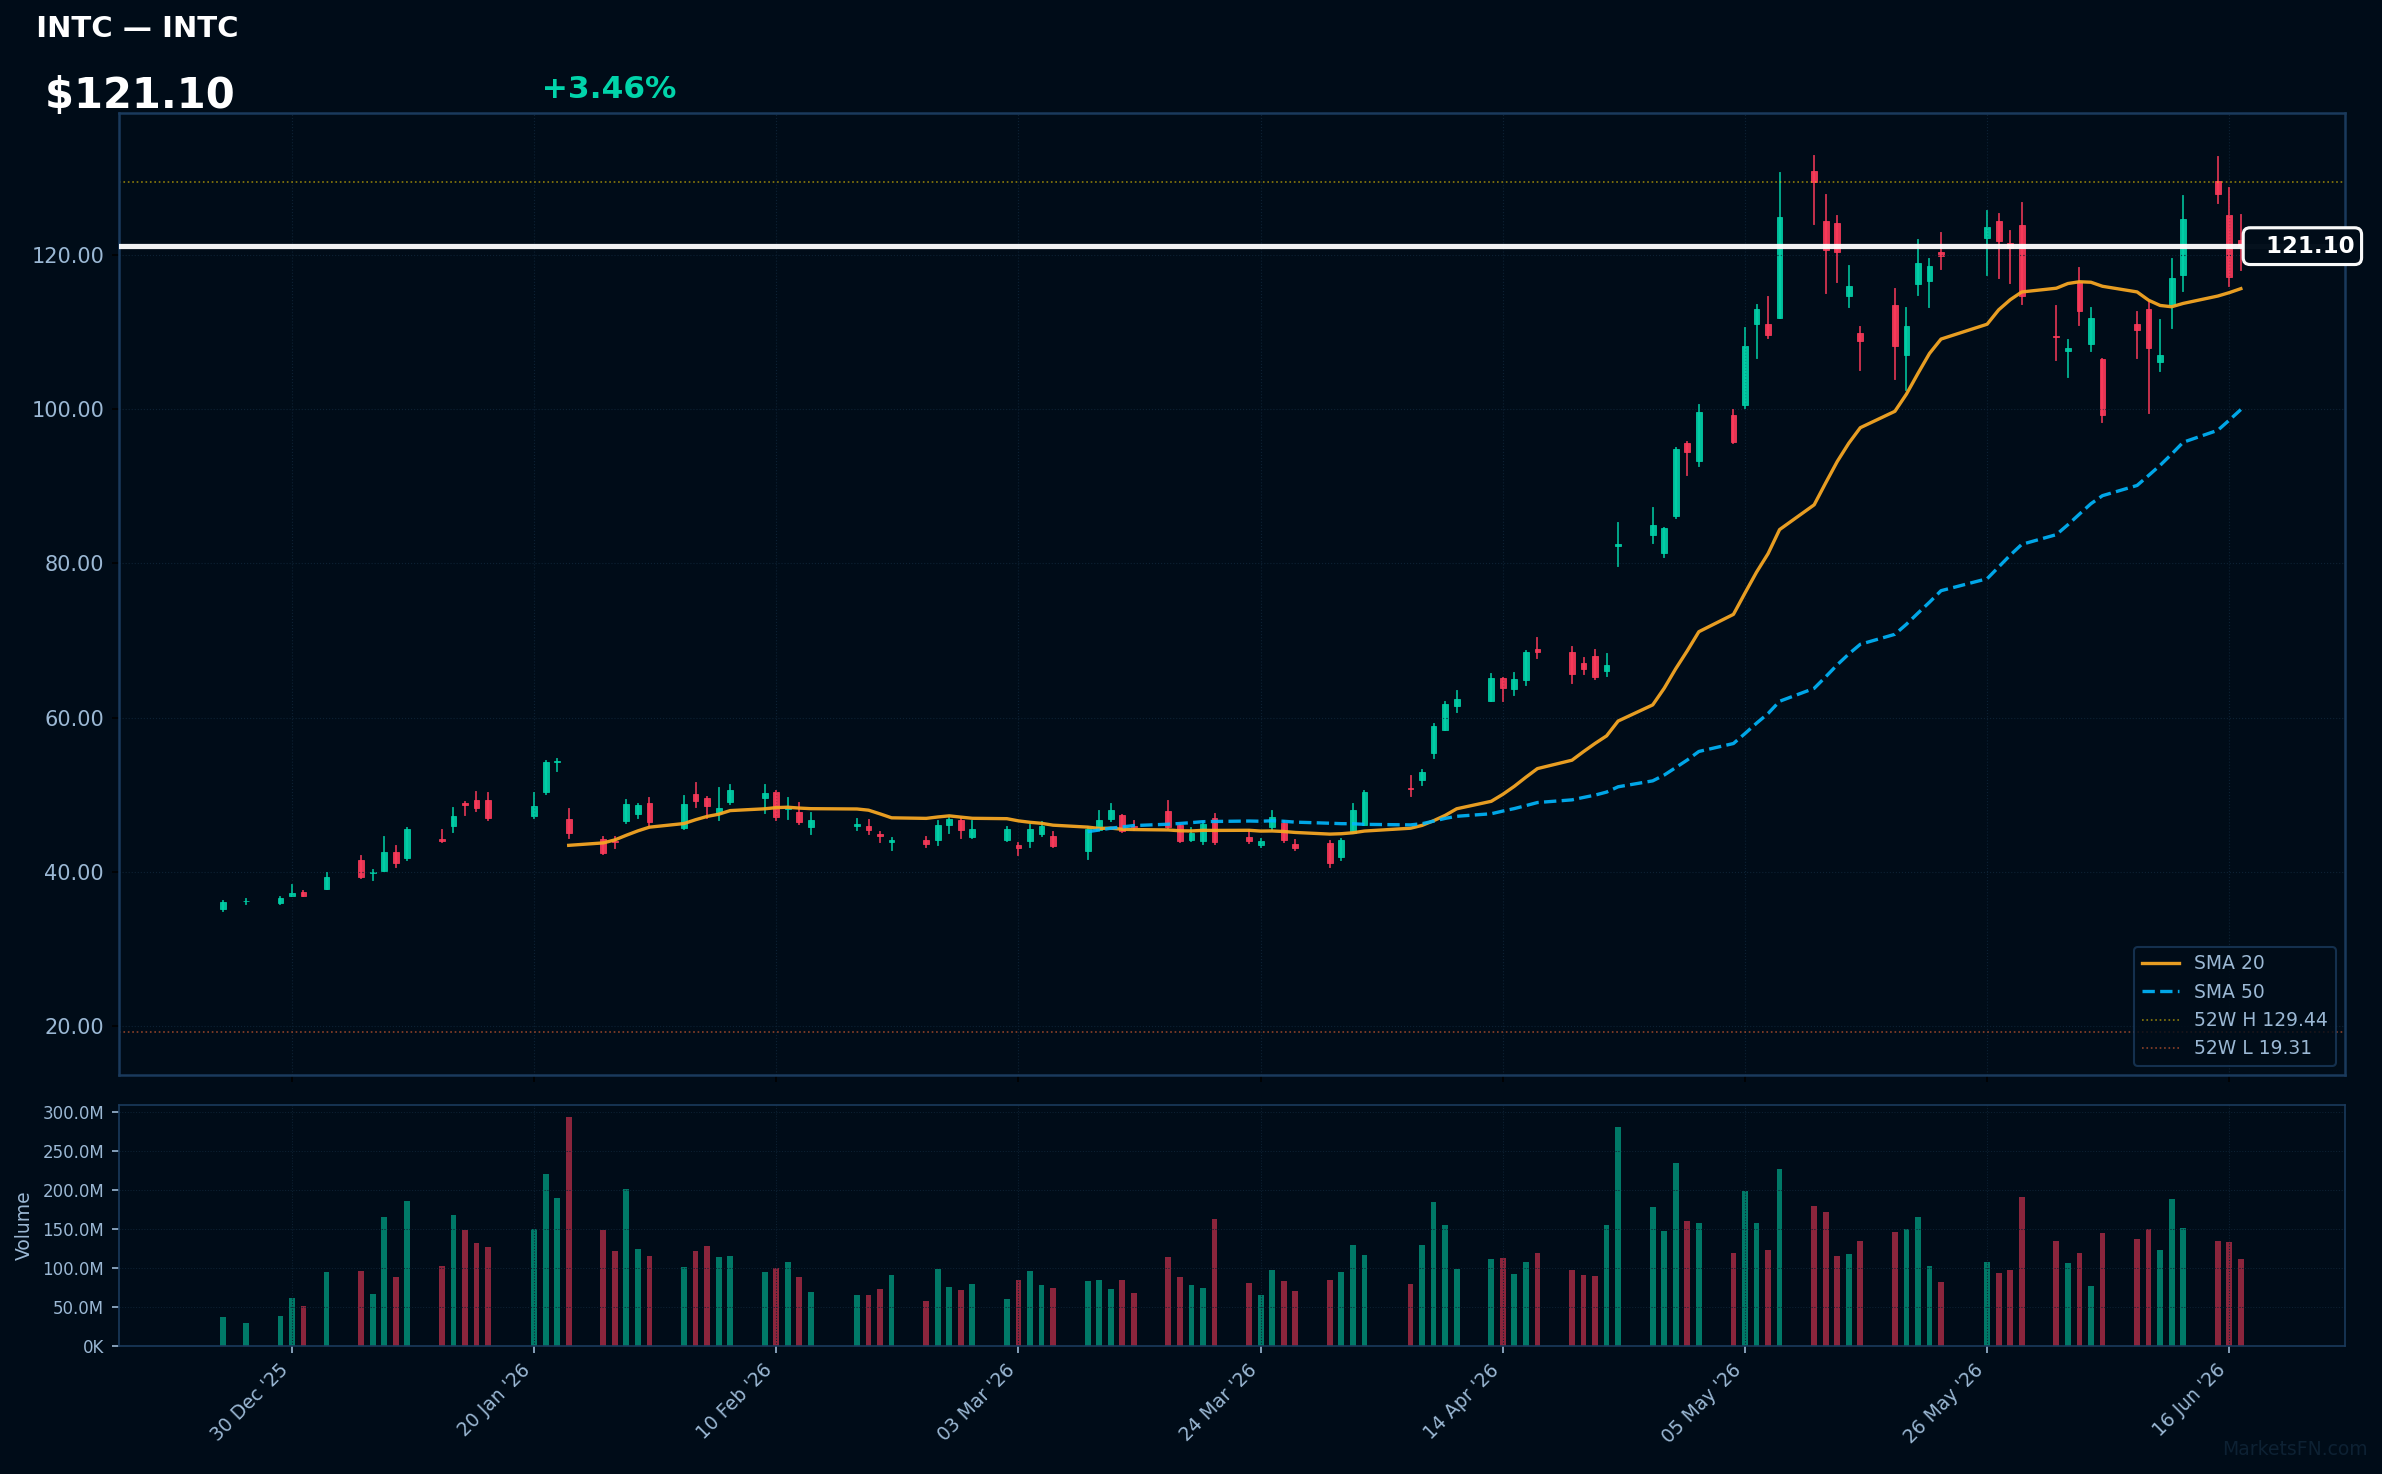
INTC | Intel Corp | Technology | Price: $121.10 | Day: +3.46% | 1W: +13.14% | 1M: +11.95% | RSI: 57.3 | vs MA200: +120.3% | Trend: Above MA20, MA50, MA200
Recent headlines (last 12h)
- Nasdaq, US stocks slide as Fed forecasts possible rate hike
- Intel's 18A-P Process Moves Forward
- INTC, ARM, AMD Stocks Gain Today Bernstein Supercharges AI Chip Bull Case
- AMD, Intel Rise as TSMC Capacity Tightens
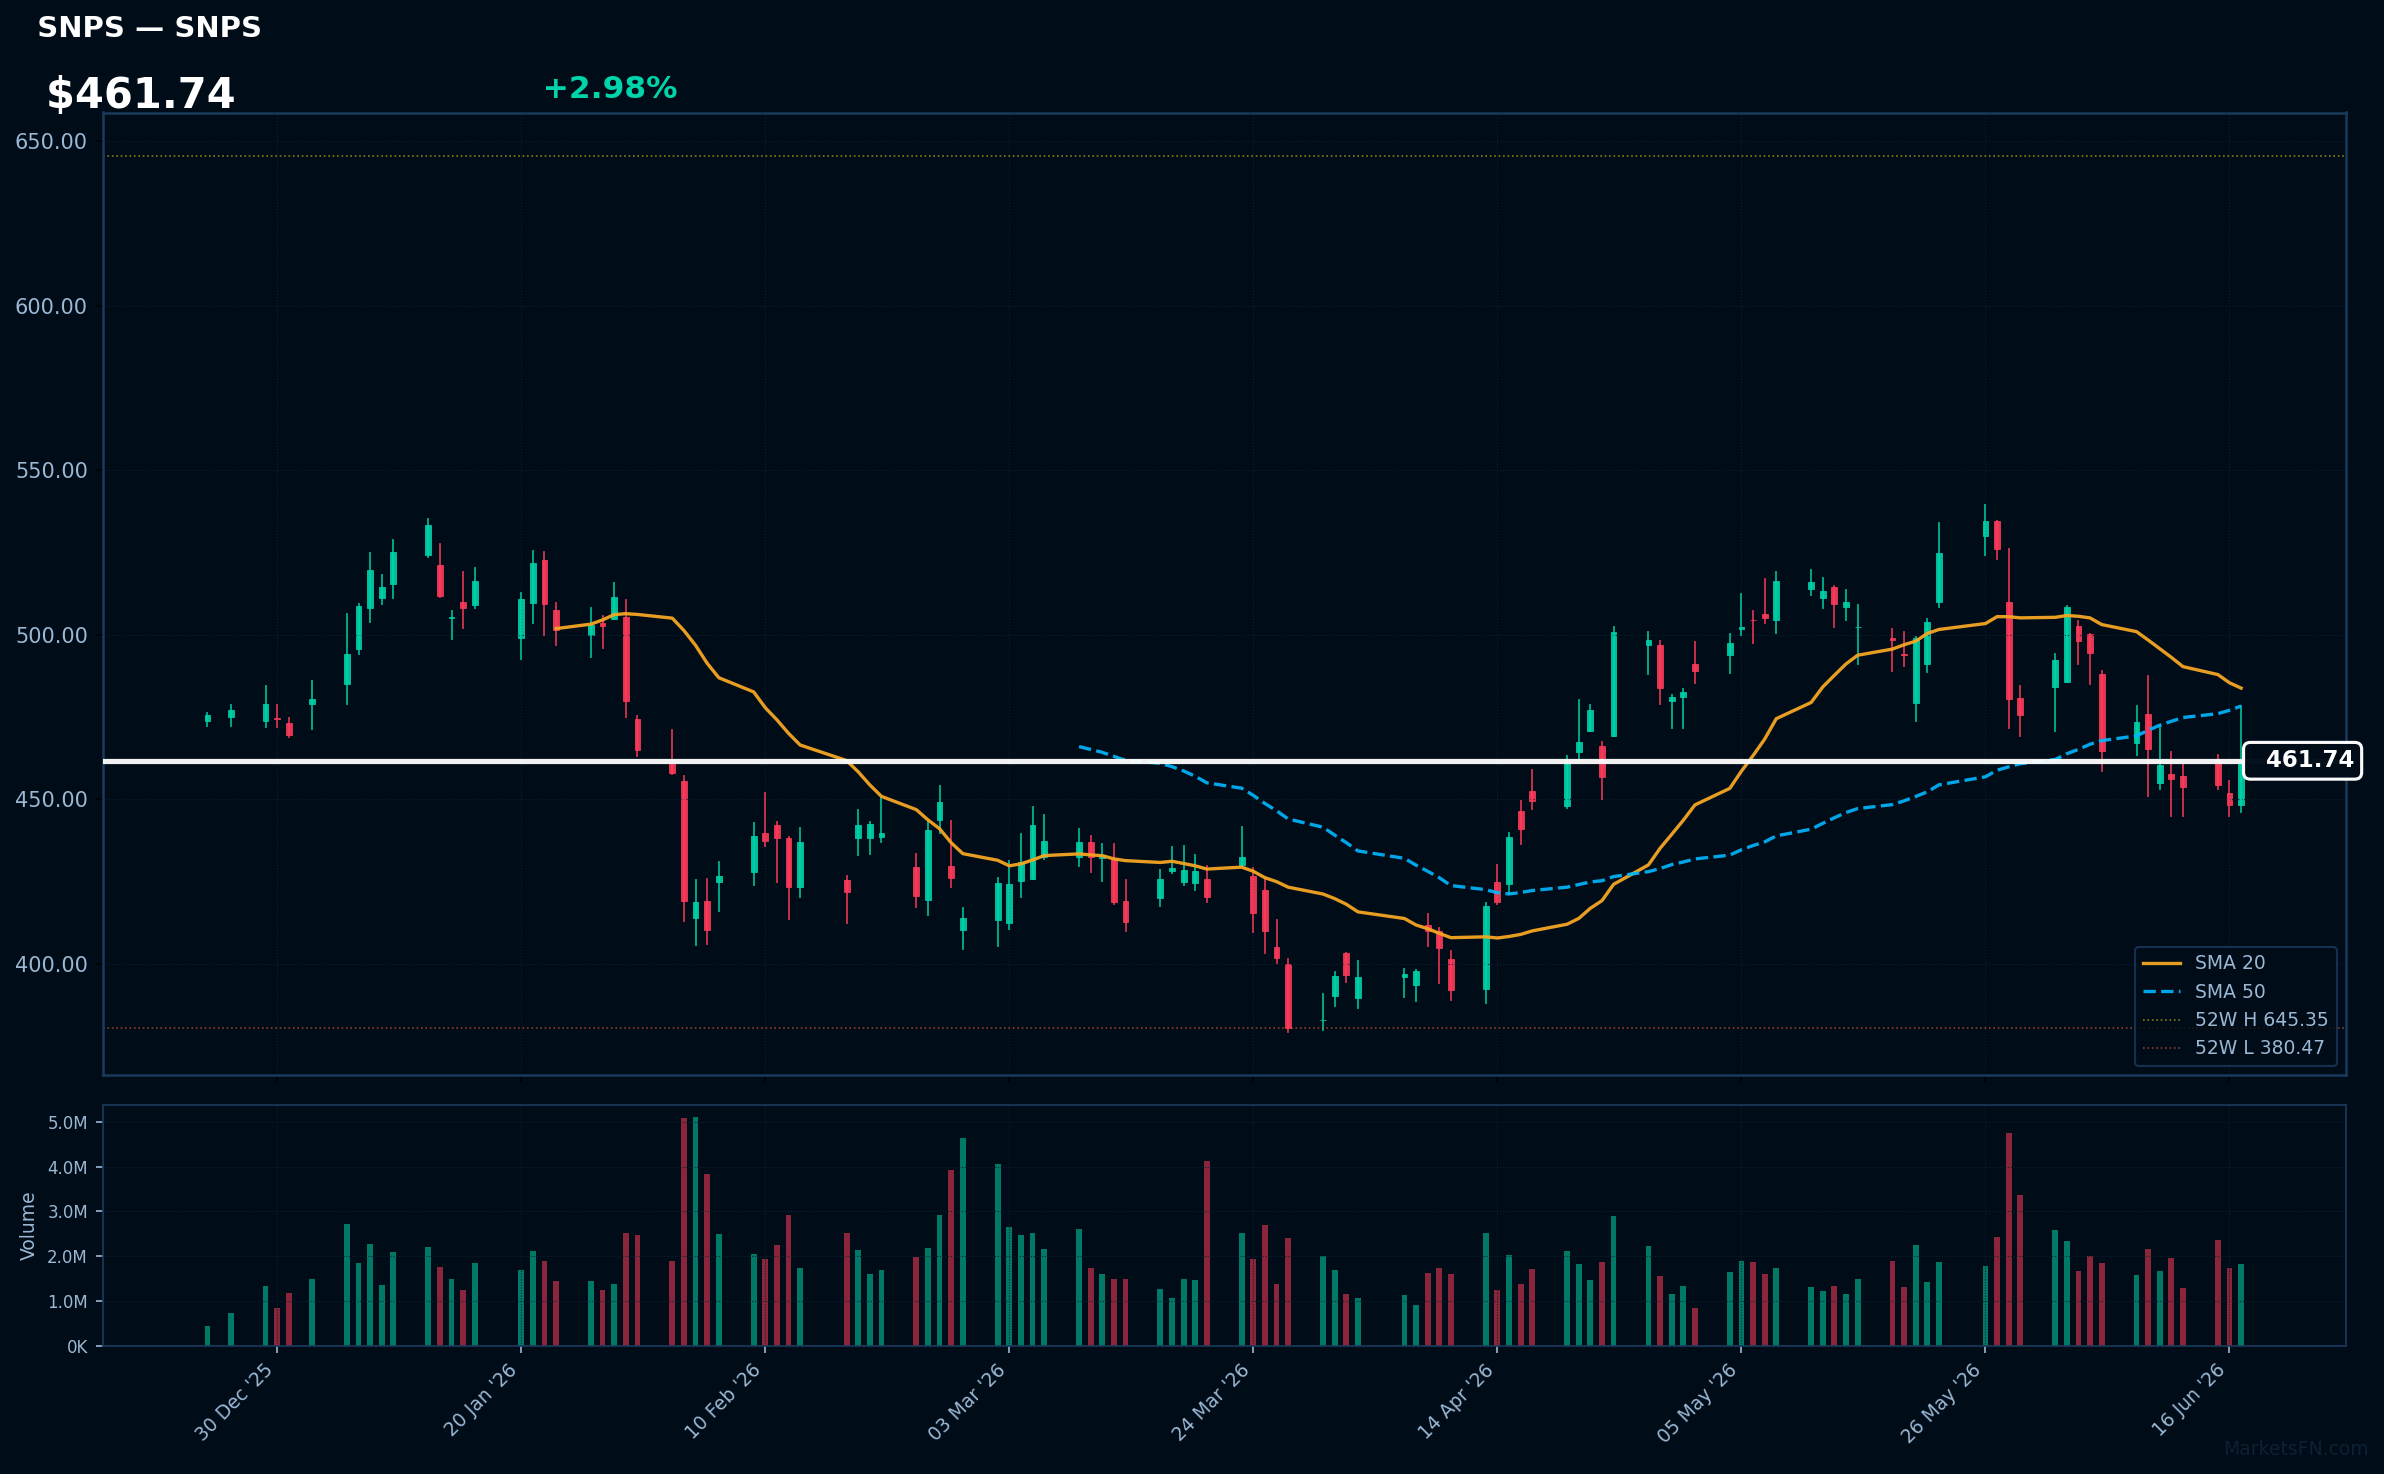
SNPS | Synopsys, Inc | Technology | Price: $461.74 | Day: +2.98% | 1W: +0.26% | 1M: -7.36% | RSI: 43.7 | vs MA200: +0.3% | Trend: Above MA200 · Below MA20, MA50
Recent headlines (last 12h)
- Synopsys Announces Availability of the First Wave of Multiphysics Fusion Solutions
MU | Micron Technology Inc | Technology | Price: $1043.19 | Day: +2.20% | 1W: +16.97% | 1M: +53.06% | RSI: 61.7 | vs MA200: +163.7% | Trend: Above MA20, MA50, MA200
Recent headlines (last 12h)
- Wall Street Grows More Bullish on Micron Ahead of Earnings
- Citi Has a New Micron Stock Target for 2027
- Micron Gets a Huge AI Price-Target Boost
- Why It Is Time to Stop Buying Chip Stocks
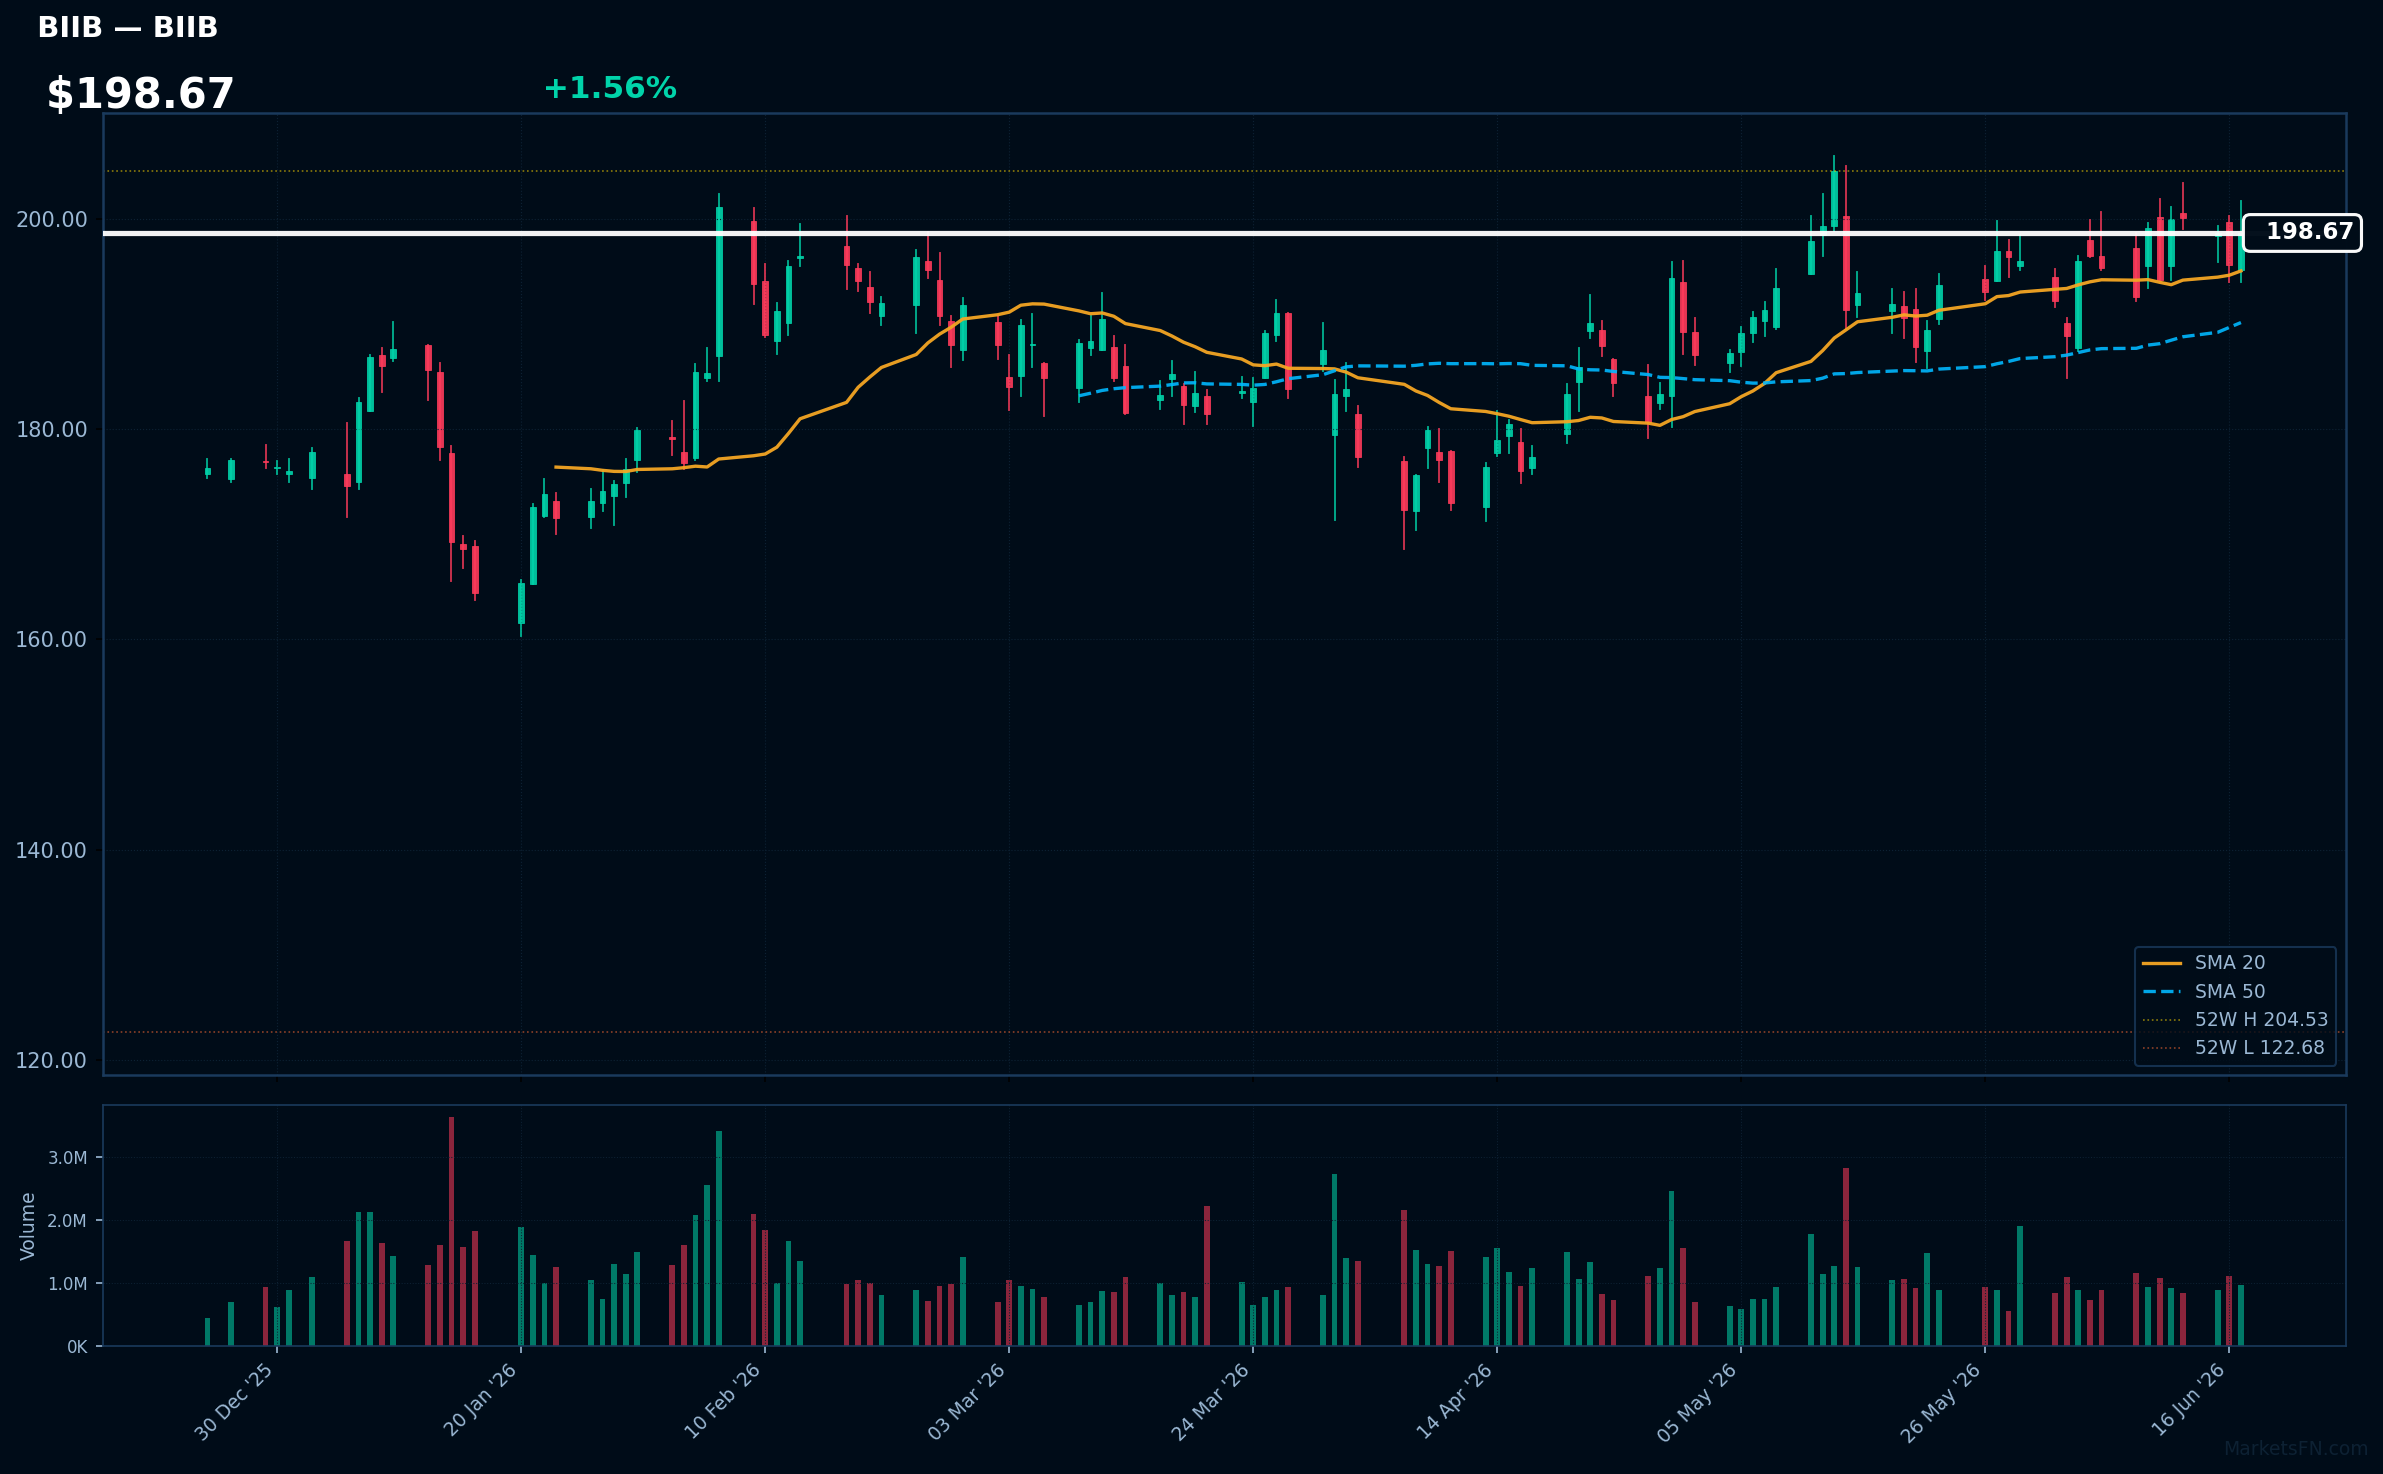
BIIB | Biogen Inc | Healthcare | Price: $198.67 | Day: +1.56% | 1W: +2.28% | 1M: +3.52% | RSI: 55.2 | vs MA200: +13.9% | Trend: Above MA20, MA50, MA200
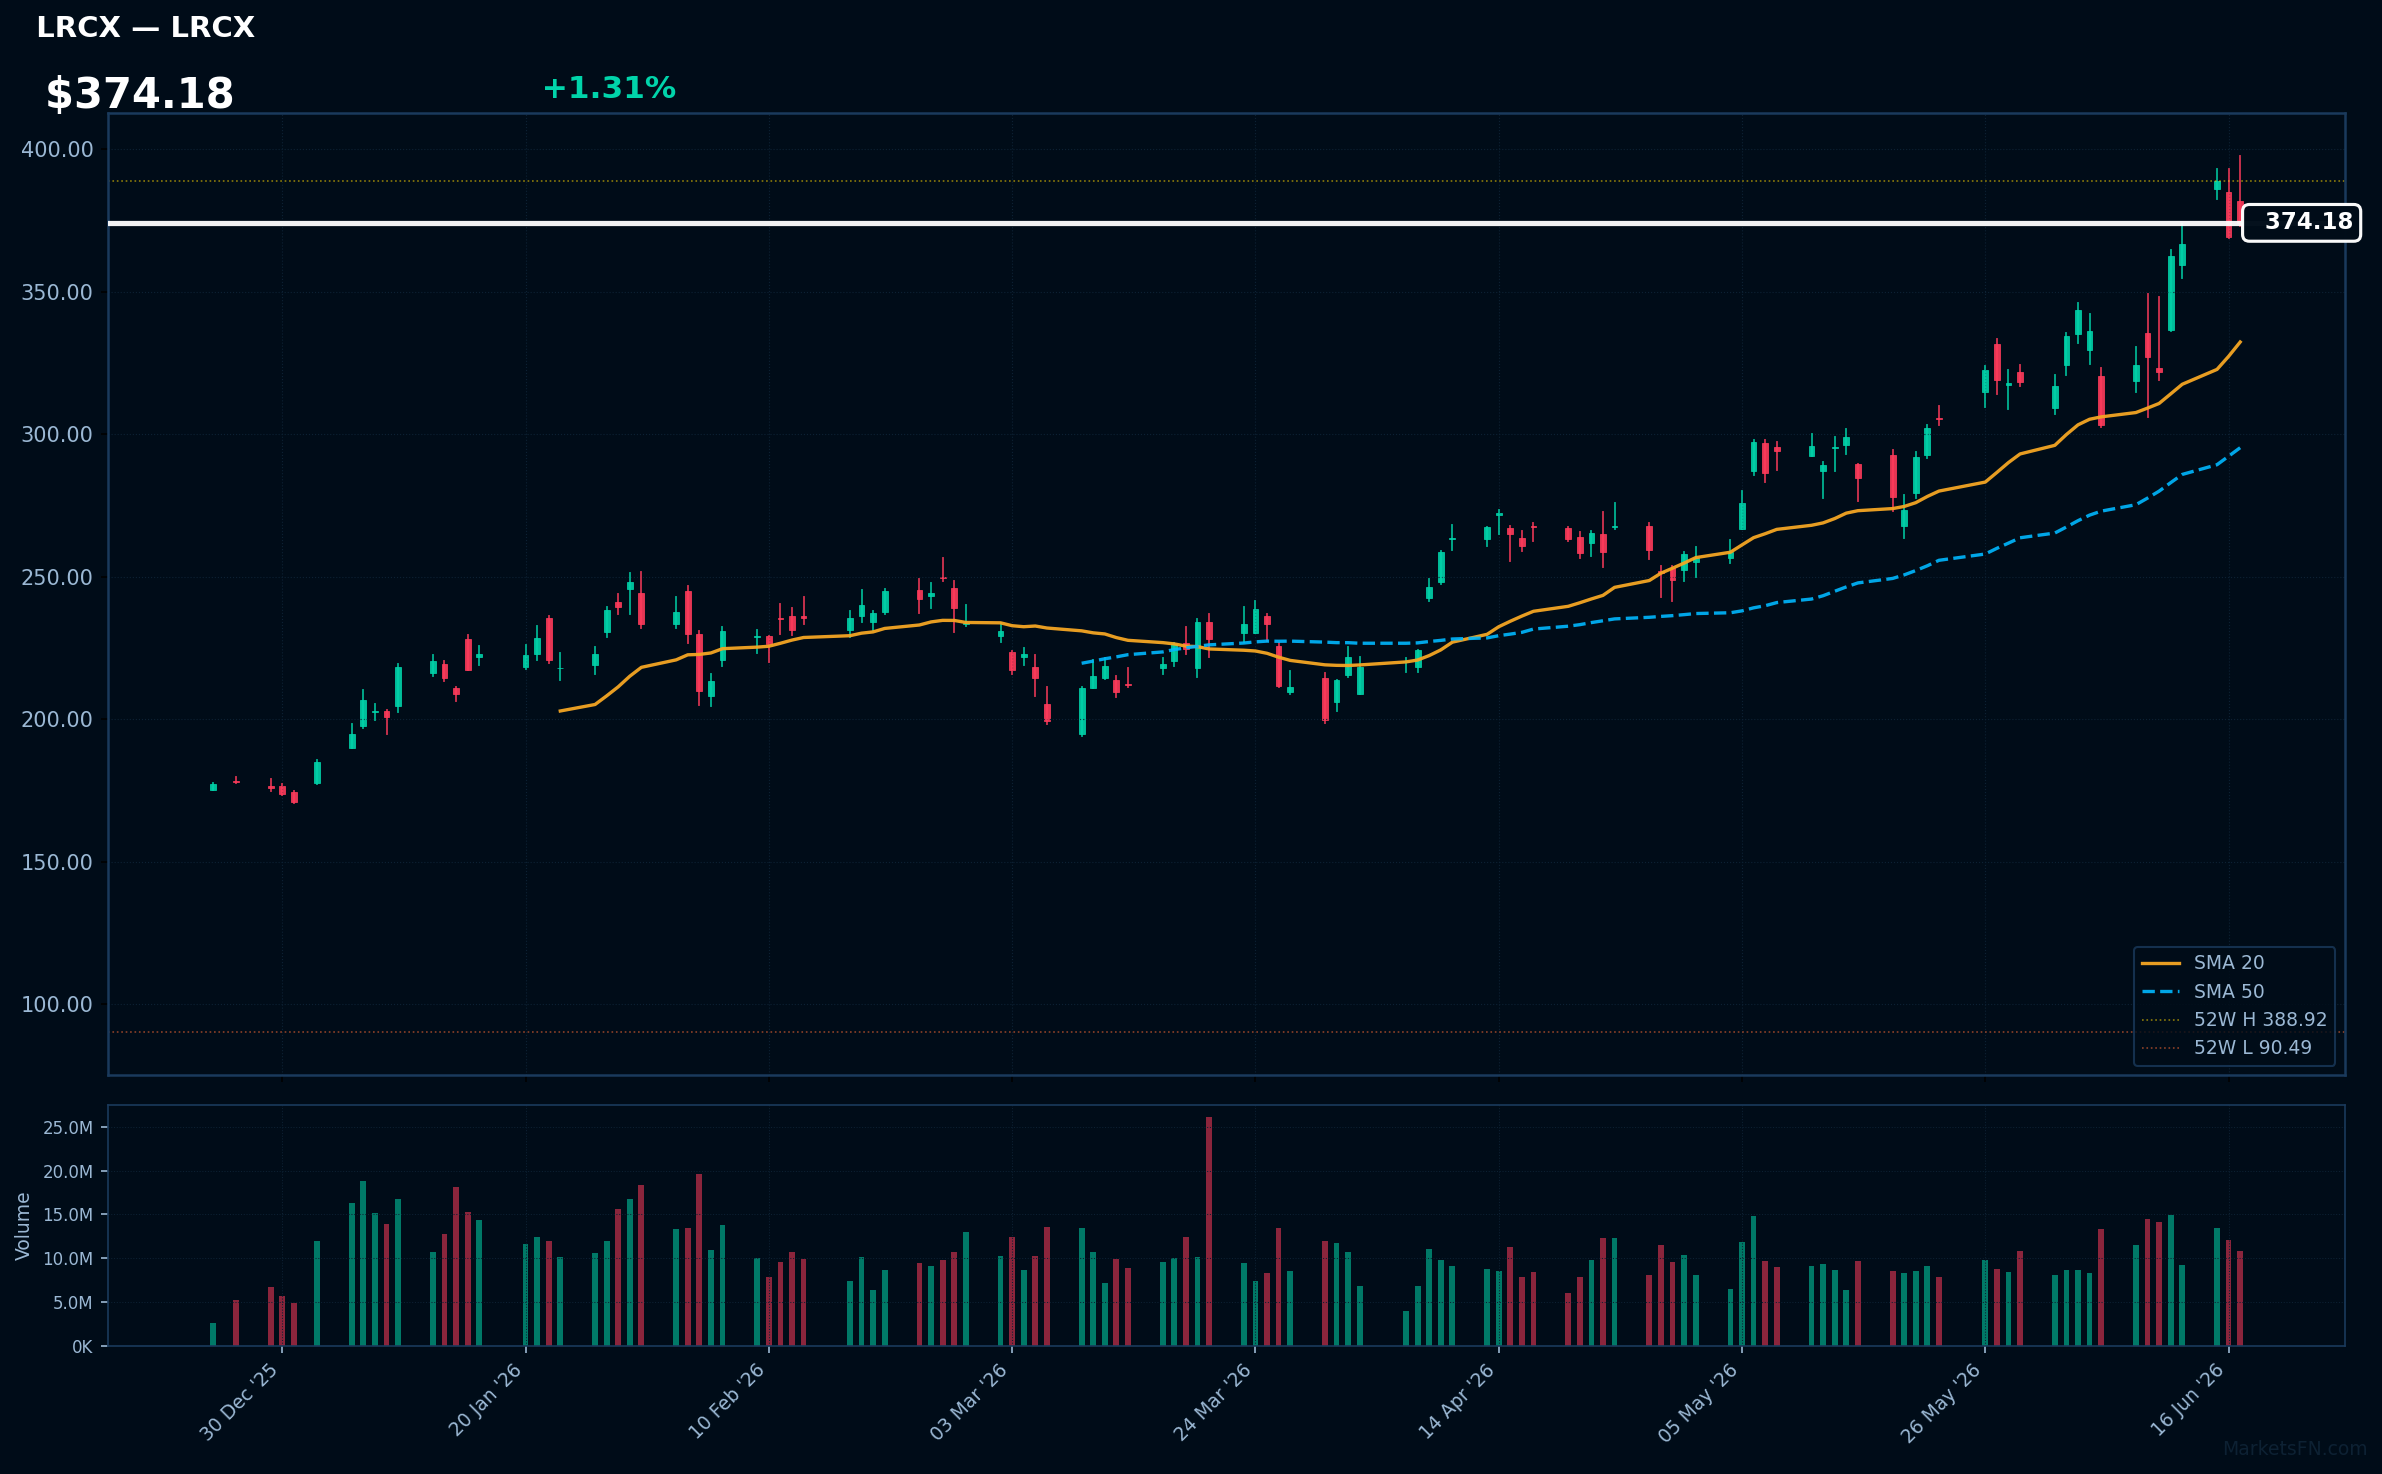
LRCX | Lam Research Corp | Technology | Price: $374.18 | Day: +1.31% | 1W: +16.28% | 1M: +34.62% | RSI: 65.6 | vs MA200: +79.4% | Trend: Above MA20, MA50, MA200
Recent headlines (last 12h)
- Applied Materials, ASML, Lam Hit Record Highs, Lead Chip Gear Stocks Rally
- Applied Materials Stock Is One Of the S&P 500 Leaders Today. It's AI.
- Semiconductor Stocks Climb in Premarket Trade Following Intel Manufacturing Milestone
- Citi lifts PTs on AMAT, LRCX, & KLAC amid booming WFE demand
Top 10 Losers
Today's weakest Nasdaq 100 performers. Sector drag: Technology (4), Communication Services (3), Healthcare (1), Real Estate (1), Industrials (1).
| Ticker | Company | Sector | Price | Day % | 1W % | 1M % | RSI | vs MA200 | Trend |
|---|---|---|---|---|---|---|---|---|---|
| ON | ON Semiconductor Corp | Technology | $112.92 | -4.51% | +2.50% | +3.19% | 48.6 | +65.7% | Above MA50, MA200 · Below MA20 |
| SHOP | Shopify Inc | Technology | $108.09 | -4.54% | -0.10% | +5.57% | 46.3 | -21.5% | Below MA20, MA50, MA200 |
| IDXX | Idexx Laboratories, Inc | Healthcare | $546.09 | -4.70% | -1.95% | +0.05% | 43.7 | -13.7% | Below MA20, MA50, MA200 |
| CSGP | Costar Group, Inc | Real Estate | $30.46 | -4.72% | -11.01% | -8.25% | 31.0 | -46.7% | Below MA20, MA50, MA200 |
| MSTR | Strategy Inc | Technology | $116.56 | -5.09% | +1.05% | -30.05% | 35.7 | -39.6% | Below MA20, MA50, MA200 |
| ADBE | Adobe Inc | Technology | $196.28 | -5.33% | -15.90% | -23.22% | 28.1 | -33.7% | Below MA20, MA50, MA200 |
| META | Meta Platforms Inc | Communication Services | $567.58 | -5.44% | -0.60% | -7.14% | 39.3 | -13.4% | Below MA20, MA50, MA200 |
| ODFL | Old Dominion Freight Line, Inc | Industrials | $218.36 | -5.72% | -7.45% | +6.97% | 44.6 | +24.0% | Above MA50, MA200 · Below MA20 |
| CHTR | Charter Communications Inc | Communication Services | $132.00 | -6.90% | -4.20% | -6.52% | 35.7 | -37.8% | Below MA20, MA50, MA200 |
| APP | Applovin Corp | Communication Services | $479.49 | -6.93% | -2.74% | -2.62% | 42.7 | -11.6% | Below MA20, MA50, MA200 |
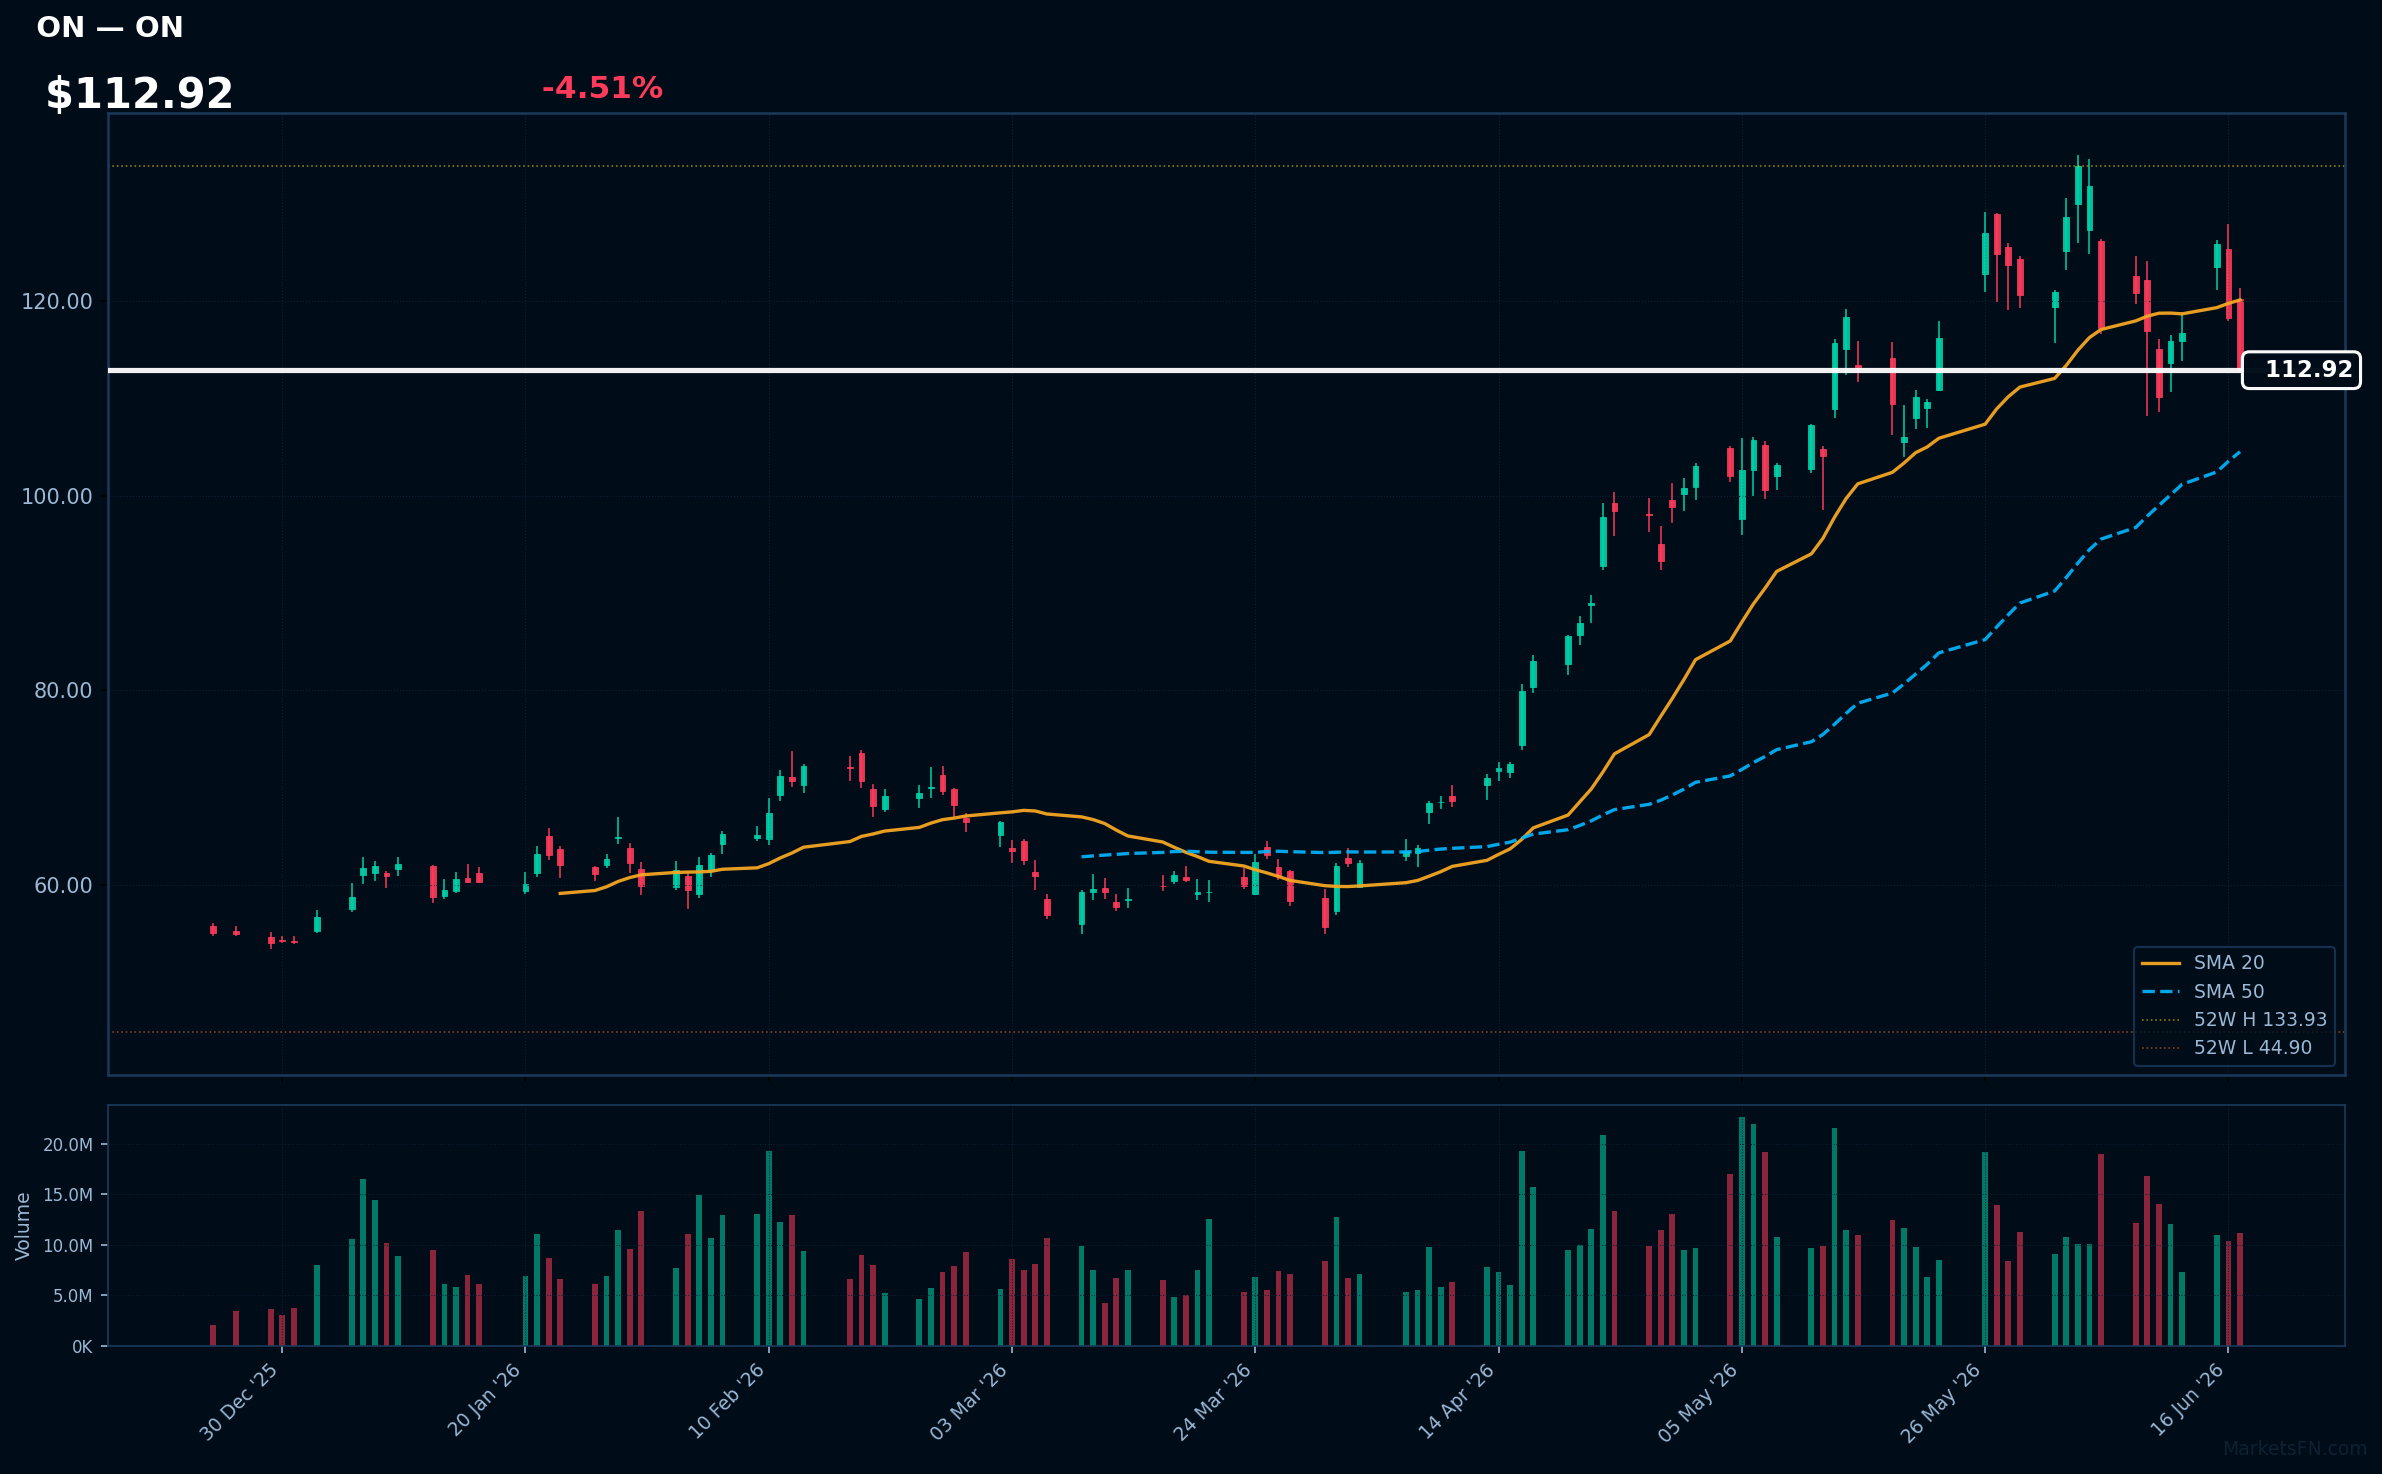
ON | ON Semiconductor Corp | Technology | Price: $112.92 | Day: -4.51% | 1W: +2.50% | 1M: +3.19% | RSI: 48.6 | vs MA200: +65.7% | Trend: Above MA50, MA200 · Below MA20
Recent headlines (last 12h)
- Texas Instruments Stock And The Industrial Recovery Hiding In Plain Sight
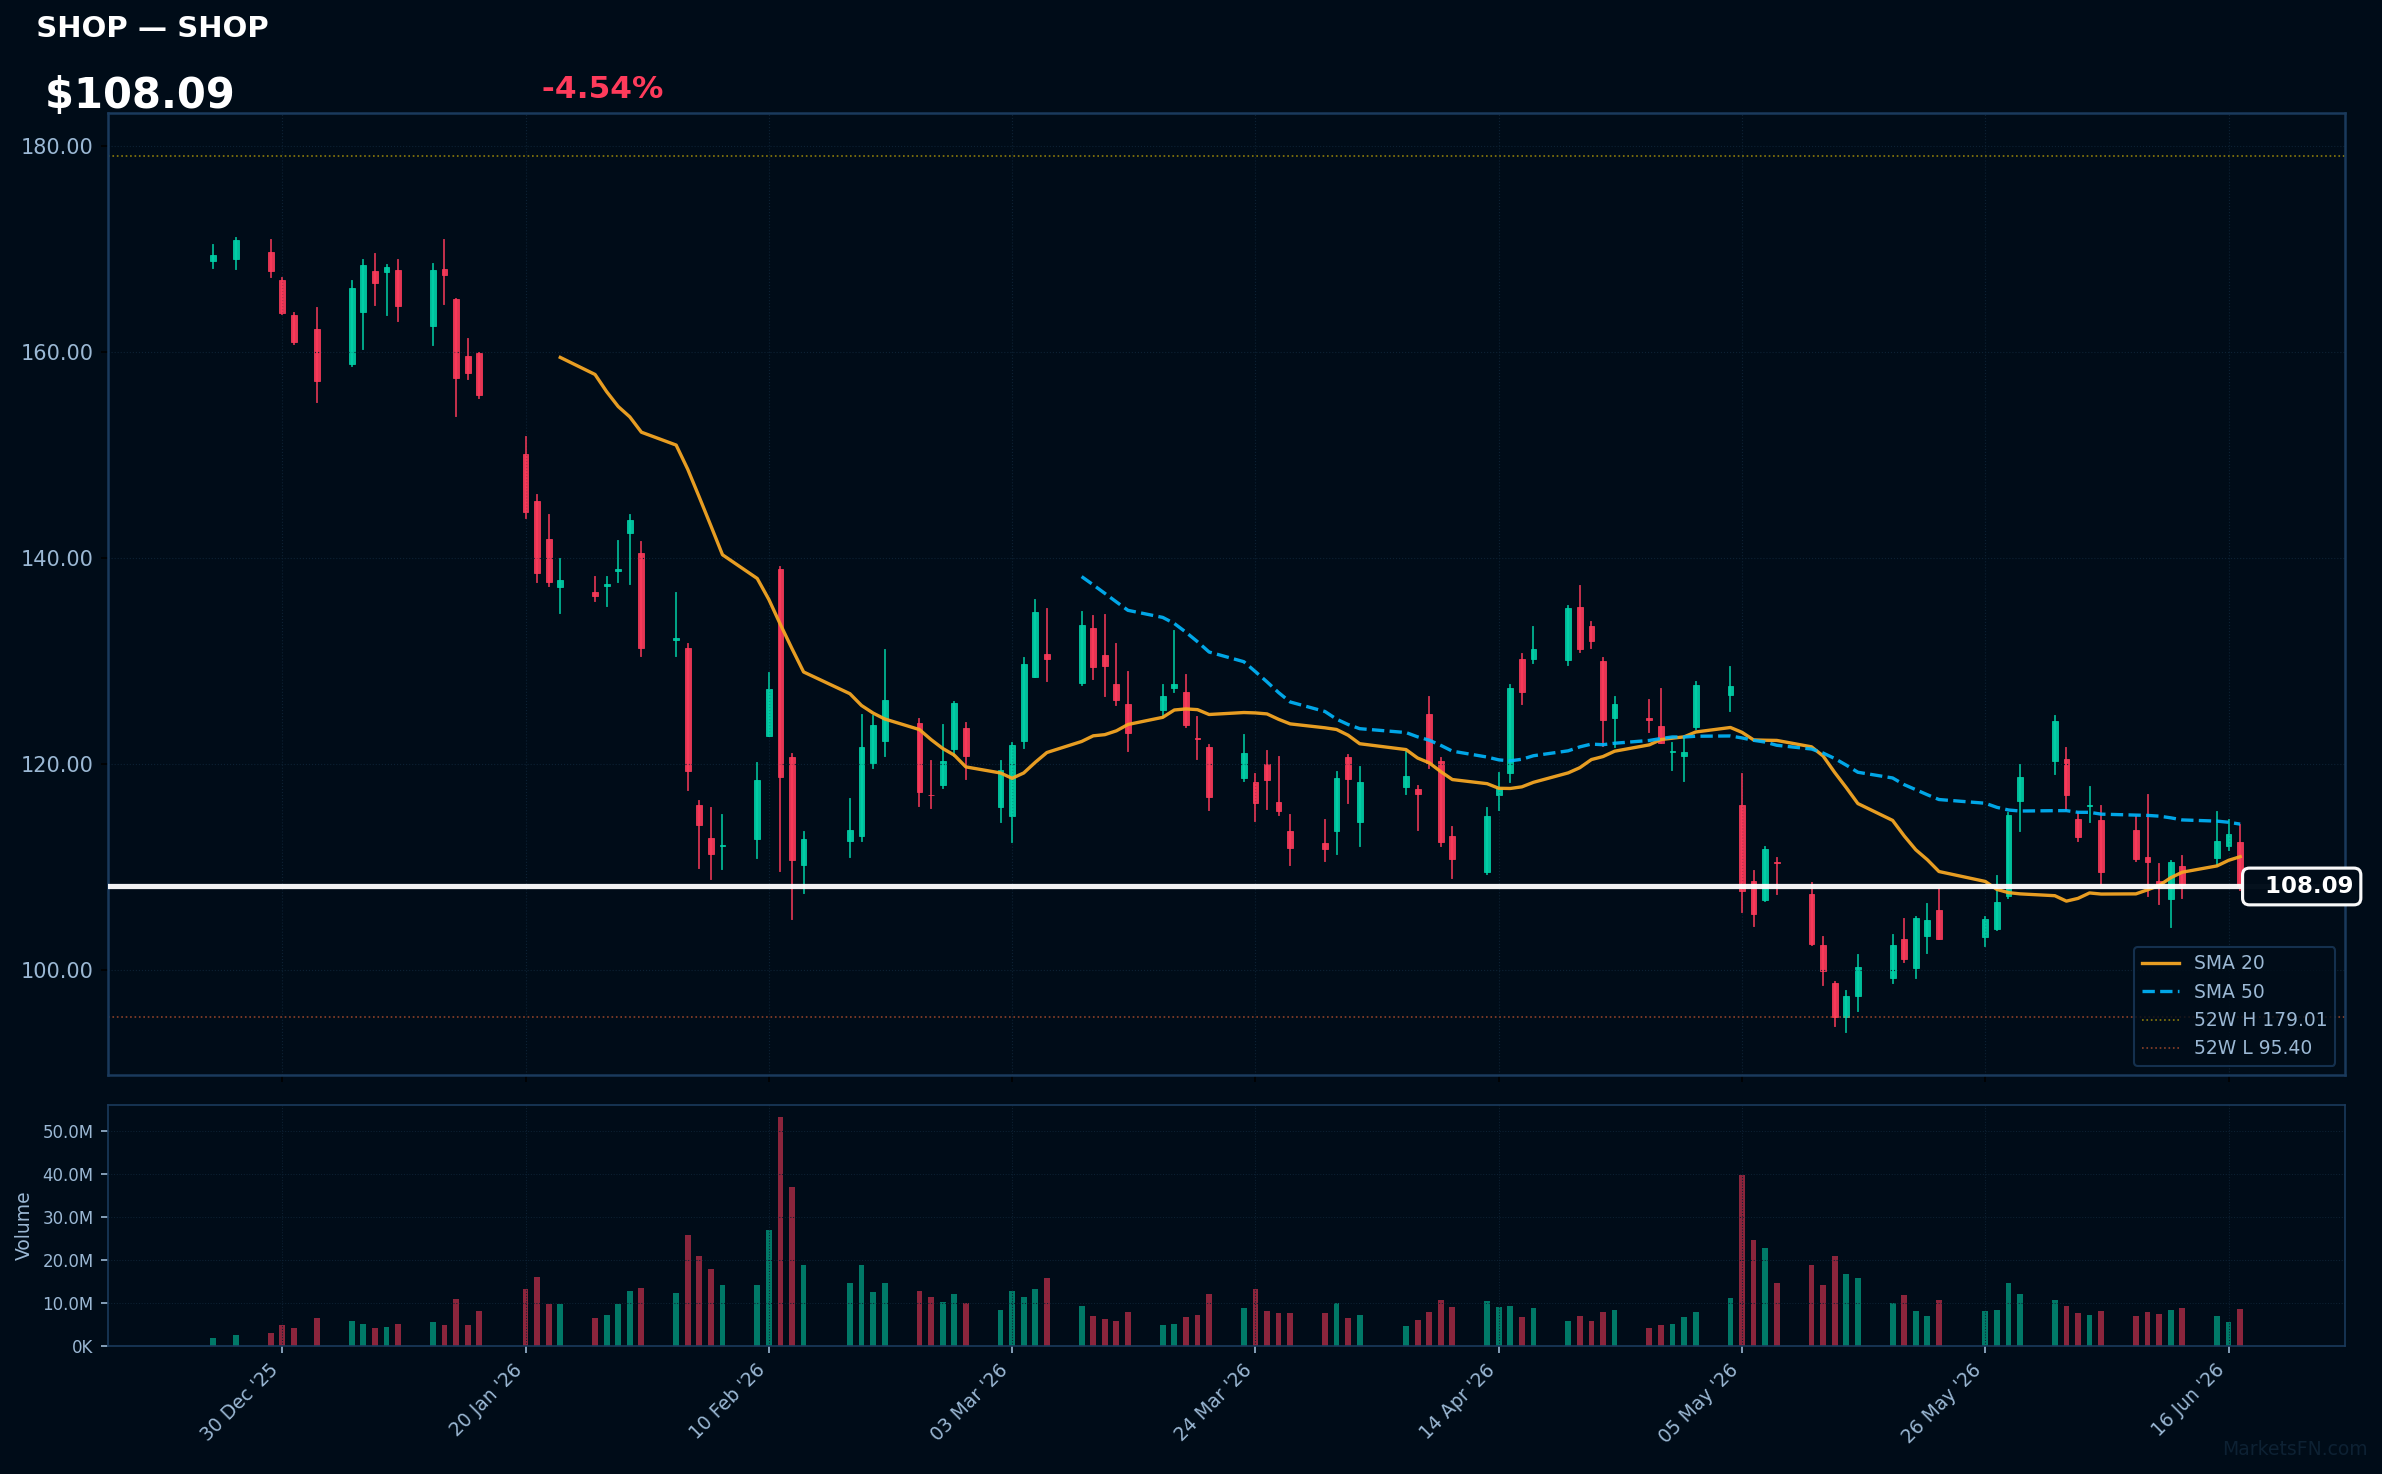
SHOP | Shopify Inc | Technology | Price: $108.09 | Day: -4.54% | 1W: -0.10% | 1M: +5.57% | RSI: 46.3 | vs MA200: -21.5% | Trend: Below MA20, MA50, MA200
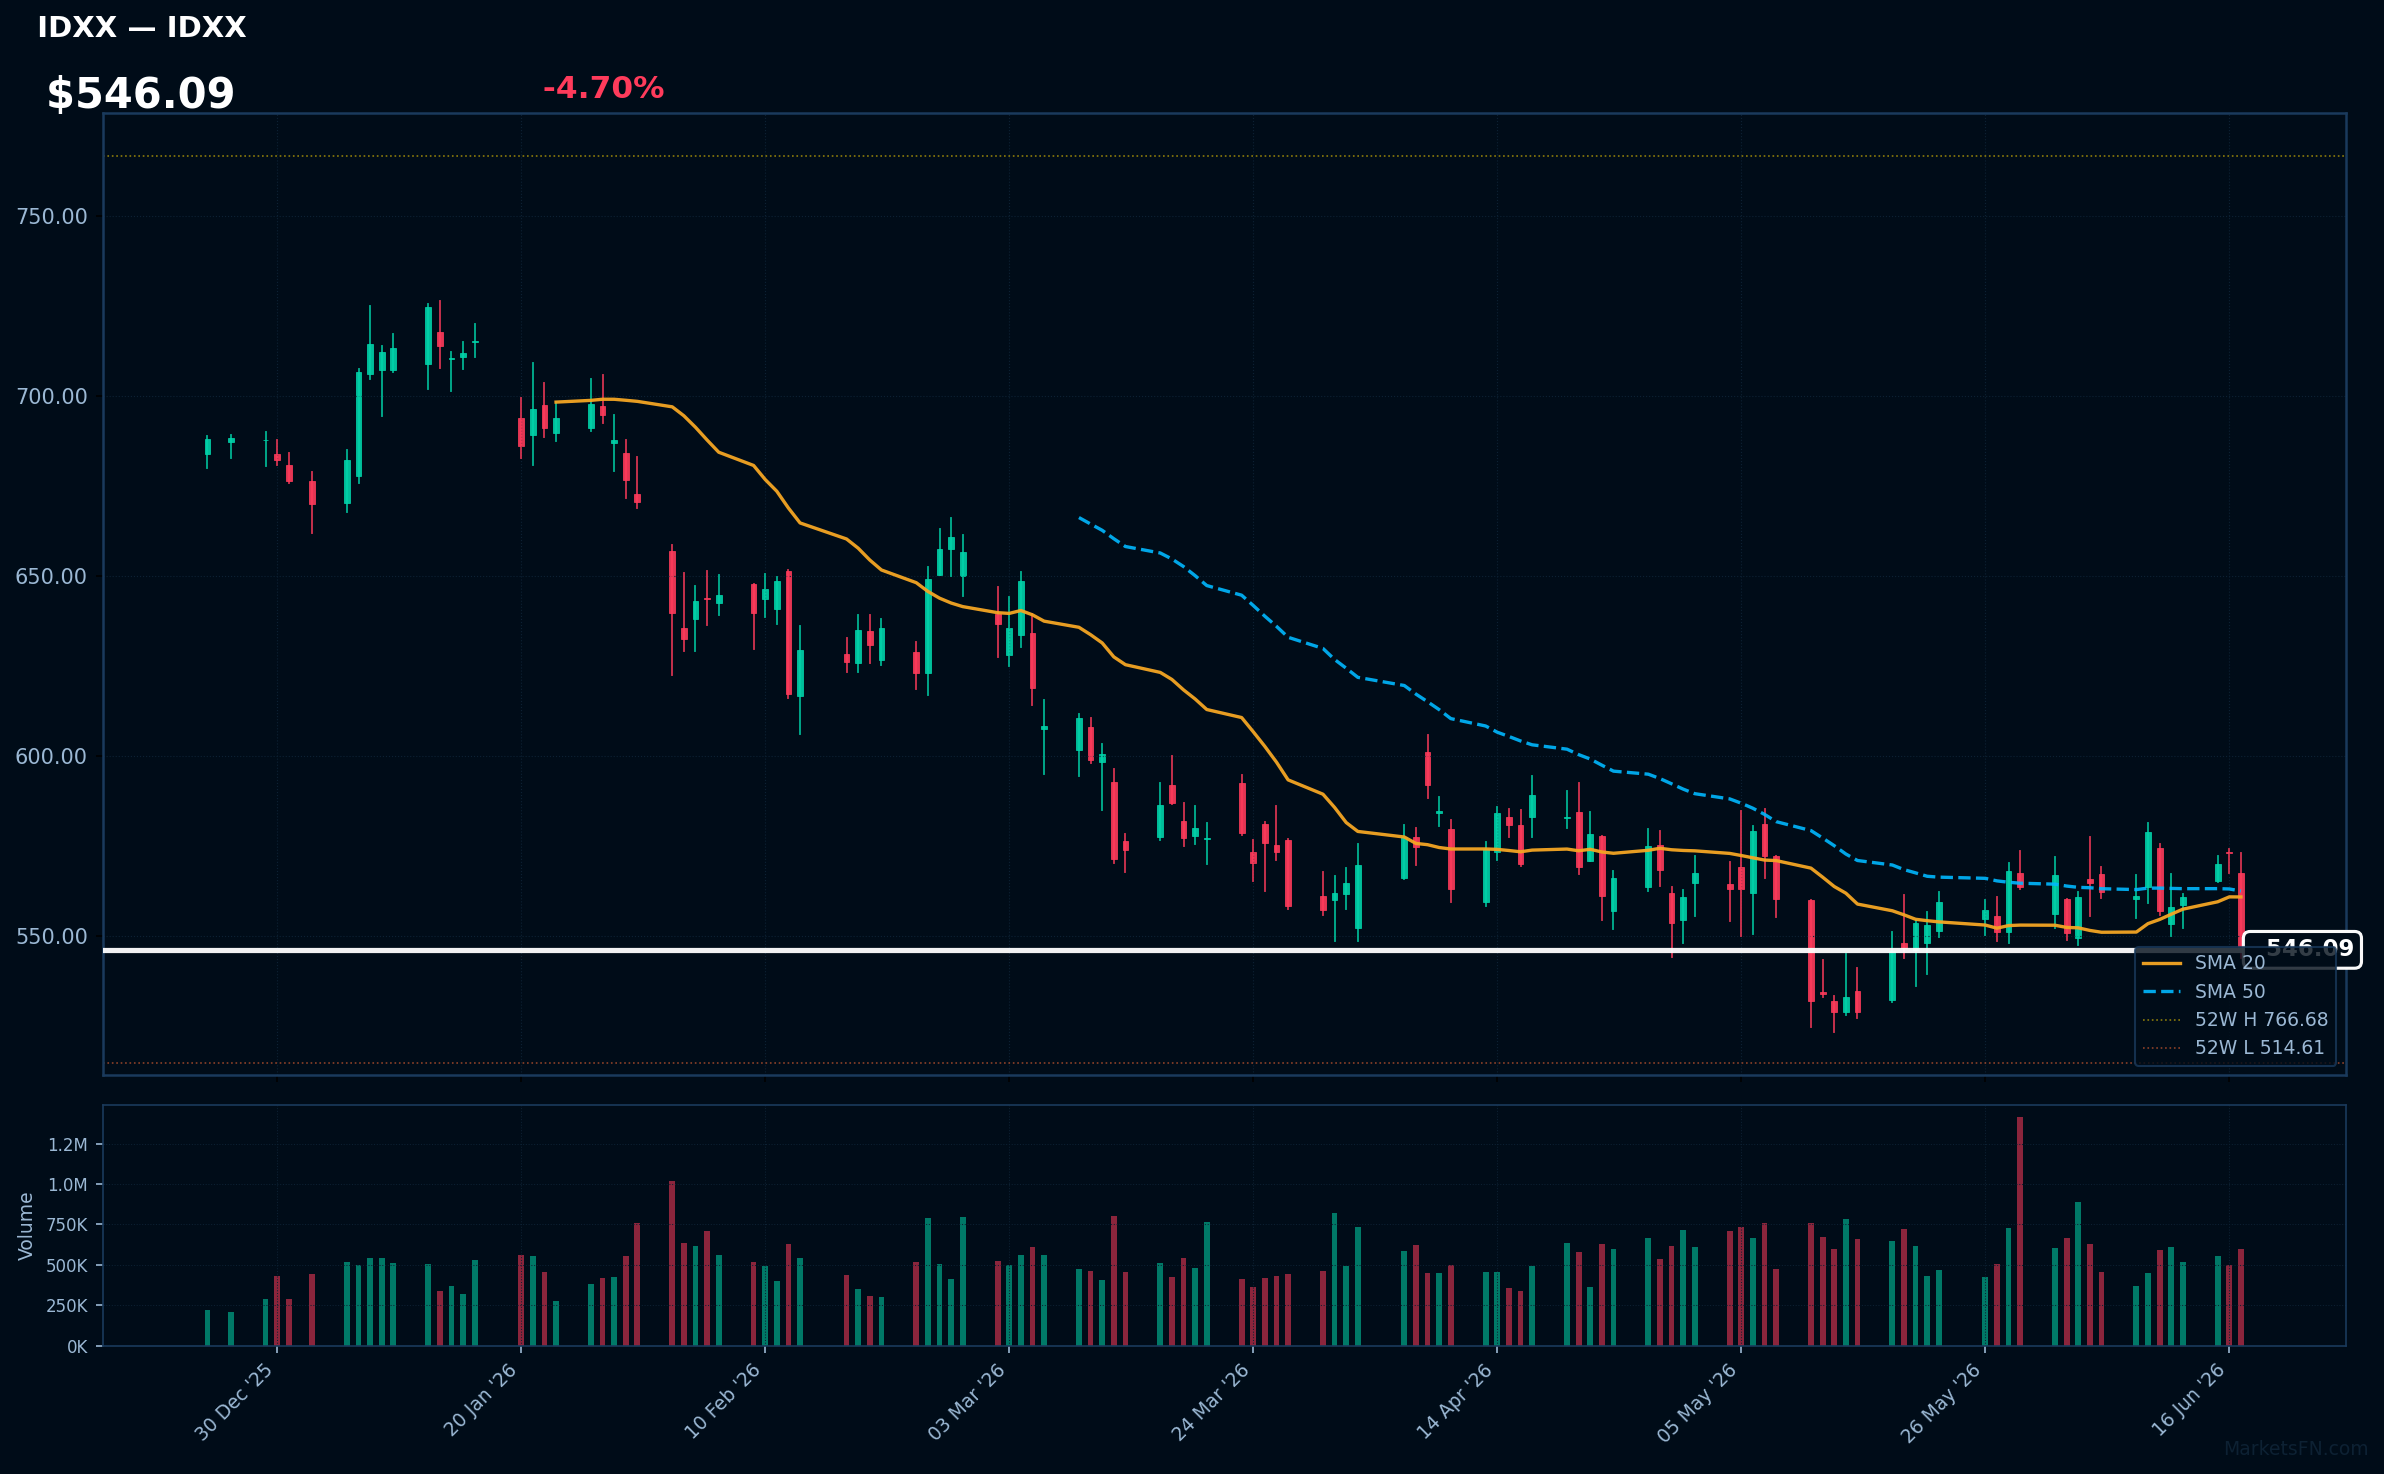
IDXX | Idexx Laboratories, Inc | Healthcare | Price: $546.09 | Day: -4.70% | 1W: -1.95% | 1M: +0.05% | RSI: 43.7 | vs MA200: -13.7% | Trend: Below MA20, MA50, MA200
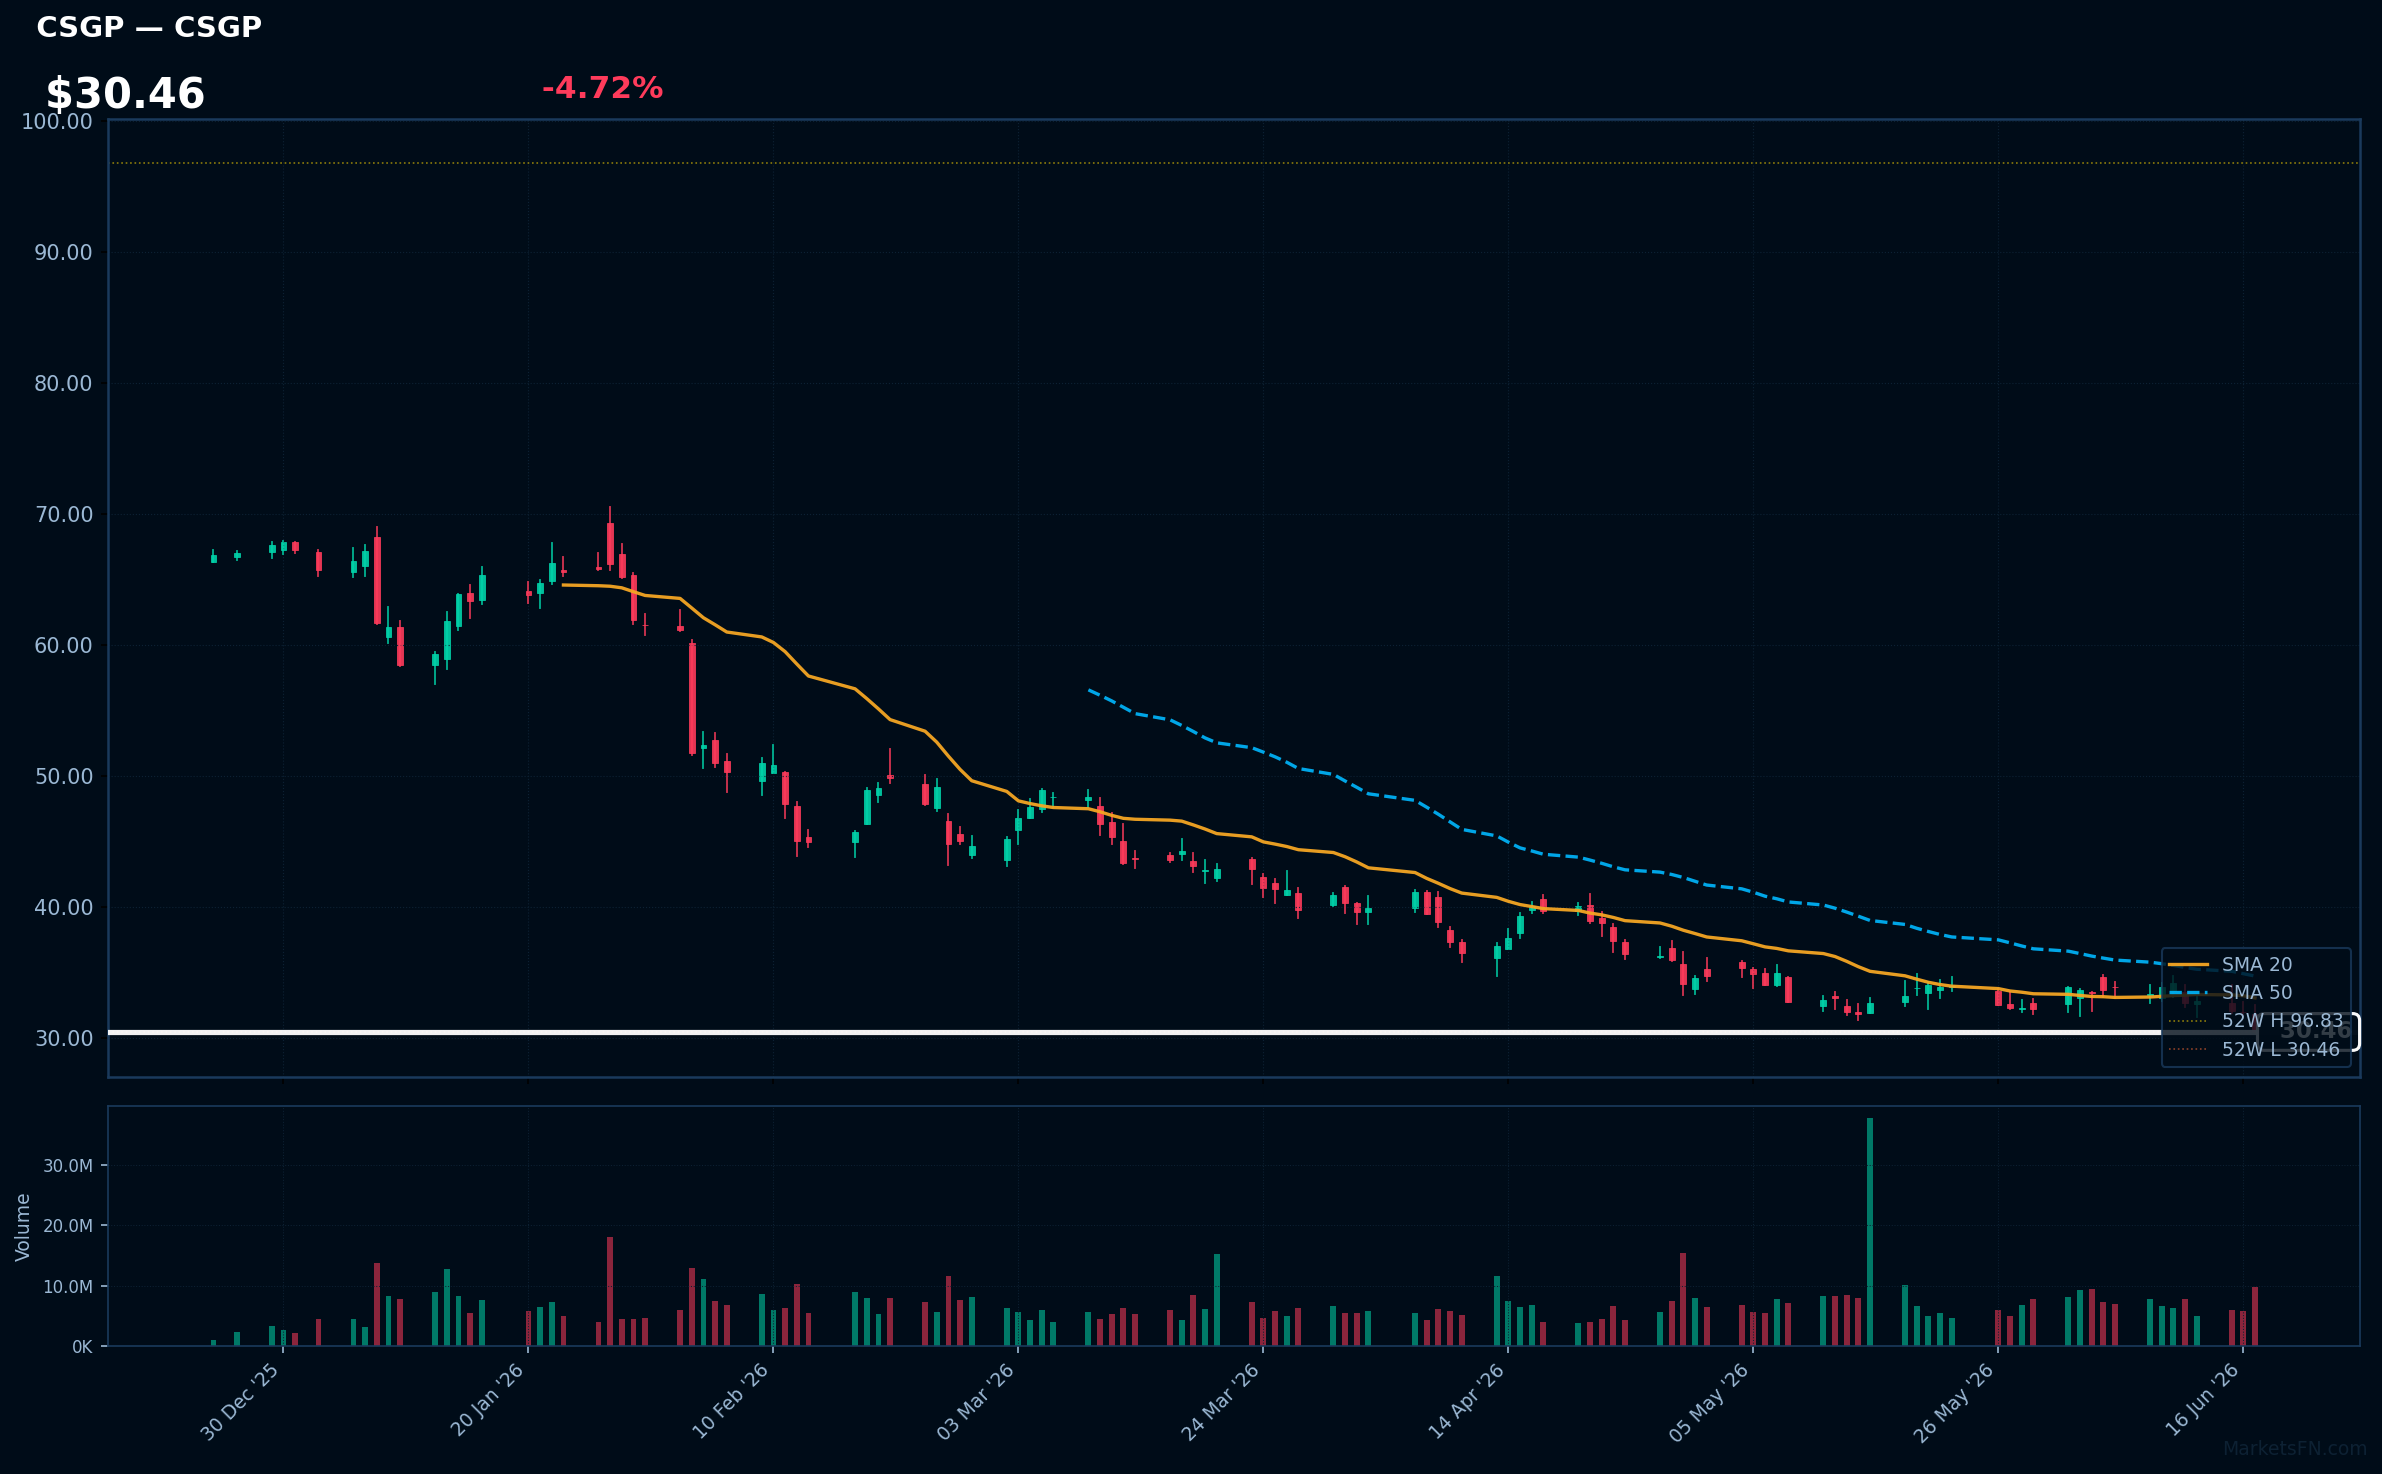
CSGP | Costar Group, Inc | Real Estate | Price: $30.46 | Day: -4.72% | 1W: -11.01% | 1M: -8.25% | RSI: 31.0 | vs MA200: -46.7% | Trend: Below MA20, MA50, MA200
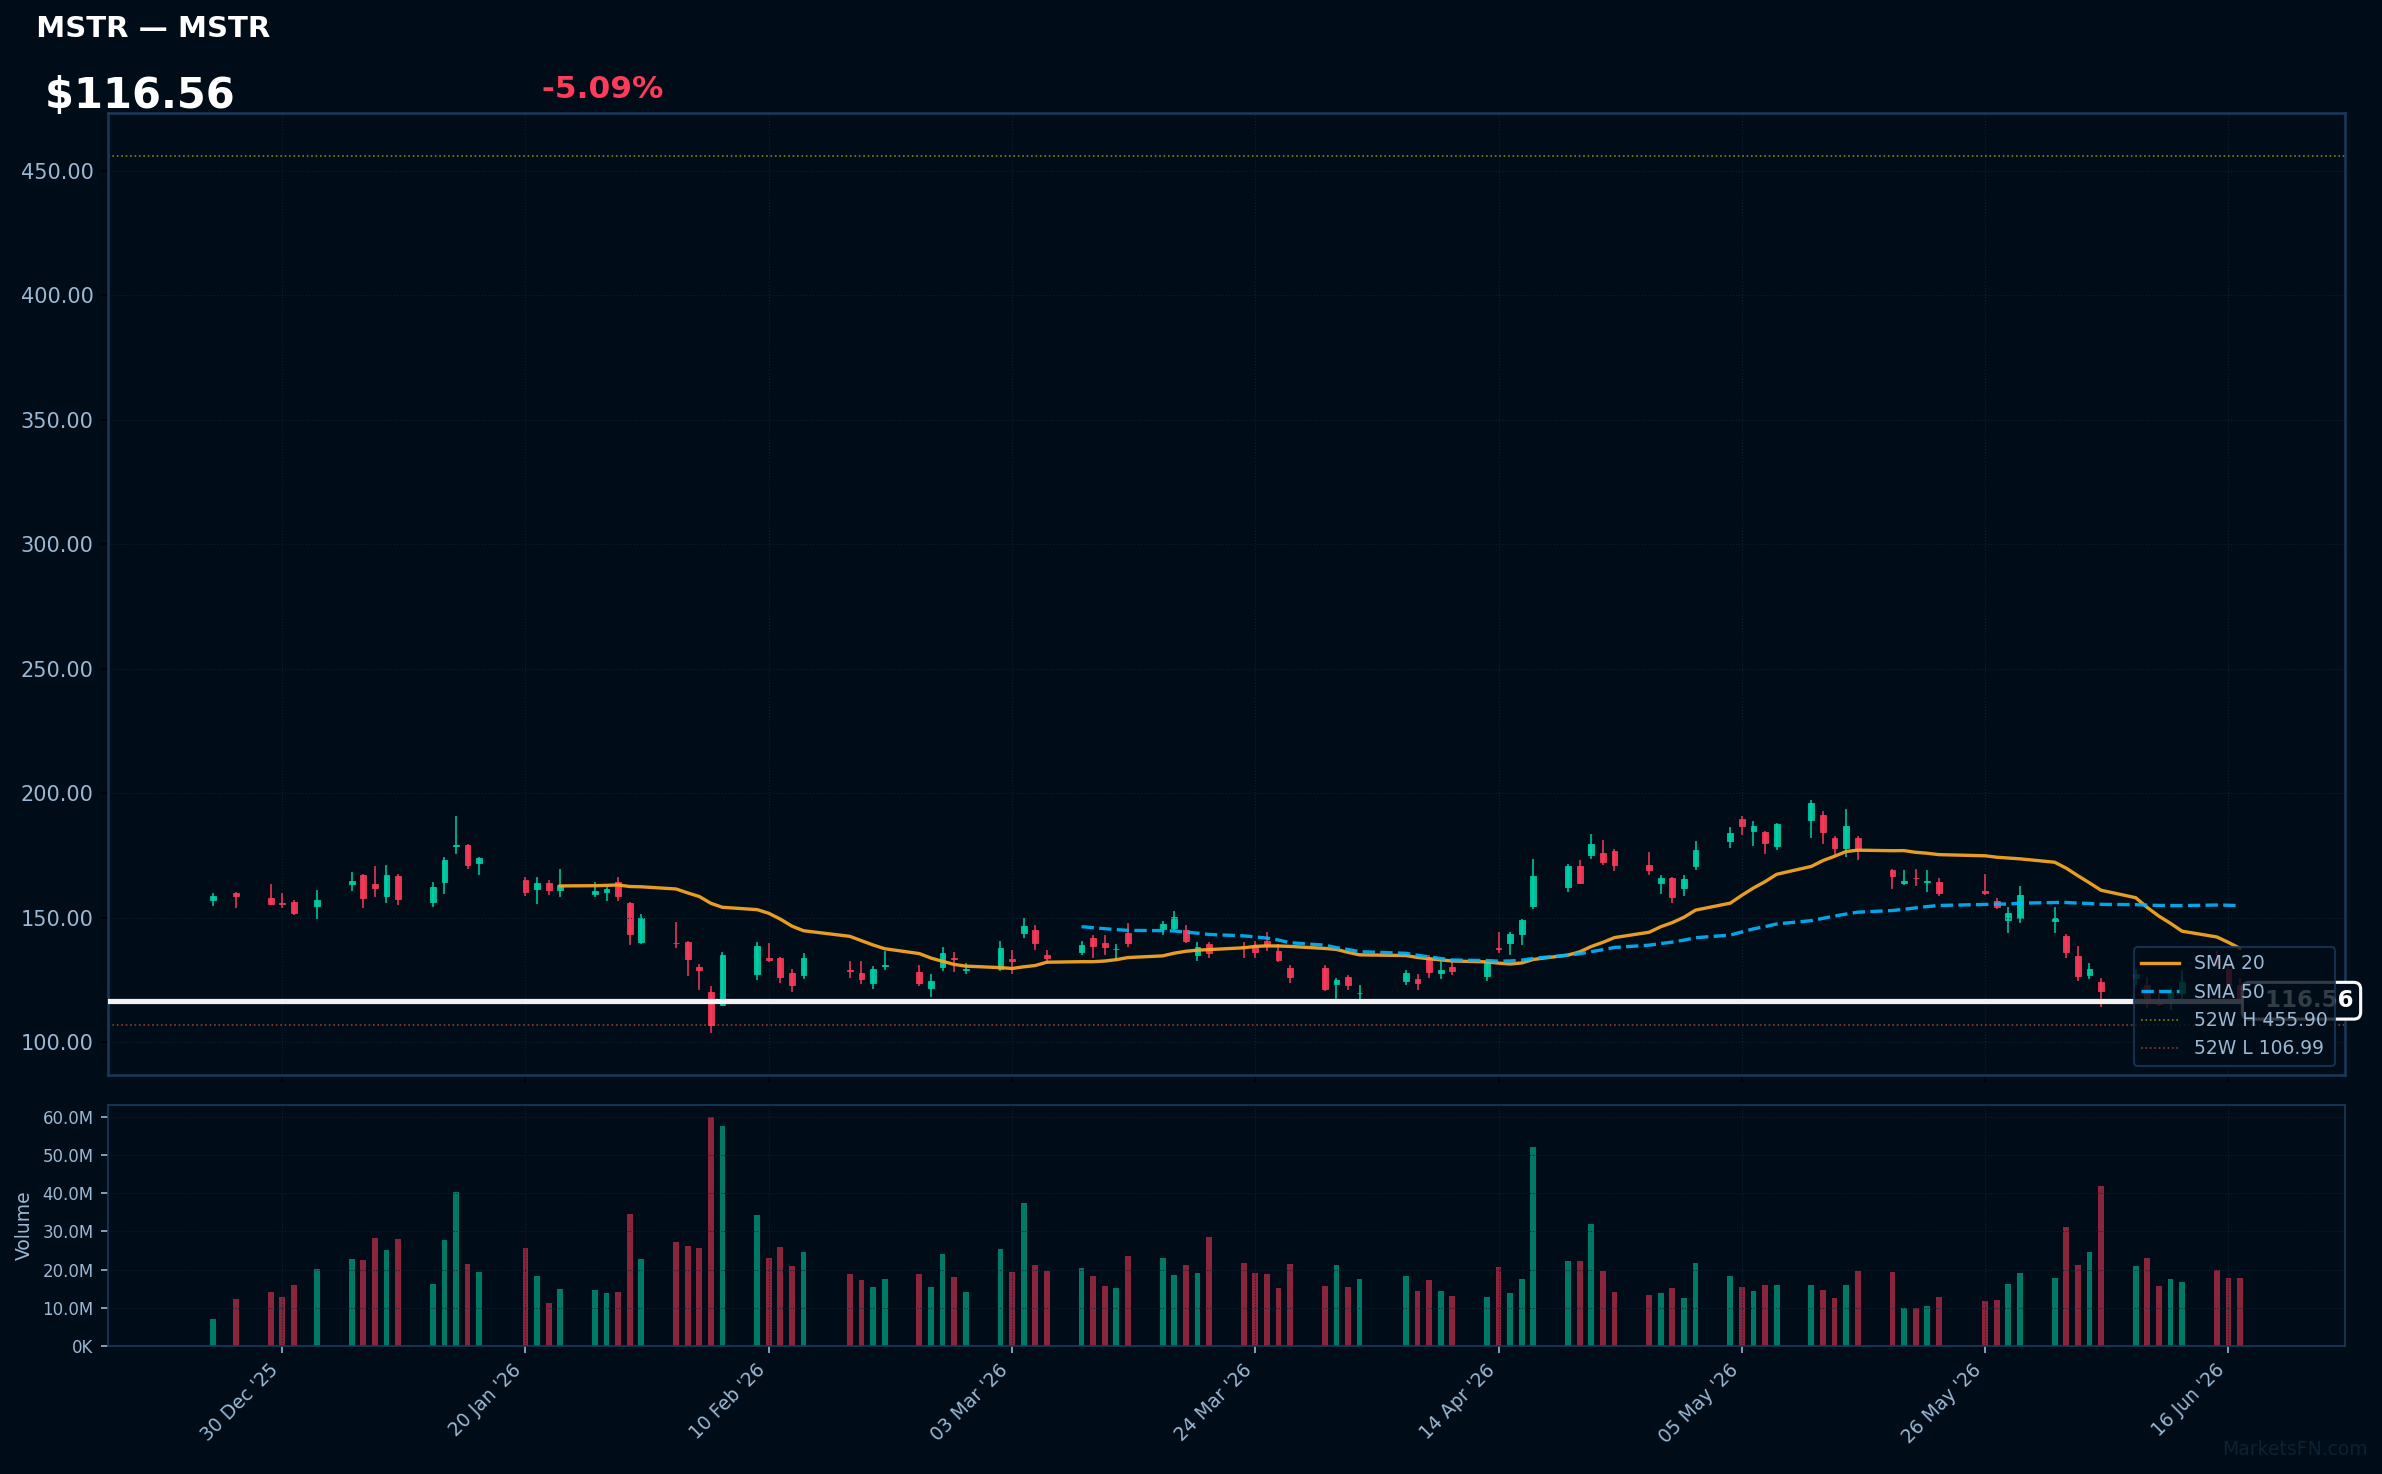
MSTR | Strategy Inc | Technology | Price: $116.56 | Day: -5.09% | 1W: +1.05% | 1M: -30.05% | RSI: 35.7 | vs MA200: -39.6% | Trend: Below MA20, MA50, MA200
Recent headlines (last 12h)
- Coinbase wants to be your bank, stockbroker, and financial advisor
- Why Digital Asset Treasury Company Strategy Finally Sold BitcoinCEO Phong Le Explains
- Strategys STRC Nears Record Low as Bitcoin Buying Draws Fire
- Strategy's Dividend-Paying Stock Crashes
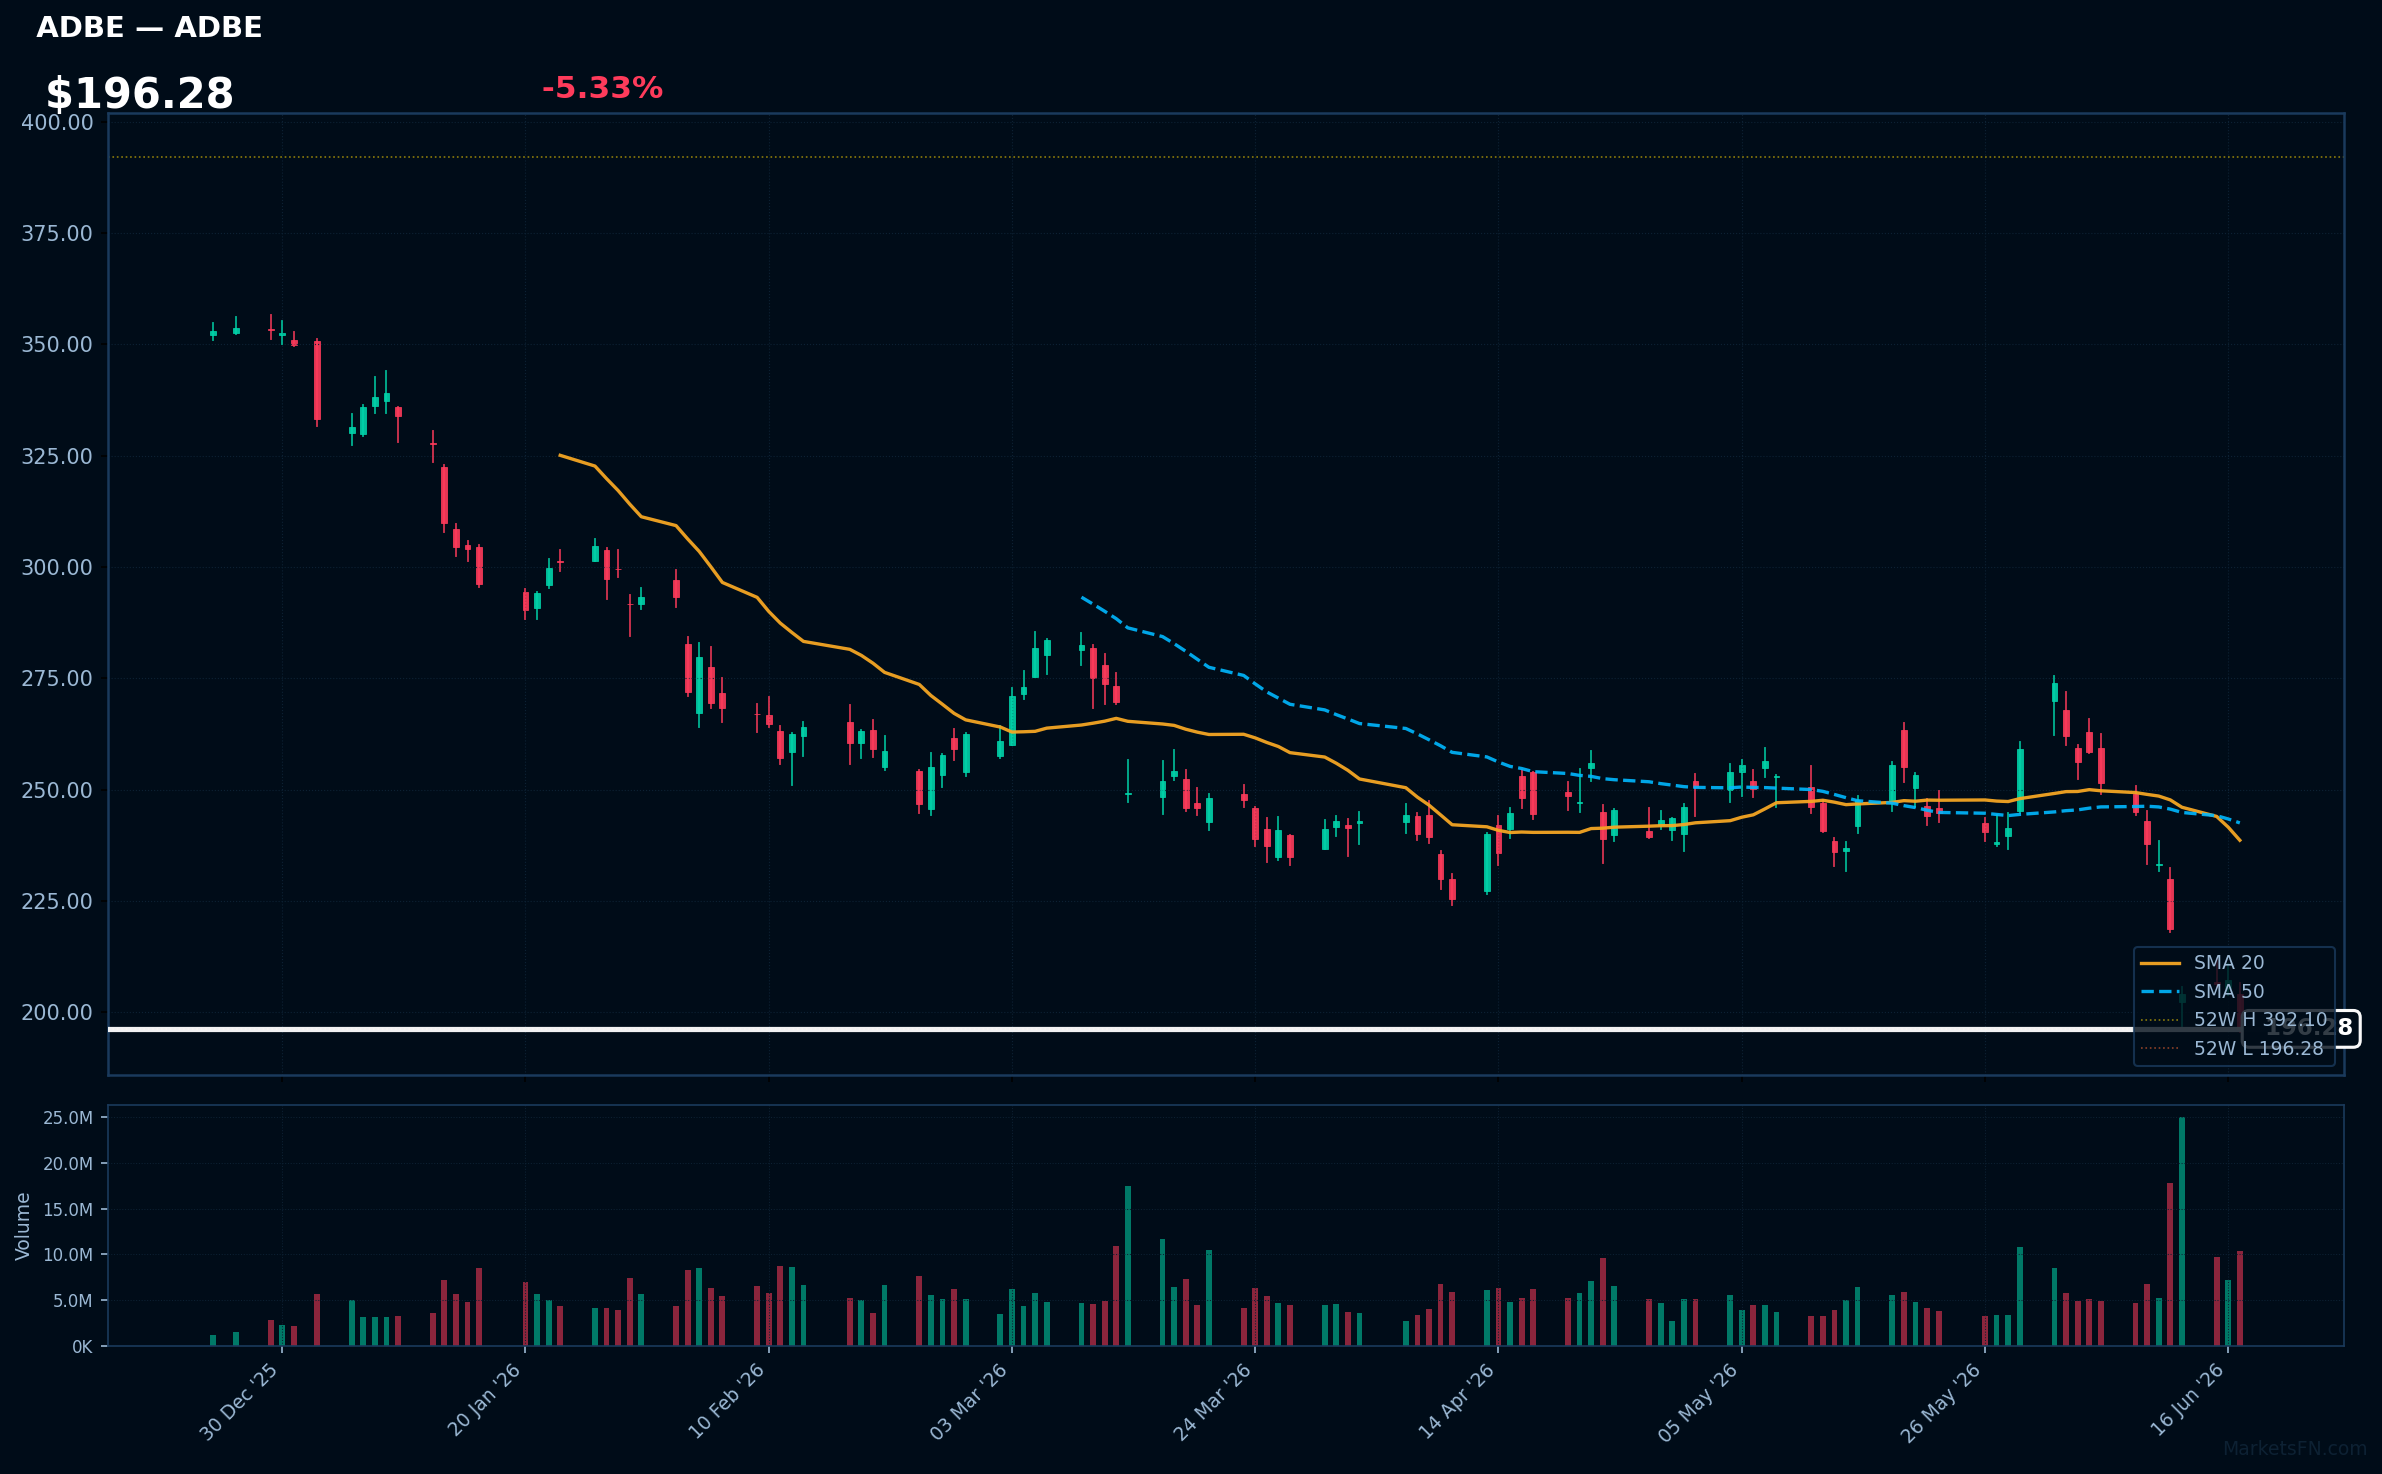
ADBE | Adobe Inc | Technology | Price: $196.28 | Day: -5.33% | 1W: -15.90% | 1M: -23.22% | RSI: 28.1 | vs MA200: -33.7% | Trend: Below MA20, MA50, MA200
Recent headlines (last 12h)
- Wall Street ticks up ahead of first Fed policy decision under Warsh
- Snubbing Nvidia for Adobe Costs Florida Stock-Picker $50 Billion
- Introducing Adobe Brand Visibility: A Unified Solution for the AI Search Era
- Adobe Introduces GenStudio for Commerce Media Networks
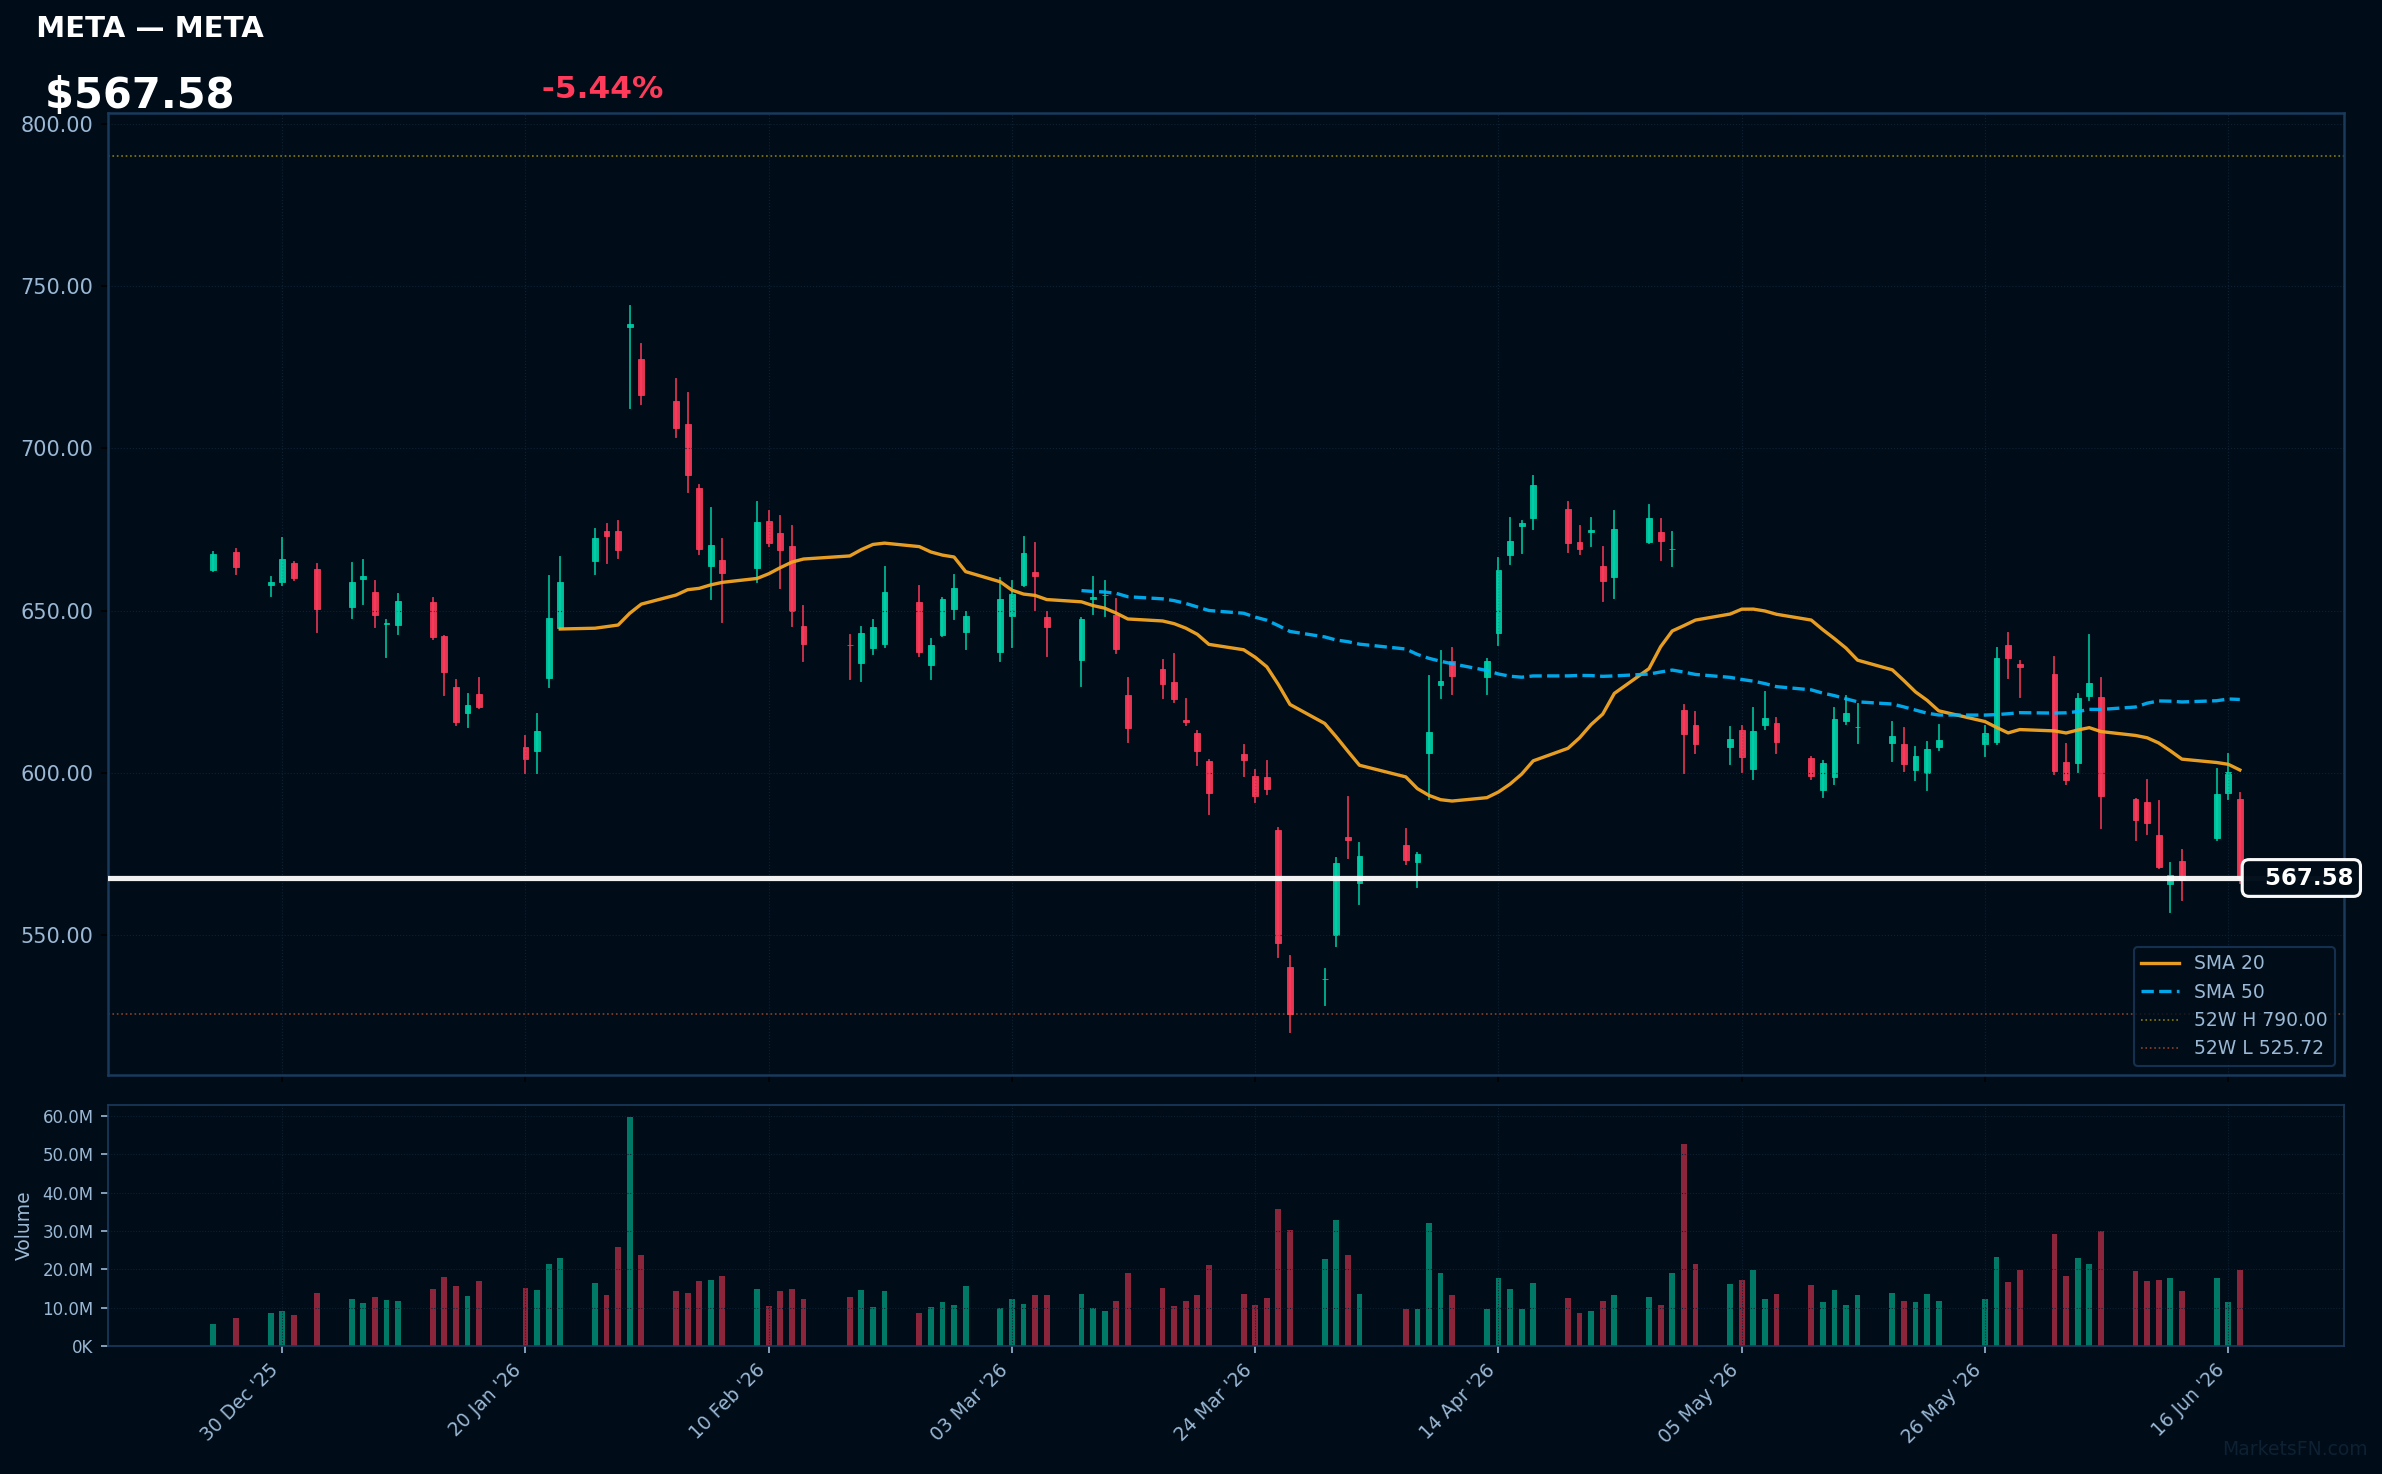
META | Meta Platforms Inc | Communication Services | Price: $567.58 | Day: -5.44% | 1W: -0.60% | 1M: -7.14% | RSI: 39.3 | vs MA200: -13.4% | Trend: Below MA20, MA50, MA200
Recent headlines (last 12h)
- SpaceX Shares Fall for First Time Since Blockbuster Debut
- NEAs Tiffany Luck says enterprises are still figuring out their AI ROI
- Nasdaq, US stocks slide as Fed forecasts possible rate hike
- Threads Hits 500 Million Users as Meta Builds Twitter Rival
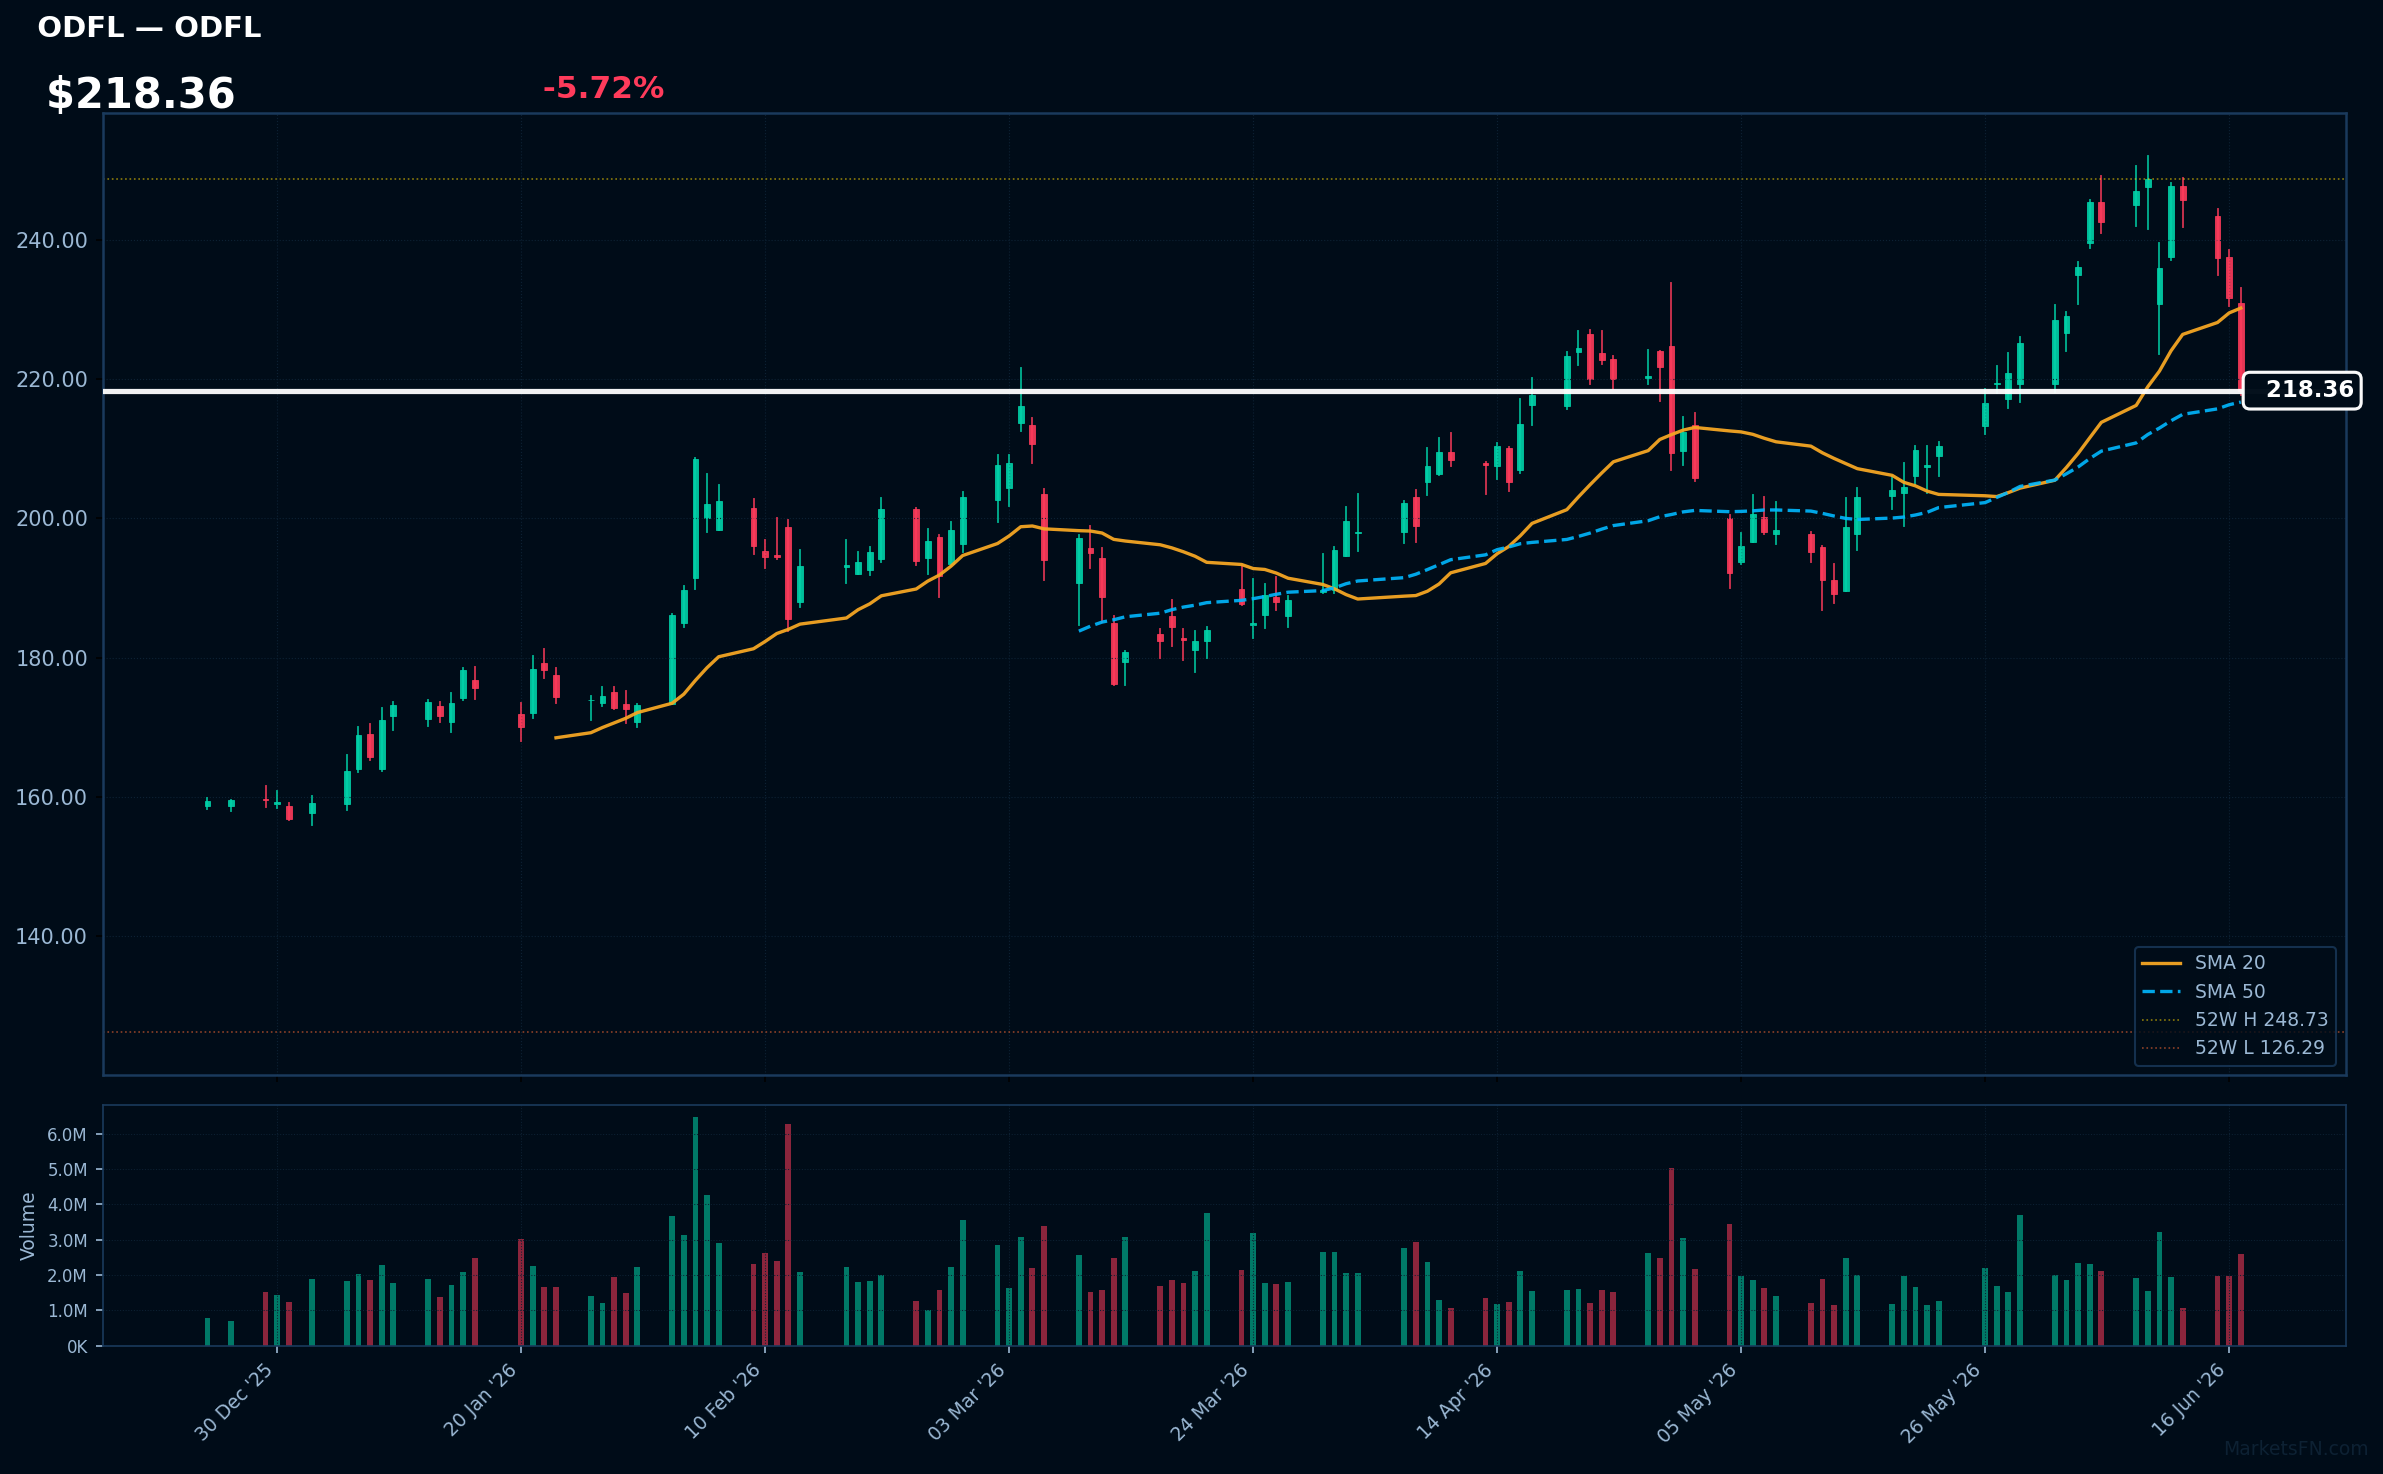
ODFL | Old Dominion Freight Line, Inc | Industrials | Price: $218.36 | Day: -5.72% | 1W: -7.45% | 1M: +6.97% | RSI: 44.6 | vs MA200: +24.0% | Trend: Above MA50, MA200 · Below MA20
Recent headlines (last 12h)
- Old Dominion Freight Line Inc. stock underperforms Wednesday when compared to competitors
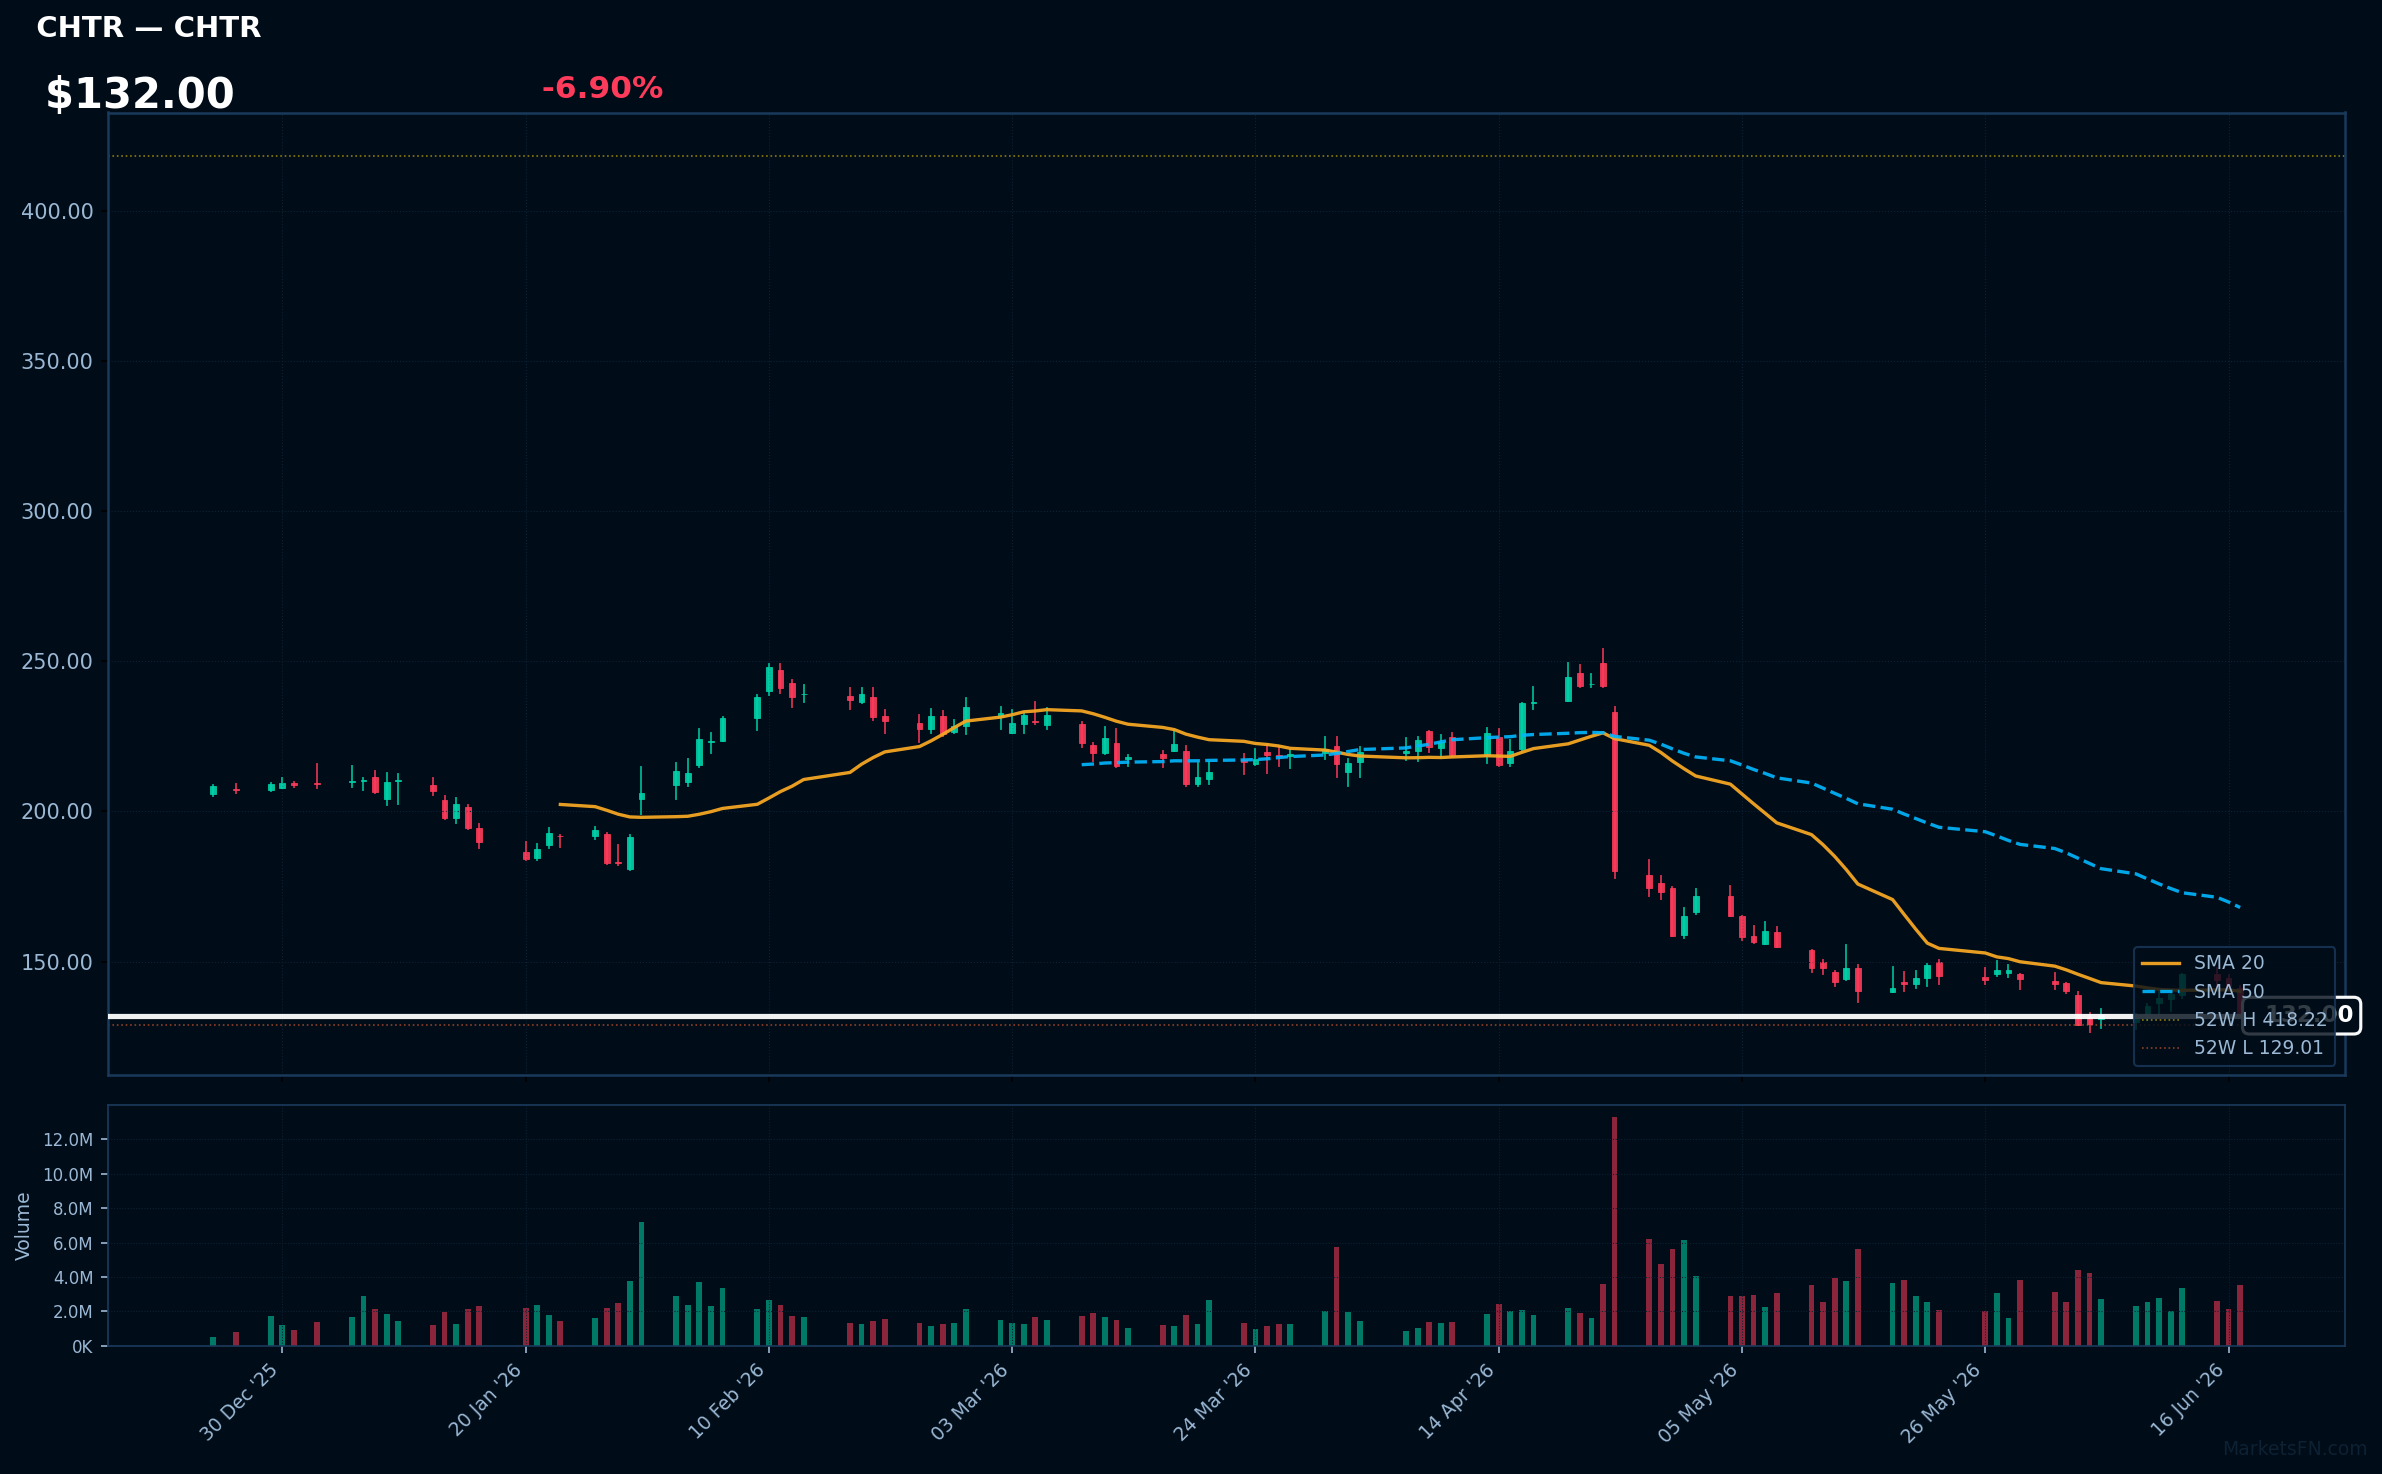
CHTR | Charter Communications Inc | Communication Services | Price: $132.00 | Day: -6.90% | 1W: -4.20% | 1M: -6.52% | RSI: 35.7 | vs MA200: -37.8% | Trend: Below MA20, MA50, MA200
Recent headlines (last 12h)
- Charter Communications Inc. Cl A stock underperforms Wednesday when compared to competitors
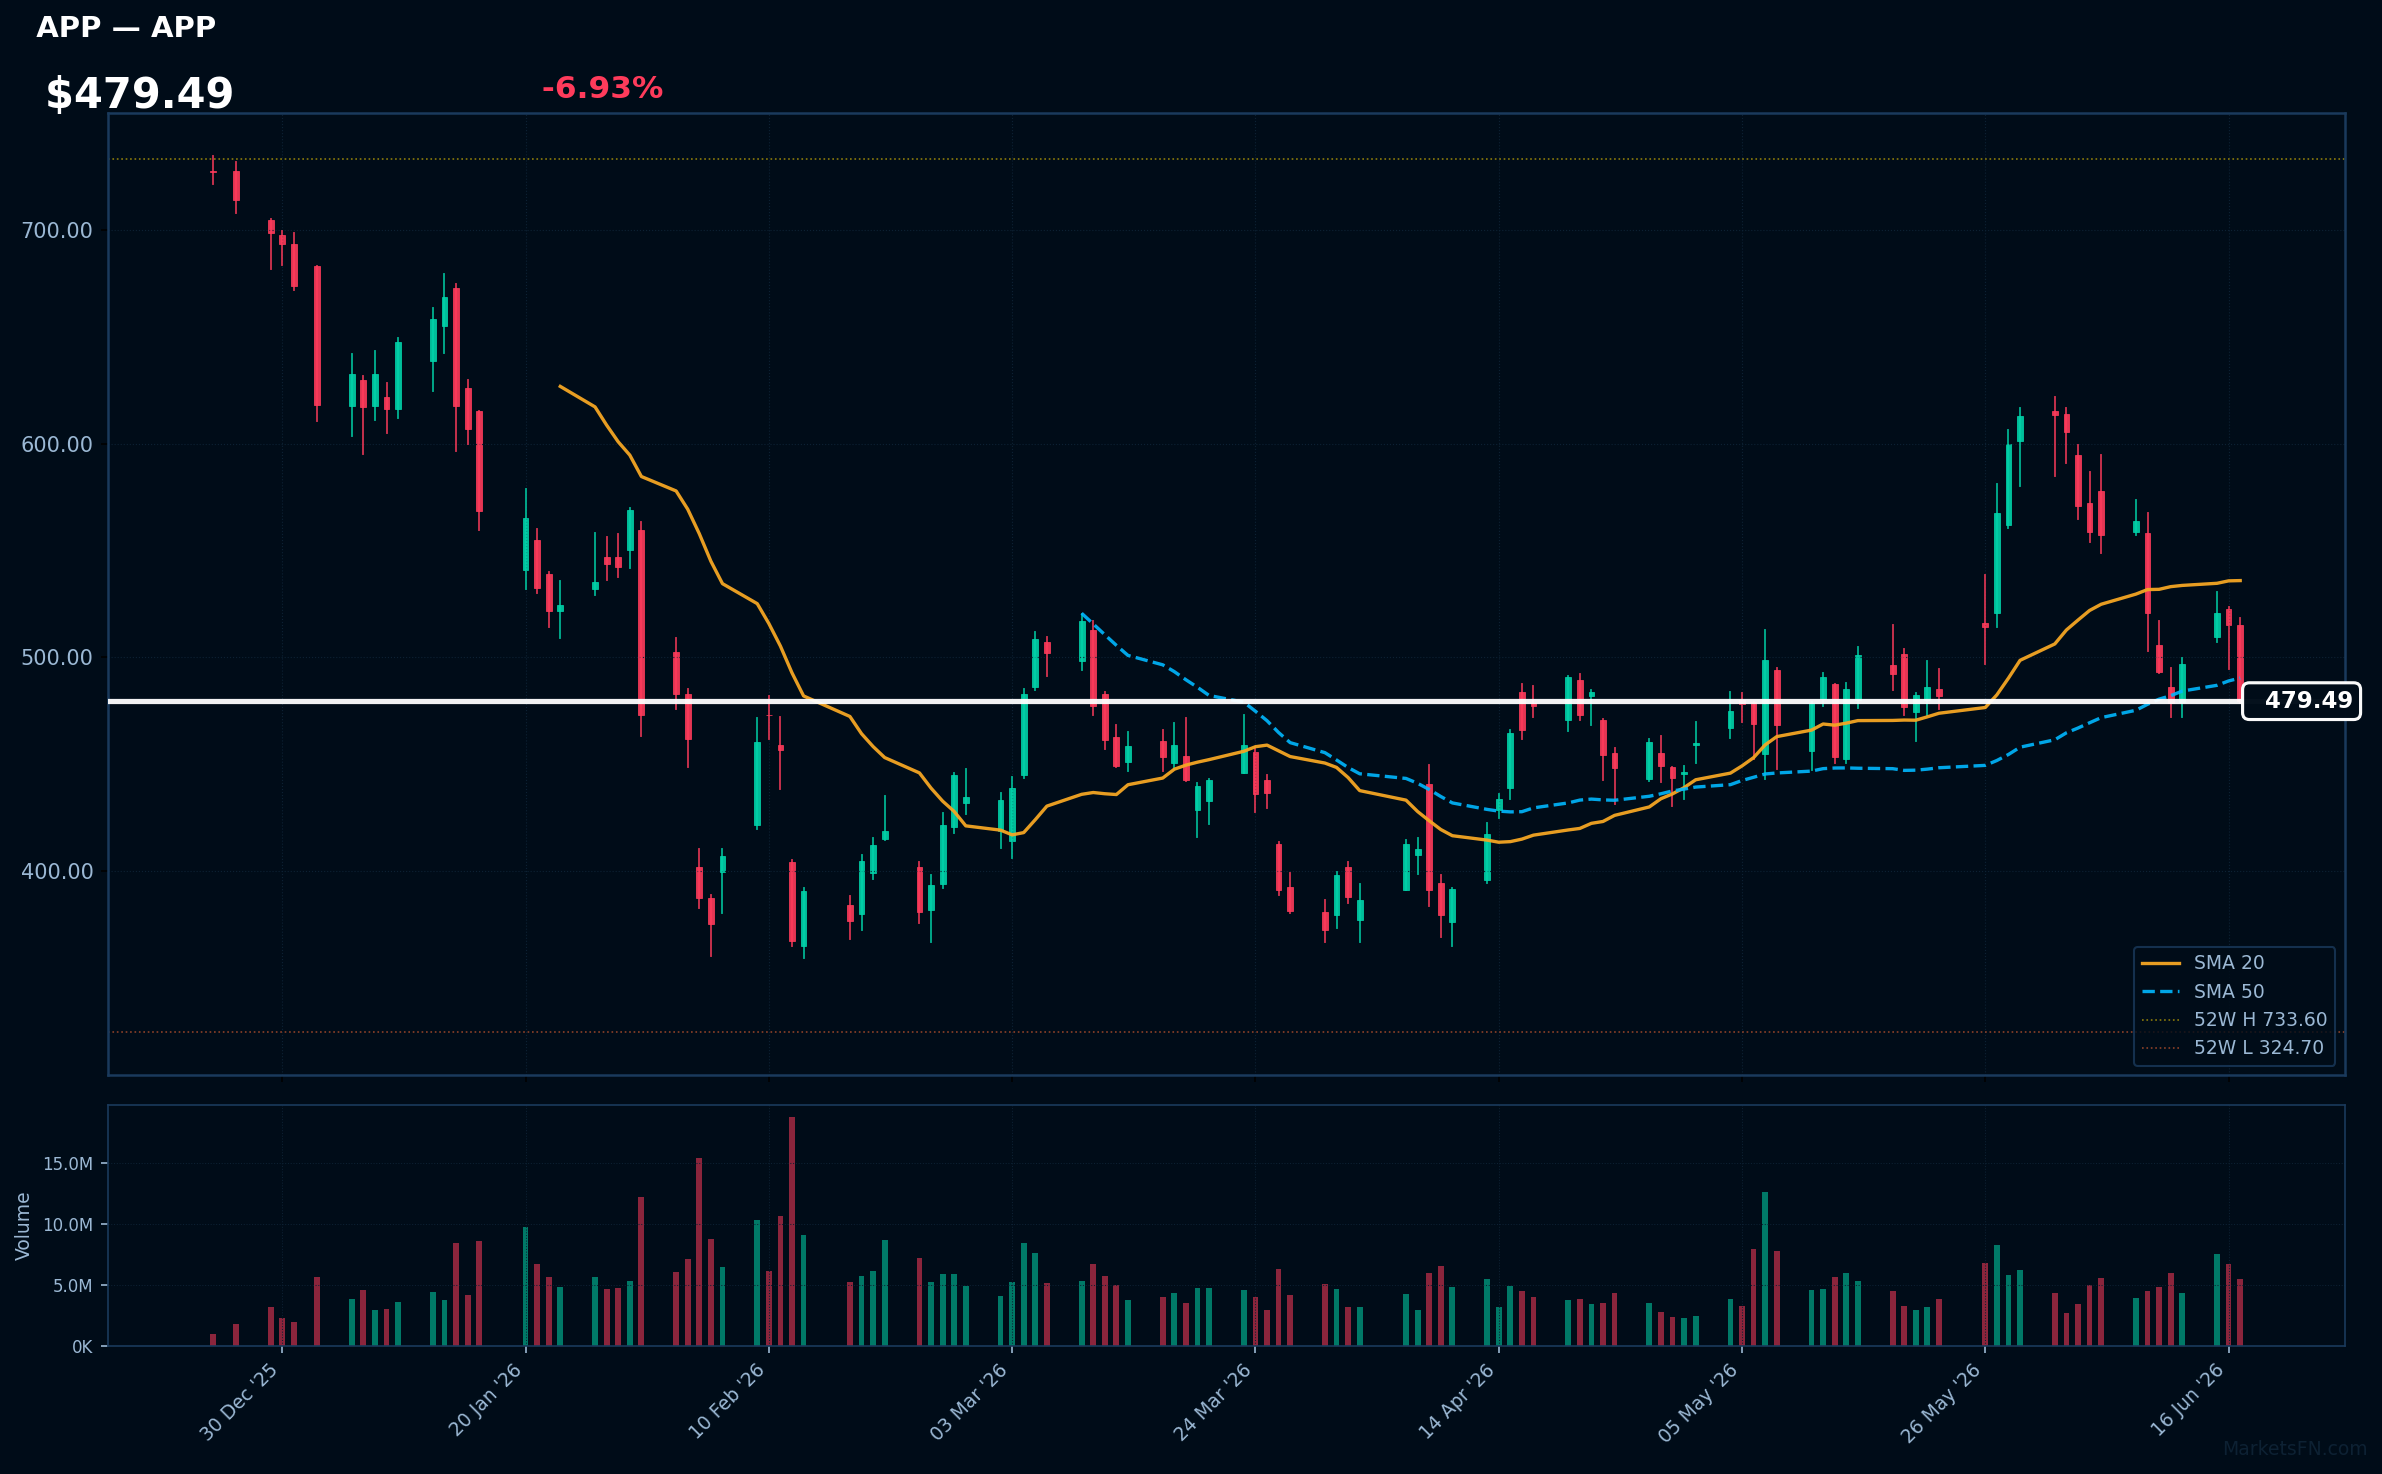
APP | Applovin Corp | Communication Services | Price: $479.49 | Day: -6.93% | 1W: -2.74% | 1M: -2.62% | RSI: 42.7 | vs MA200: -11.6% | Trend: Below MA20, MA50, MA200
Market Commentary
The Nasdaq 100 session on June 17, 2026, was characterized by weak breadth, with decliners outnumbering advancers 83 to 17, or nearly 5:1. This represents a significant 82.2% of constituents in the red, indicating a bearish tone for the session.
The technology sector exhibited a clear rotation, with top gainers like ARM, AMAT, and AVGO leading the way, while technology names like ADBE and MSTR were among the top losers. This divergence suggests that traders are rotating within the sector, favoring certain tech sub-sectors over others. The presence of non-tech names like SHOP and ODFL among the losers also highlights the broader market weakness.
With only 11.9% of stocks above their MA200, the overall trend remains bearish. Traders should watch the average daily change of 1.77% as a key risk level; a sustained move above this level could indicate a shift in sentiment. The performance of key technology bellwethers like ASML and INTC, which were among today's gainers, will also be crucial in determining the sector's near-term direction.
Methodology
Daily ranking uses the latest session close versus the prior close. RSI (14-day EWM), MA20, MA50, and MA200 are computed from 12 months of daily OHLCV data sourced from Yahoo Finance. Charts show the last 120 trading sessions with SMA 20/50, 52-week H/L markers, and volume. Recent news (last 12 h) is sourced from FinViz. Updated every trading day.
Disclaimer
The content on MarketsFN.com is provided for educational and informational purposes only. It does not constitute financial advice, investment recommendations, or trading guidance. All investments involve risks, and past performance does not guarantee future results. You are solely responsible for your investment decisions and should conduct independent research and consult a qualified financial advisor before acting. MarketsFN.com and its authors are not liable for any losses or damages arising from your use of this information.
Related Articles
- The Progressive Corporation (PGR) Rises 0.05% After Earnings — Post Earning Analysis The Progressive Corporation (PGR) Rises 0.05% After Earnings Progressive Corporation's recent…
- La-Z-Boy Incorporated (LZB) Rallies 14.93% After Earnings — Post Earning Analysis La-Z-Boy Incorporated (LZB) Rallies 14.93% After Earnings La-Z-Boy's stock surged by 17%…
- S&P 500 52-Week Highs & Lows Radar: GE Aerospace (GE), Salesforce (CRM) and more — S&P 500 stocks nearest to their 52-week high and low. Bloomberg-style charts, RSI/MA analysis and Grok commentary.
- Progressive Corporation (PGR) Q2 2026 Financial Results Summary — Progressive Corporation (PGR) Q2 2026: Strong Growth Across Metrics — Positive Outlook The Progressive Corporation…
- La-Z-Boy Incorporated (LZB) Q4 2026 Financial Results Summary — La-Z-Boy Incorporated (LZB) Q4 2026: Flat Sales, Strong Margin Improvement — Cautiously Optimistic La-Z-Boy…