Nikkei 225 Holds Steady Amid Tokyo's FOMC Caution and Buyback Support
MarketsFN Team
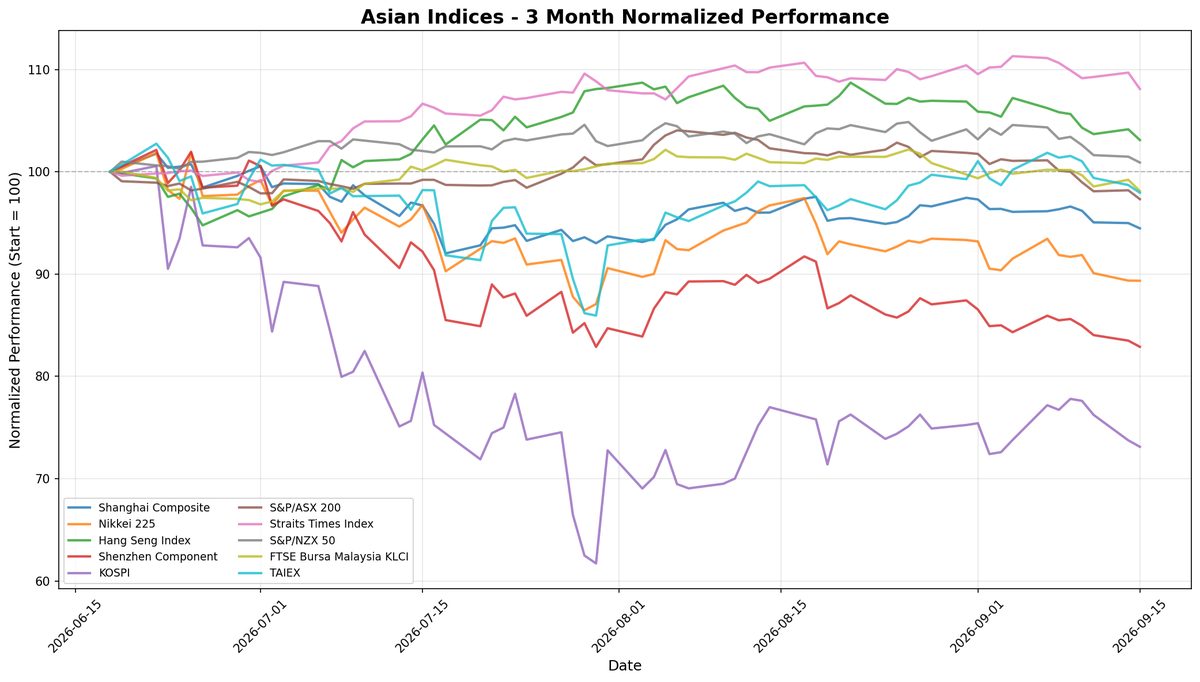
Nikkei 225 Holds Steady Amid Tokyo's FOMC Caution and Buyback Support
Note: This analysis covers the Asian trading session close for September 15, 2026. All times are in US Eastern Time (ET).
📊 Asian Indices Performance
| Index | Price | Daily Change (%) |
|---|---|---|
| Shanghai Composite | 3,864.28 | -0.54% |
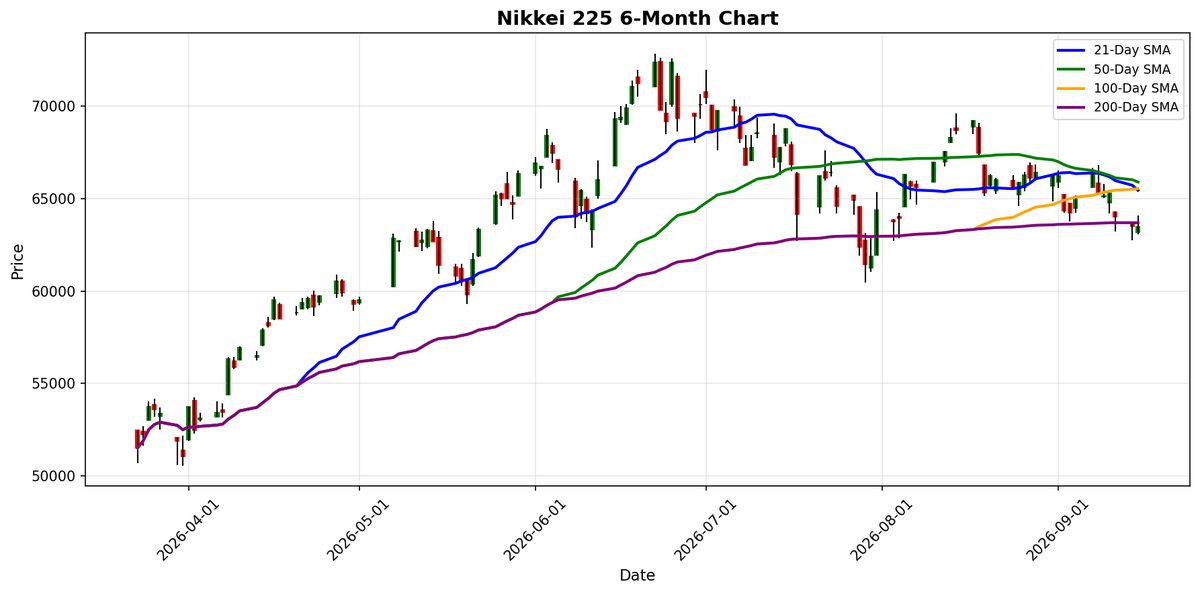
| Nikkei 225 | 63,484.10 | -0.01% |
| Hang Seng Index | 24,667.24 | -1.00% |
| Shenzhen Component | 13,287.97 | -0.72% |
| KOSPI | 6,627.26 | -0.85% |
| S&P/ASX 200 | 8,672.50 | -0.88% |
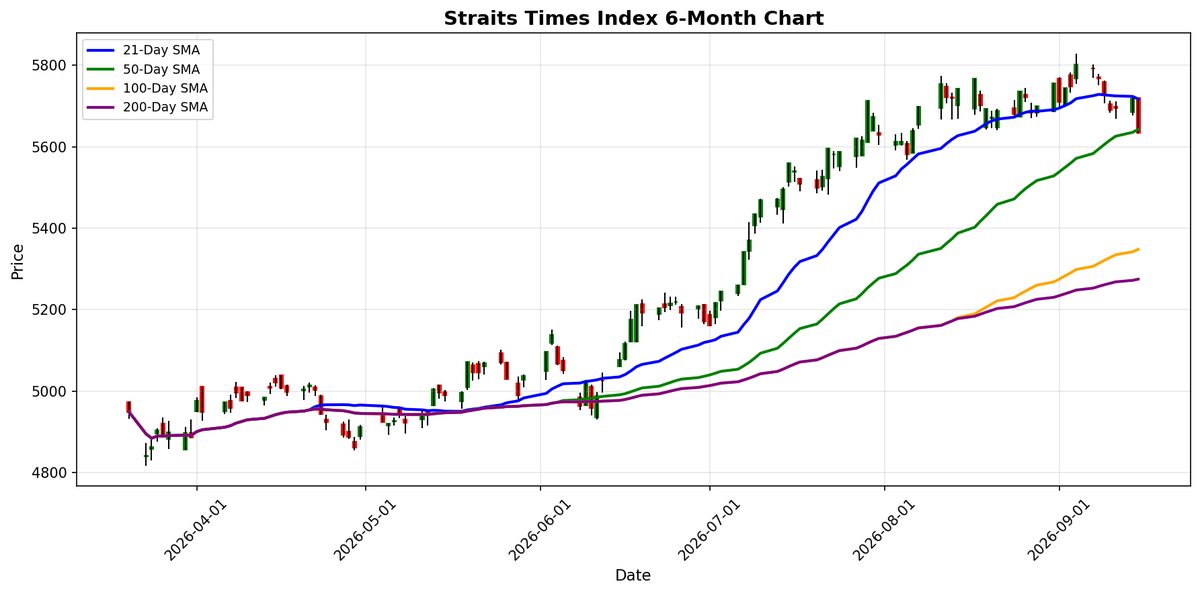
| Straits Times Index | 5,634.93 | -1.45% |
| S&P/NZX 50 | 13,484.22 | -0.56% |
| FTSE Bursa Malaysia KLCI | 1,679.21 | -1.11% |
| TAIEX | 45,511.49 | -0.77% |
📰 Market Commentary
As of September 15, 2026, Asian markets are experiencing a generally negative sentiment, influenced by several key events and regional economic developments. ### Key Events Impacting Asian Indices 1. **Federal Reserve Policy Meeting**: Tokyo stocks have declined as investors adopt a cautious wait-and-see approach ahead of a Federal Open Market Committee (FOMC) meeting. This uncertainty has contributed to a broader sell-off across Asian indices. 2. **China-EU Trade Relations**: In a significant diplomatic move, Chinese Foreign Minister Wang Yi emphasized the need for "constructive dialogue" with the European Union during a high-level call with his French counterpart. This comes amid rising tensions over trade disputes, particularly regarding electric vehicles, which could have implications for market stability and investor confidence. ### Market Sentiment and Price Movements - **Declining Indices**: Most Asian indices are in the red, reflecting a negative market sentiment: - The **Hang Seng Index** fell by 1.00% to 24,667.24. - The **Shanghai Composite** decreased by 0.54% to 3,864.28. - The **KOSPI** dropped by 0.85% to 6,627.26. - The **Nikkei 225** experienced a slight decline of 0.01%, closing at 63,484.10. - Other indices, including the **S&P/ASX 200** and **Straits Times Index**, also reported losses of 0.88% and 1.45%, respectively. ### Regional Economic Developments 1. **Hong Kong Employment Outlook**: A positive development in Hong Kong is the sharp rebound in employers' hiring sentiment, which rose to a net outlook of 14% for the fourth quarter. This marks a significant recovery from a negative outlook in the previous quarter, indicating improved economic confidence. 2. **India's Bond Market**: Indian short-end bonds have faced significant pressure, marking their largest decline in four years. This is attributed to the central bank's decision to sell sovereign notes to drain excess cash from the banking system, which has exacerbated existing concerns over high government borrowing. 3. **China's Economic Weakness**: Recent data indicates a slump in investment within China, raising concerns about the overall health of its economy. This has led to increased pressure on policymakers to consider further stimulus measures to support growth. Overall, the Asian markets on September 15, 2026, are grappling with a mix of geopolitical tensions, domestic economic signals, and investor caution ahead of critical monetary policy decisions. The prevailing sentiment is one of uncertainty, as traders assess the potential impacts of these developments on future market performance.
📅 Economic Calendar - Asian Session
All times are in US Eastern Time (ET)
| Date | Time | Cur | Imp | Event | Actual | Forecast |
|---|---|---|---|---|---|---|
| 2026-09-15 | 19:50 | 🇯🇵 | Medium | Adjusted Trade Balance | -1.00T | |
| 2026-09-15 | 19:50 | 🇯🇵 | Medium | Exports (YoY) (Aug) | 18.2% | |
| 2026-09-15 | 19:50 | 🇯🇵 | Medium | Trade Balance (Aug) | -1,052.6B |
On September 15, 2026, several high-impact economic events from Japan were released, providing key insights for traders focused on Asian markets. 1. **Adjusted Trade Balance (August)** - **Actual:** Data not provided - **Forecast:** -1.00 trillion JPY - **Implications:** If the actual figure significantly deviates from the forecast, it could influence the JPY's strength and impact Japanese equities, especially export-oriented sectors. 2. **Exports (YoY) for August** - **Actual:** Data not provided - **Forecast:** 18.2% - **Implications:** A higher-than-expected export growth rate would signal robust international demand for Japanese goods, potentially boosting market sentiment and supporting the Nikkei index. Conversely, a lower figure could raise concerns about global trade dynamics. 3. **Trade Balance (August)** - **Actual:** -1,052.6 billion JPY - **Forecast:** Not specified - **Implications:** A trade deficit larger than anticipated could weigh on the JPY and negatively affect investor confidence in Japanese stocks, particularly those reliant on foreign trade. **Overall Market Implications:** Traders should closely monitor the actual results of the Adjusted Trade Balance and Exports data as they could lead to volatility in the JPY and influence the direction of Asian indices, particularly in response to changes in trade sentiment. A stronger export performance would likely support a bullish outlook for Japanese equities, while disappointing trade figures could trigger a bearish response.
📈 Index Performance Charts
Best Performer: Nikkei 225
Worst Performer: Straits Times Index
💱 FX, Commodities & Crypto
**Market Summary: FX Pairs, Commodities, and Cryptocurrencies** **Foreign Exchange (FX) Performance:** - **USD/JPY**: The pair is trading at 155.0040, reflecting a daily increase of 0.47%. This movement may be attributed to ongoing interest rate differentials, with the U.S. maintaining a hawkish stance compared to Japan's accommodative monetary policy. - **USD/CNY**: Currently at 6.7120, this pair shows a modest gain of 0.21%. The Chinese yuan's performance is influenced by recent economic data and the People's Bank of China's monetary policy adjustments. - **AUD/USD**: Priced at 0.7127, the Australian dollar has declined by 0.21%. This drop can be linked to weaker commodity prices and concerns over China's economic outlook, which is a significant trading partner for Australia. - **NZD/USD**: At 0.5768, the New Zealand dollar has decreased by 0.16%, reflecting similar pressures as the AUD, particularly from commodity price fluctuations and global economic sentiment. **Commodities Performance:** - **Gold**: Trading at $4,302.90, gold has seen a decline of 1.13%. The drop is likely driven by a stronger U.S. dollar and rising interest rates, which diminish gold's appeal as a non-yielding asset. - **Silver**: Priced at $63.24, silver has also decreased by 0.43%. The metal's performance is closely tied to industrial demand and broader market trends affecting precious metals. - **Crude Oil (WTI)**: Currently at $103.91, crude oil has experienced
Currency Pairs
| Pair | Price | Daily Change (%) |
|---|---|---|
| USD/JPY | 155.00 | +0.47% |
| USD/CNY | 6.71 | +0.21% |
| AUD/USD | 0.71 | -0.21% |
| NZD/USD | 0.58 | -0.16% |
Commodities
| Commodity | Price | Daily Change (%) |
|---|---|---|
| Gold | $4302.90 | -1.13% |
| Silver | $63.24 | -0.43% |
| Crude Oil (WTI) | $103.91 | +2.49% |
Cryptocurrencies
| Asset | Price | Daily Change (%) |
|---|---|---|
| Bitcoin | $76,879 | -1.64% |
| Ethereum | $2,474 | -1.61% |
Disclaimer
The content on MarketsFN.com is provided for educational and informational purposes only. It does not constitute financial advice, investment recommendations, or trading guidance. All investments involve risks, and past performance does not guarantee future results. You are solely responsible for your investment decisions and should conduct independent research and consult a qualified financial advisor before acting. MarketsFN.com and its authors are not liable for any losses or damages arising from your use of this information.