Ripple Eyes Recovery as RSI Nears Oversold at $1.1349
· Crypto · QuoteReporter
Ripple Eyes Recovery as RSI Nears Oversold at $1.1349
Ripple (XRP/USD) | June 22, 2026 $1.1349 +0.93%
🔍 Technical Analysis
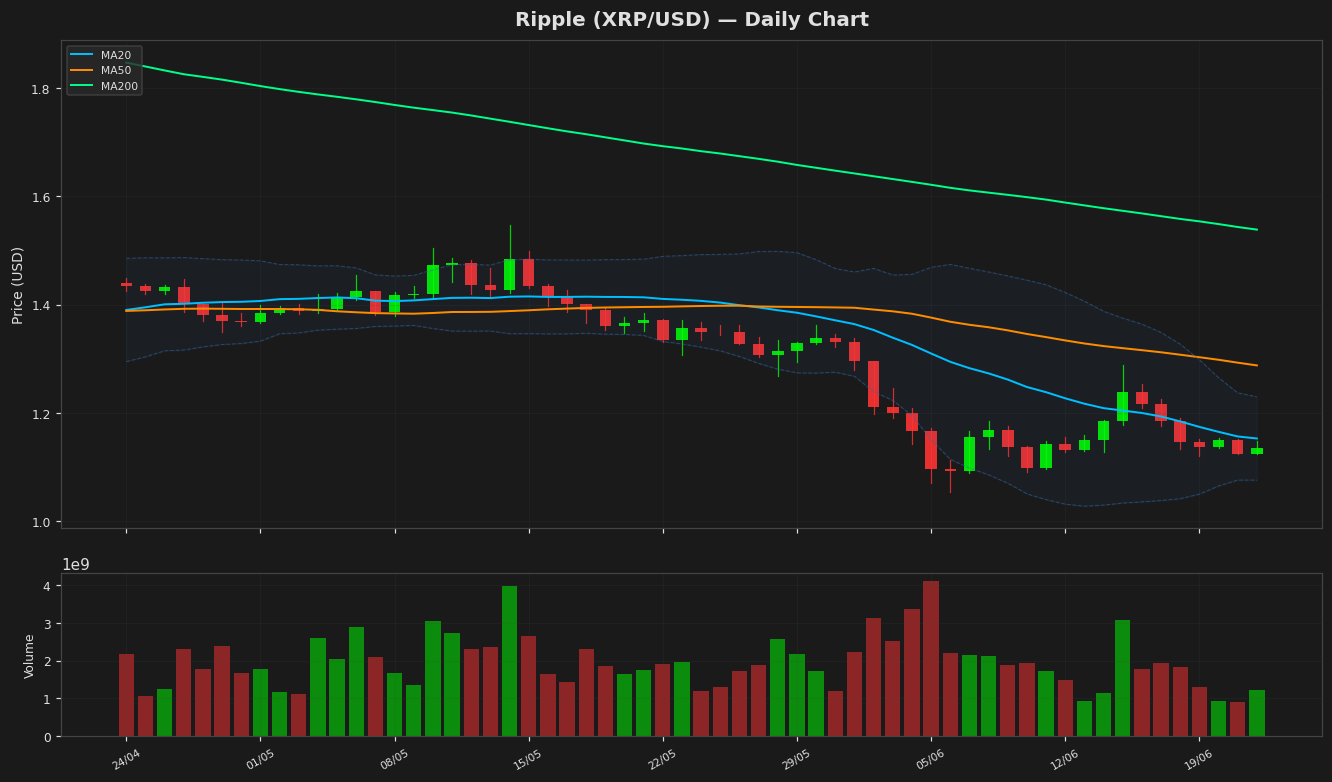
Ripple (XRP) is currently trading at $1.134900, showing a modest daily gain of 0.93%. The price remains below key moving averages, indicating a bearish trend in the medium to long term. The MA20 at $1.152655 and MA50 at $1.287626 are acting as resistance levels, while the MA200 at $1.5385 further reinforces the downtrend. Bollinger Bands show the upper band at $1.229651 and the lower band at $1.07566, with the price hovering near the lower band, suggesting potential oversold conditions. The RSI(14) at 45.626211 is neutral, neither overbought nor oversold, but leaning toward bearish momentum. The MACD histogram at -0.037751 is below the signal line at -0.0423, indicating weak bullish divergence but still reflecting bearish pressure. Key support lies at the 52-week low of $1.05465698, while resistance is seen at the MA20 level of $1.152655 and the upper Bollinger Band at $1.229651. The ATR(14) of 0.045206 suggests low volatility. Given the current technical setup, XRP may consolidate near the lower Bollinger Band unless a breakout above the MA20 occurs. Traders should watch for a potential rebound if the RSI dips into oversold territory or a breakdown if support at $1.05465698 fails.
Technical Metrics
| Metric | Value |
|---|---|
| Current Price | $1.1349 |
| Daily Change | +0.93% |
| MA 20 | $1.1527 |
| % from MA20 | -1.54% |
| MA 50 | $1.2876 |
| % from MA50 | -11.86% |
| MA 200 | $1.5385 |
| % from MA200 | -26.23% |
| BB Upper | $1.2297 |
| % from BB Upper | -7.71% |
| BB Lower | $1.0757 |
| % from BB Lower | +5.51% |
| RSI (14) | 45.63 |
| MACD | -0.037751 |
| MACD Signal | -0.042300 |
| ATR (14) | 0.045206 |
| 3-Day High | $1.1538 |
| 3-Day Low | $1.1233 |
| 52-Week High | $2.6934 |
| % from 52W High | -57.86% |
| 52-Week Low | $1.0547 |
| % from 52W Low | +7.61% |
| YTD High | $2.4103 |
| % from YTD High | -52.91% |
| YTD Low | $1.0547 |
| % from YTD Low | +7.61% |
📊 Market Commentary
Ripple (XRP) is trading at $1.1349, up 0.93% today, as the broader cryptocurrency market shows cautious optimism. The Relative Strength Index (RSI) at 45.6 suggests XRP is neither overbought nor oversold, hovering near neutral territory. This indicates balanced momentum, with traders weighing recent developments against broader market conditions.
Market sentiment around XRP remains mixed, influenced by ongoing legal developments between Ripple Labs and the U.S. Securities and Exchange Commission (SEC). While recent court rulings have provided some clarity, lingering uncertainty continues to temper aggressive positioning. Traders are closely monitoring key support and resistance levels, with immediate support near $1.0547 (the 52-week low) and resistance around the $1.20–$1.30 zone, a level that has historically acted as a pivot point.
Volume trends suggest moderate interest, with neither strong accumulation nor distribution dominating the current price action. The 52-week range of $1.0547 to $2.6934 highlights the volatility XRP has experienced, though recent trading has been relatively subdued compared to earlier in the year.
Traders are also watching Bitcoin’s performance, as XRP often correlates with broader market movements. A decisive break above $1.20 could signal renewed bullish interest, while a drop below $1.05 may invite further downside pressure. For now, XRP appears to be consolidating, with participants awaiting clearer signals from both regulatory and macroeconomic fronts.
Disclaimer
The content on MarketsFN.com is provided for educational and informational purposes only. It does not constitute financial advice or investment recommendations. All investments involve risk. Cryptocurrency markets are highly volatile. Past performance does not guarantee future results.