S&P 500 2026 YTD Highs & Lows Radar: Abbvie (ABBV), Home Depot, (HD) and more
MarketsFN Team

S&P 500 2026 YTD Highs & Lows Radar: Abbvie (ABBV), Home Depot, (HD) and more
Screening all 503 S&P 500 constituents for stocks nearest to their 2026 year-to-date high and their 2026 YTD low. Data as of September 29, 2026. % Realized = total return since Jan 1 2026.
Legend: RSI > 70 = overbought · RSI < 30 = oversold · Green % Realized = positive YTD return · Red = negative.
📈 Nearest to 2026 High
Sectors represented: Healthcare (4), Communication Services (1)
| Ticker | Company | Sector | Price Last | % Realized | 2026 YTD High Date | RSI | % above MA200 | Trend |
|---|---|---|---|---|---|---|---|---|
| ABBV | Abbvie Inc | Healthcare | $266.28 | +16.12% | 2026-09-28 | 63.1 | +15.3% | Above MA20, MA50, MA200 |
| TMO | Thermo Fisher Scientific Inc | Healthcare | $678.60 | +14.53% | 2026-09-28 | 73.9 | +25.4% | Above MA20, MA50, MA200 |
| A | Agilent Technologies Inc | Healthcare | $175.21 | +27.01% | 2026-09-28 | 77.7 | +32.3% | Above MA20, MA50, MA200 |
| WBD | Warner Bros. Discovery Inc | Communication Services | $30.90 | +8.38% | 2026-09-28 | 75.0 | +11.7% | Above MA20, MA50, MA200 |
| MTD | Mettler-Toledo International, Inc | Healthcare | $1545.26 | +9.48% | 2026-09-28 | 73.9 | +17.3% | Above MA20, MA50, MA200 |
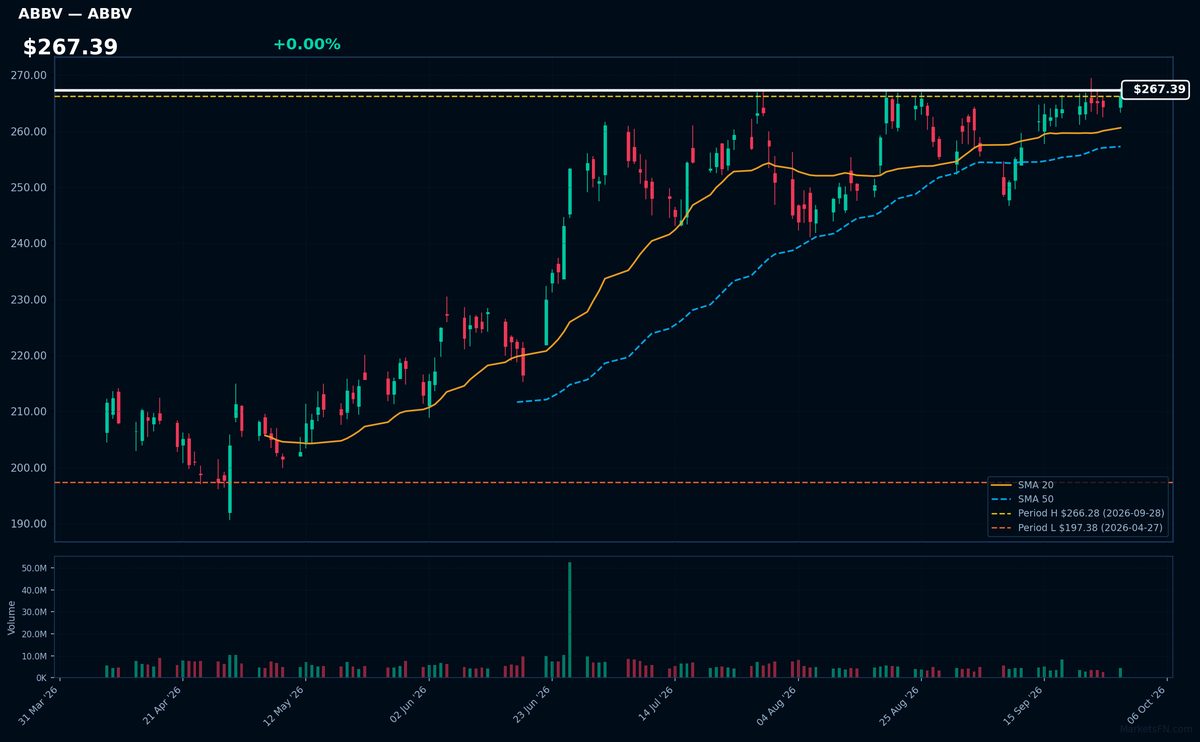
ABBV | Abbvie Inc | Healthcare | Price Last: $266.28 | % Realized: +16.12% | RSI: 63.1 | % above MA200: +15.3% | Trend: Above MA20, MA50, MA200
Abbvie Inc is a biopharmaceutical company that develops and markets therapies for chronic diseases, including immunology and oncology treatments like Humira and Imbruvica, making it a significant player in the healthcare sector.
Abbvie Inc shows a sustained uptrend with price > MA20 > MA50 > MA200, RSI(14) at 63.1, and is 0.0% below its 2026 YTD high, indicating strong momentum with potential for breakout.
Related headlines
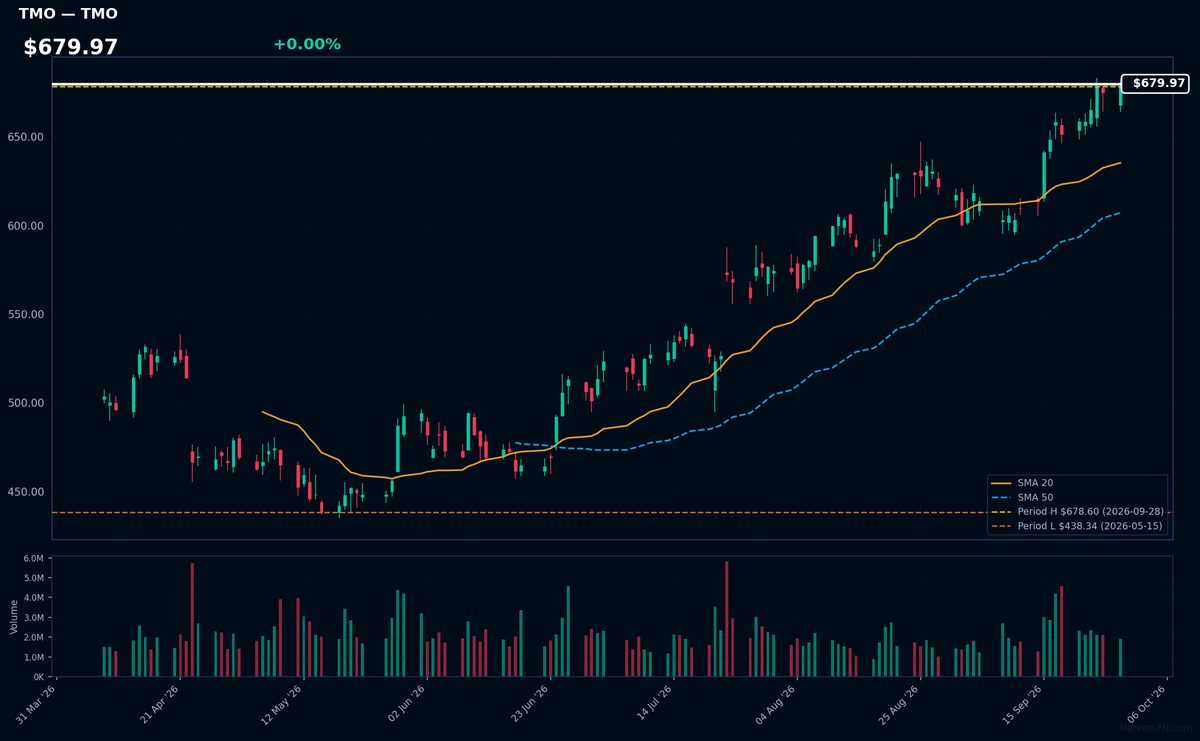
TMO | Thermo Fisher Scientific Inc | Healthcare | Price Last: $678.60 | % Realized: +14.53% | RSI: 73.9 | % above MA200: +25.4% | Trend: Above MA20, MA50, MA200
Thermo Fisher Scientific Inc is a life sciences and laboratory equipment company providing analytical instruments, laboratory equipment, and services to pharmaceutical, biotech, and research institutions, enabling them to advance scientific discovery and product development.
Thermo Fisher's current technical situation indicates strong momentum: RSI(14) is 73.9, nearing overbought territory, with a bullish MA alignment (price > MA20 > MA50 > MA200) and 0.0% below its 2026 YTD high, suggesting potential for a breakout.
Related headlines
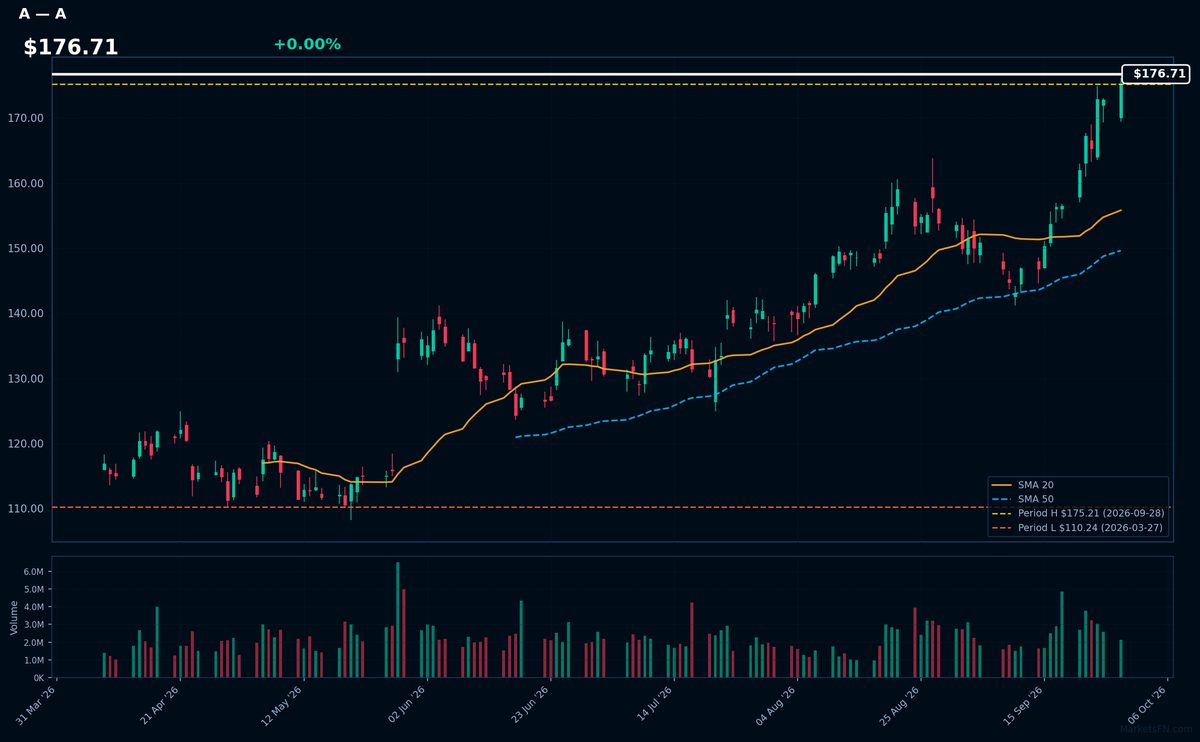
A | Agilent Technologies Inc | Healthcare | Price Last: $175.21 | % Realized: +27.01% | RSI: 77.7 | % above MA200: +32.3% | Trend: Above MA20, MA50, MA200
Agilent Technologies Inc is a life sciences and diagnostics company providing analytical instruments and software for laboratory operations. Investors should care due to its role in advancing biopharmaceutical and clinical research, with potential for growth driven by increasing demand for precision medicine.
Agilent Technologies Inc is in a sustained uptrend with price > MA20 > MA50 > MA200. The RSI(14) is 77.7, nearing overbought territory. The stock is 0.0% below its 2026 YTD high, indicating potential breakout level at the current price of $176.71.
Related headlines
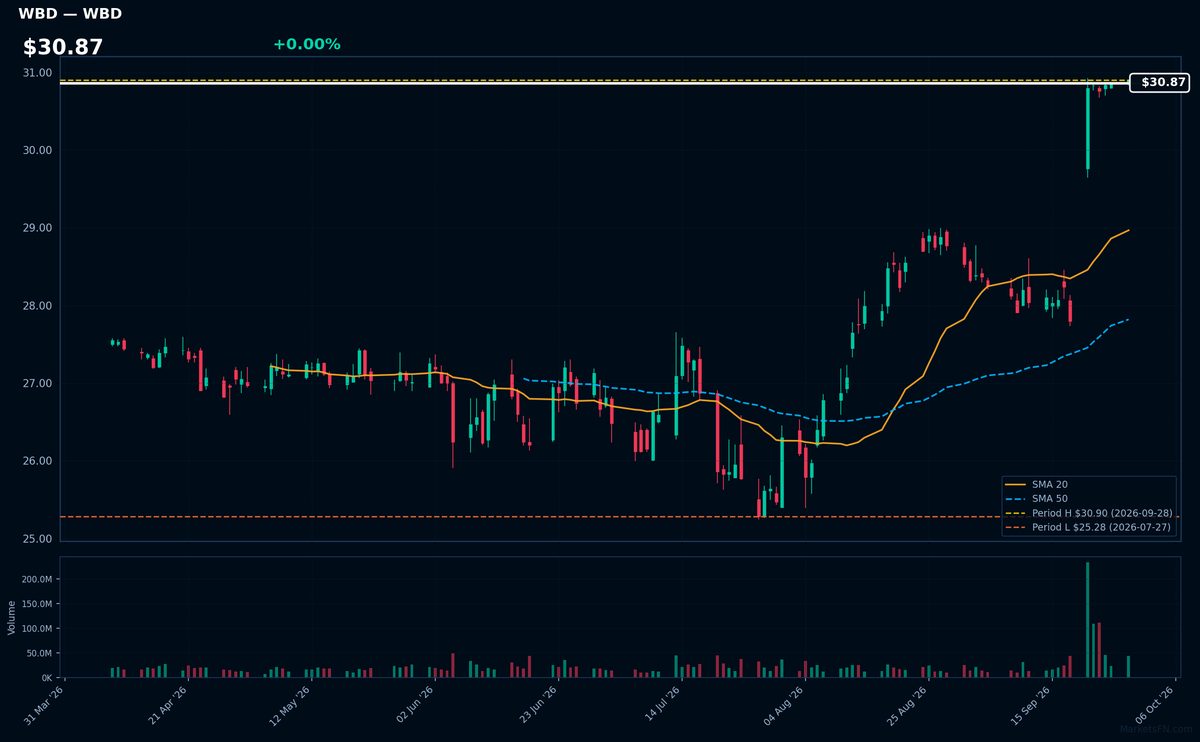
WBD | Warner Bros. Discovery Inc | Communication Services | Price Last: $30.90 | % Realized: +8.38% | RSI: 75.0 | % above MA200: +11.7% | Trend: Above MA20, MA50, MA200
Warner Bros. Discovery Inc is a media conglomerate with a diverse portfolio of entertainment and news assets, including Warner Bros. film studio, HBO, and Discovery Channel, making it a significant player in content creation and distribution.
WBD's RSI(14) is 75.0, indicating strong momentum as it's near overbought territory. The MA alignment (price > MA20 > MA50 > MA200) confirms a sustained uptrend, with the stock at 0.0% below its 2026 YTD high, suggesting a potential breakout.
Related headlines
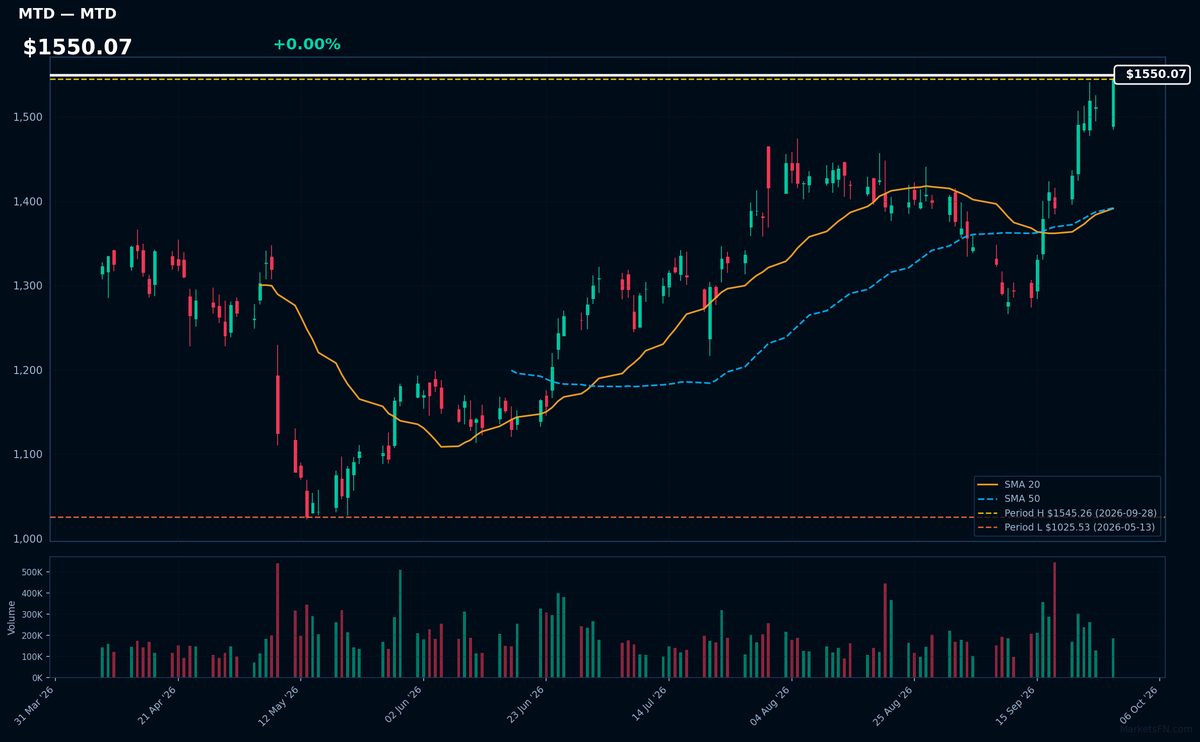
MTD | Mettler-Toledo International, Inc | Healthcare | Price Last: $1545.26 | % Realized: +9.48% | RSI: 73.9 | % above MA200: +17.3% | Trend: Above MA20, MA50, MA200
Mettler-Toledo International, Inc is a global supplier of precision instruments and services, primarily serving laboratory, industrial, and food retailing applications. Investors should care due to its niche leadership and potential for steady demand.
The stock exhibits bullish MA alignment with price > MA20 > MA50 > MA200 and RSI(14) at 73.9, indicating strong momentum; it's near its 2026 YTD high, 0.0% below, suggesting a potential breakout.
Related headlines
📉 Nearest to 2026 Low
Sectors represented: Consumer Cyclical (3), Industrials (1), Utilities (1)
| Ticker | Company | Sector | Price Last | % Realized | 2026 YTD Low Date | RSI | % above MA200 | Trend |
|---|---|---|---|---|---|---|---|---|
| HD | Home Depot, Inc | Consumer Cyclical | $289.89 | -16.17% | 2026-09-28 | 28.9 | -14.8% | Below MA20, MA50, MA200 |
| MCD | McDonald's Corp | Consumer Cyclical | $233.60 | -22.97% | 2026-09-28 | 22.0 | -19.7% | Below MA20, MA50, MA200 |
| BA | Boeing Co | Industrials | $184.39 | -19.05% | 2026-09-28 | 32.2 | -16.5% | Below MA20, MA50, MA200 |
| NEE | NextEra Energy Inc | Utilities | $75.49 | -6.72% | 2026-09-28 | 20.1 | -13.7% | Below MA20, MA50, MA200 |
| LOW | Lowe's Cos., Inc | Consumer Cyclical | $187.66 | -23.99% | 2026-09-28 | 31.0 | -19.3% | Below MA20, MA50, MA200 |
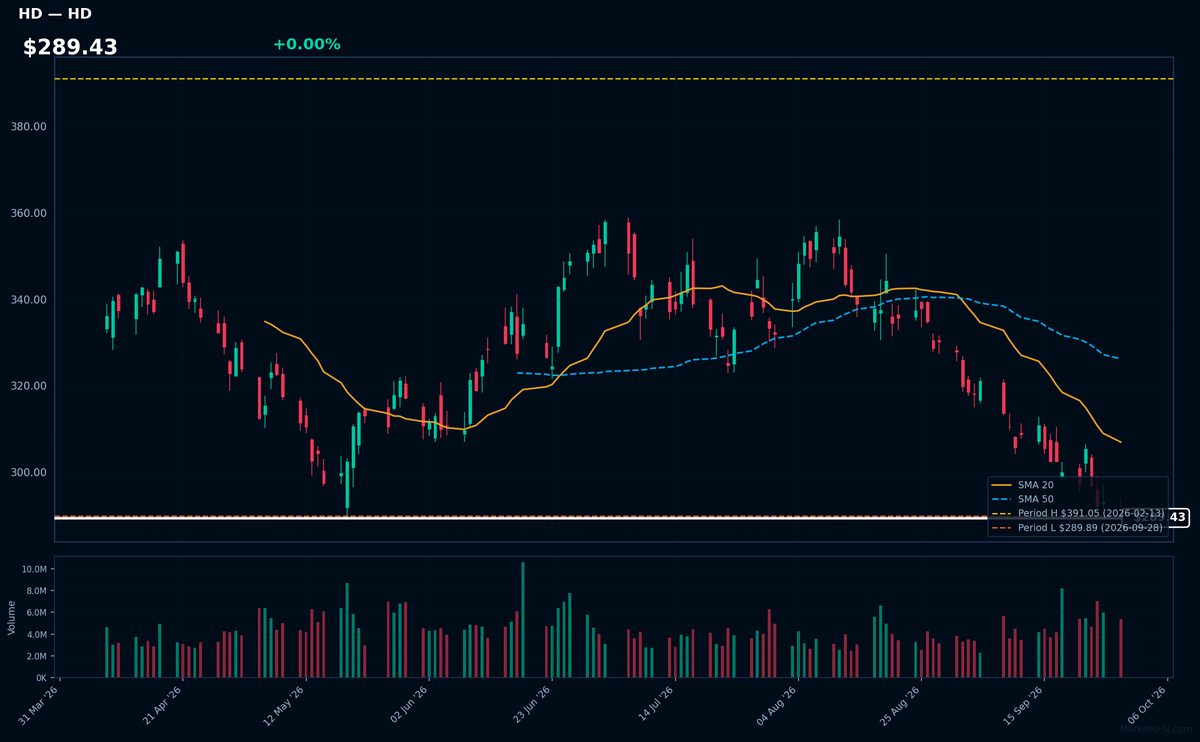
HD | Home Depot, Inc | Consumer Cyclical | Price Last: $289.89 | % Realized: -16.17% | RSI: 28.9 | % above MA200: -14.8% | Trend: Below MA20, MA50, MA200
Home Depot, Inc (HD) operates as a home improvement retailer, selling products such as building materials, tools, and appliances. Investors care about its performance as it reflects housing market trends and consumer spending habits.
HD's technicals indicate a sustained downtrend with price ($289.43) below MA20, MA50, and MA200. RSI(14) at 28.9 suggests oversold conditions, and the stock is testing major support at its 2026 YTD low.
Related headlines
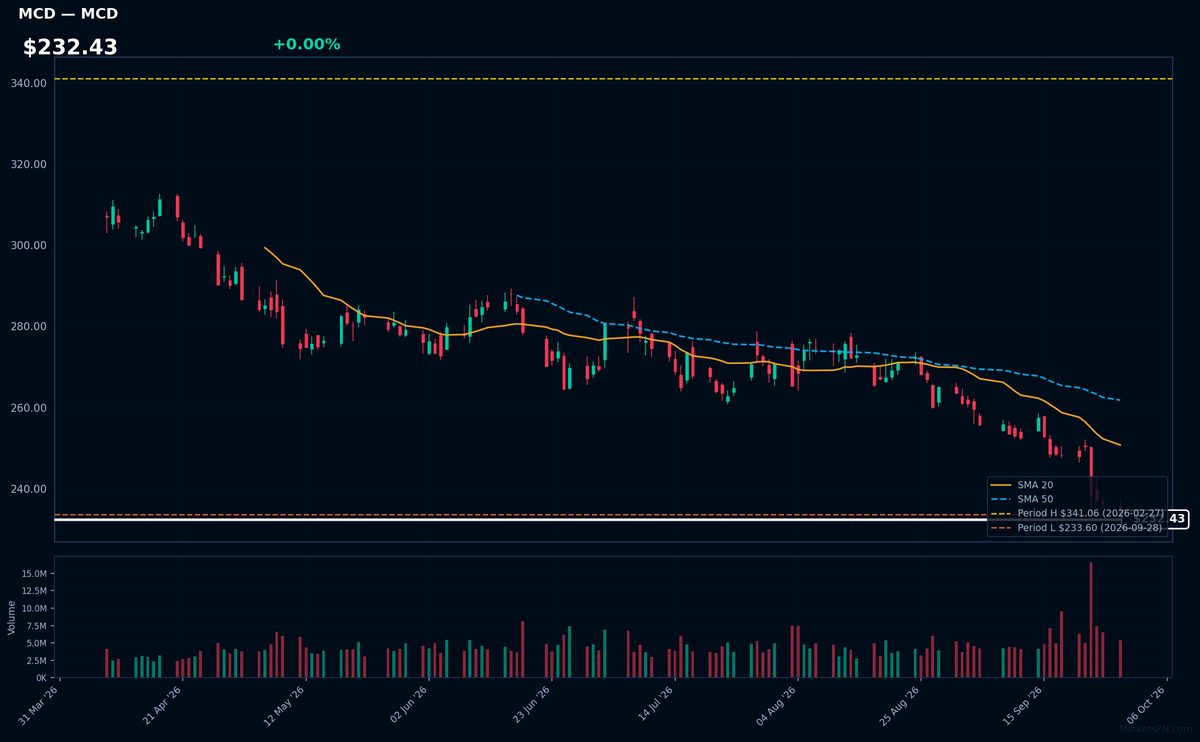
MCD | McDonald's Corp | Consumer Cyclical | Price Last: $233.60 | % Realized: -22.97% | RSI: 22.0 | % above MA200: -19.7% | Trend: Below MA20, MA50, MA200
McDonald's Corp operates a global fast-food chain, serving burgers, fries, and beverages. Investors care about its brand strength, operational efficiency, and market penetration, as these factors influence revenue growth and profitability.
McDonald's Corp is in a sustained downtrend with price ($232.43) below MA20, MA50, and MA200. The RSI(14) is 22.0, near oversold territory, and the stock is testing its 2026 YTD low, a potential warning sign.
Related headlines
- McDonald's is spending $8.5 billion to overhaul its menu for the GLP-1 era and shares dropped 6% on the news
- Inside McDonalds push to have AI price your Big Mac
- McDonald's Stock and 10-Year Bond Yields: Why Are They Near-Perfect Opposites?
- MCD Stock Gets Price Target Cuts From Morgan Stanley, Melius Research A Look At Some Key Street Action Post Investor Day
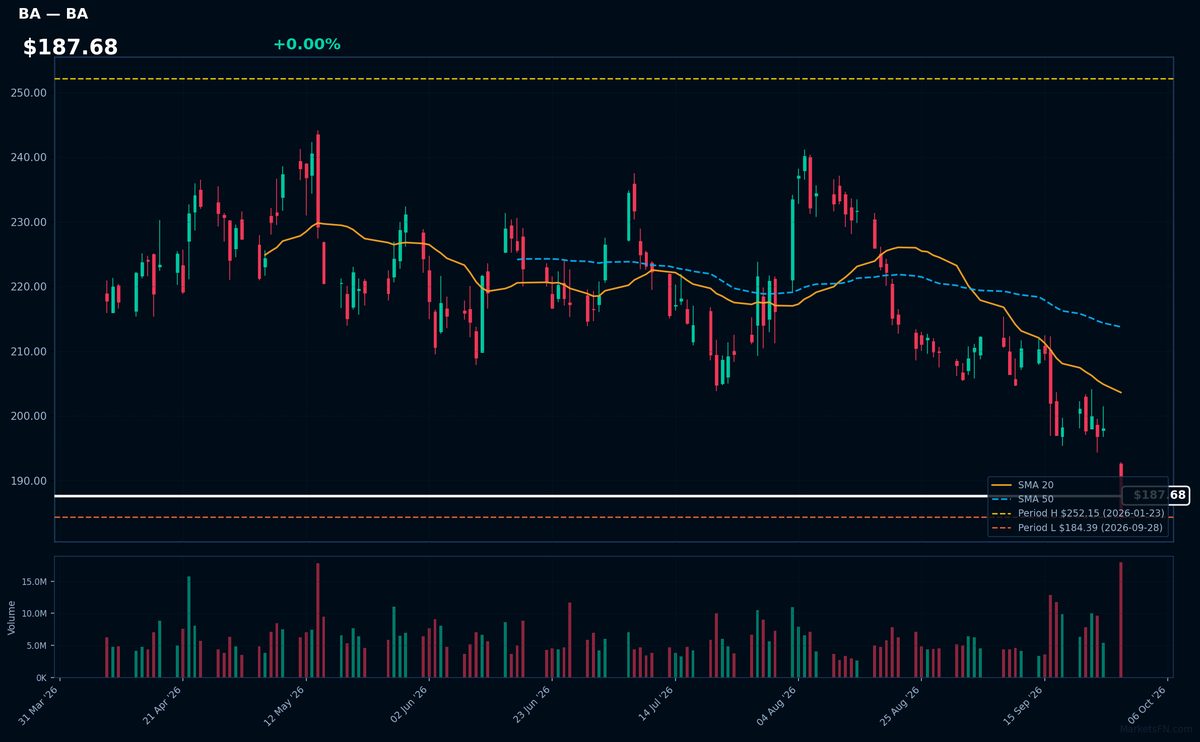
BA | Boeing Co | Industrials | Price Last: $184.39 | % Realized: -19.05% | RSI: 32.2 | % above MA200: -16.5% | Trend: Below MA20, MA50, MA200
Boeing Co is a leading manufacturer of commercial airplanes and defense products. Investors should care about its ability to deliver new aircraft models, manage supply chain disruptions, and navigate regulatory scrutiny, all of which impact its revenue and profitability.
Boeing Co's current technical situation is bearish, with an RSI(14) of 32.2 indicating oversold conditions and a sustained downtrend as price ($187.68) remains below MA20, MA50, and MA200, with the stock testing major support at its 2026 YTD low.
Related headlines
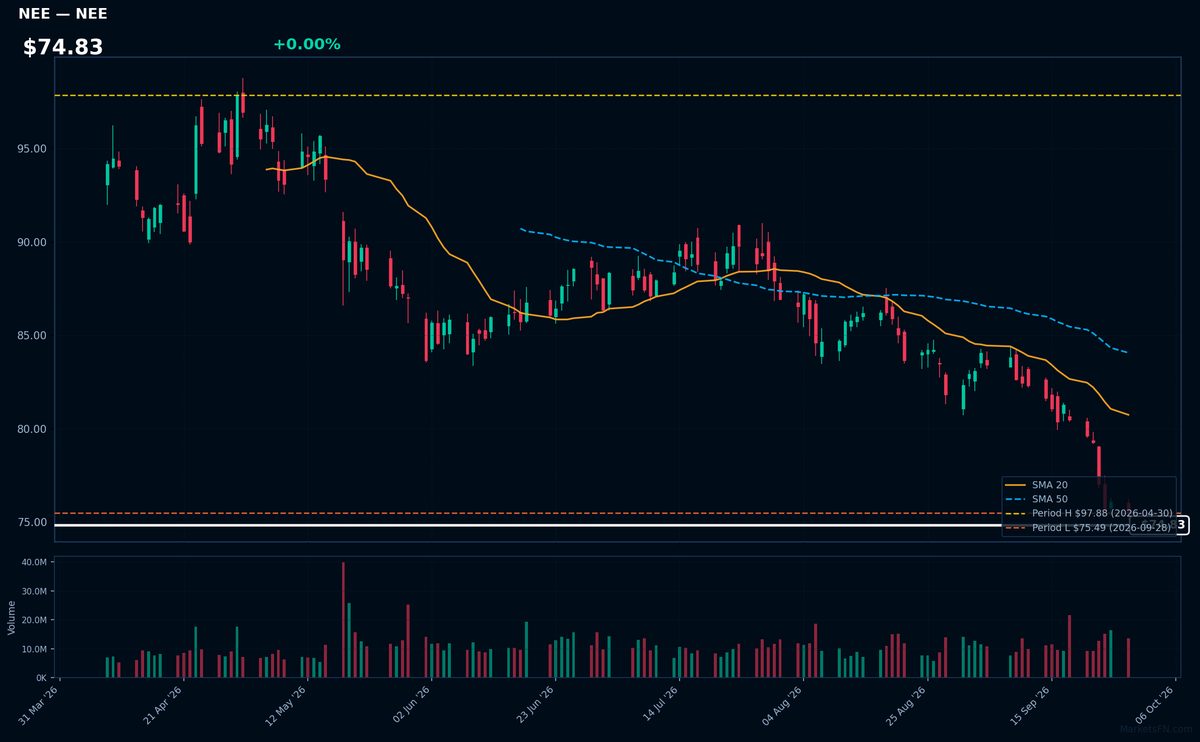
NEE | NextEra Energy Inc | Utilities | Price Last: $75.49 | % Realized: -6.72% | RSI: 20.1 | % above MA200: -13.7% | Trend: Below MA20, MA50, MA200
NextEra Energy Inc is a leading clean energy company generating electricity through wind and solar power, and operates a regulated utility business. Investors care due to its significant role in the energy transition and potential for long-term growth.
NextEra Energy Inc is in a sustained downtrend with price ($74.83) below MA20, MA50, and MA200. The RSI(14) is 20.1, indicating oversold conditions. The stock is testing major support at its 2026 YTD low, having returned -6.7% YTD.
Related headlines
- NextEra Stock Has Fallen 22% From Its High. Is the Selloff a Buying Opportunity?
- NextEra and Dominion Sweeten Merger Deal With Bill Credits and New Jobs
- Dominion, NextEra propose $1 billion-a-year Virginia supplier program
- NextEra Energy, Dominion Energy Propose Expanded State Benefits to Support Merger
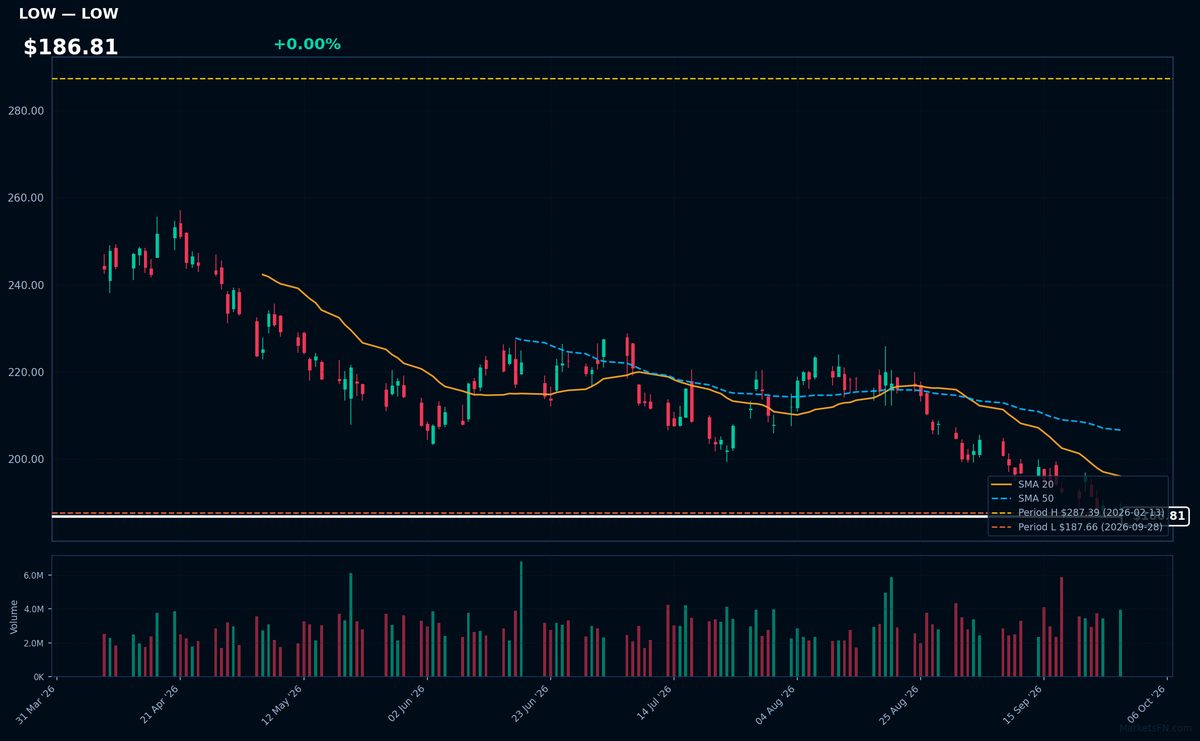
LOW | Lowe's Cos., Inc | Consumer Cyclical | Price Last: $187.66 | % Realized: -23.99% | RSI: 31.0 | % above MA200: -19.3% | Trend: Below MA20, MA50, MA200
Lowe's Cos., Inc is a home improvement retailer operating a chain of stores offering building materials, home decor, and appliances. Investors should care as its performance reflects housing market trends and consumer spending habits.
Lowe's is testing major support with a 31.0 RSI(14) and bearish MA alignment: price ($186.81) < MA20 < MA50 < MA200, indicating a sustained downtrend and potential further decline, with a -24.0% 2026 YTD return.
Related headlines
Market Commentary
The S&P 500 stocks listed are currently trading near their 2026 year-to-date (YTD) extremes. Specifically, stocks like ABBV, TMO, A, WBD, and MTD are at their 2026 YTD highs, while HD, MCD, BA, NEE, and LOW are at their 2026 YTD lows, with the latter group having rebounded by +0.0% from their lows.
The stocks at their YTD highs are from diverse sectors, including healthcare (ABBV, TMO, A, MTD) and media (WBD), indicating strong performance in these areas. Conversely, the stocks at their YTD lows are primarily from the industrials (BA) and consumer staples/retail (HD, MCD, LOW) sectors, as well as utilities (NEE), suggesting challenges in these segments. This divergence may reflect varying market conditions and sector-specific themes.
Investors should monitor the factors driving these extremes, such as earnings reports, industry trends, and macroeconomic indicators. As the year progresses, watching whether these stocks continue to trade near their extremes or move away from them will be crucial in understanding the underlying market dynamics and making informed investment decisions.
Methodology: All 503 S&P 500 constituents screened. Close prices downloaded from 2026-01-01. Period high = highest close since Jan 1 2026; period low = lowest close since Jan 1 2026. Distance = (current price / period extreme − 1) × 100. Technical indicators computed on up to 1 year of daily OHLCV data.
Disclaimer: For informational purposes only. Not investment advice. Past performance is not indicative of future results.