S&P 500 2026 YTD Highs & Lows Radar: Apple (AAPL), International Business Machines (IBM) and more
MarketsFN Team

S&P 500 2026 YTD Highs & Lows Radar: Apple (AAPL), International Business Machines (IBM) and more
Screening all 503 S&P 500 constituents for stocks nearest to their 2026 year-to-date high and their 2026 YTD low. Data as of July 16, 2026. % Realized = total return since Jan 1 2026.
Legend: RSI > 70 = overbought · RSI < 30 = oversold · Green % Realized = positive YTD return · Red = negative.
📈 Nearest to 2026 High
Sectors represented: Financial (4), Technology (1)
| Ticker | Company | Sector | Price Last | % Realized | 2026 YTD High Date | RSI | % above MA200 | Trend |
|---|---|---|---|---|---|---|---|---|
| AAPL | Apple Inc | Technology | $327.50 | +20.84% | 2026-07-15 | 68.5 | +19.6% | Above MA20, MA50, MA200 |
| JPM | JPMorgan Chase & Co | Financial | $346.91 | +6.58% | 2026-07-15 | 62.8 | +12.0% | Above MA20, MA50, MA200 |
| BAC | Bank Of America Corp | Financial | $61.59 | +10.08% | 2026-07-15 | 70.8 | +16.3% | Above MA20, MA50, MA200 |
| MS | Morgan Stanley | Financial | $228.55 | +25.65% | 2026-07-15 | 56.6 | +26.0% | Above MA20, MA50, MA200 |
| GS | Goldman Sachs Group, Inc | Financial | $1152.07 | +26.00% | 2026-07-15 | 62.9 | +27.7% | Above MA20, MA50, MA200 |
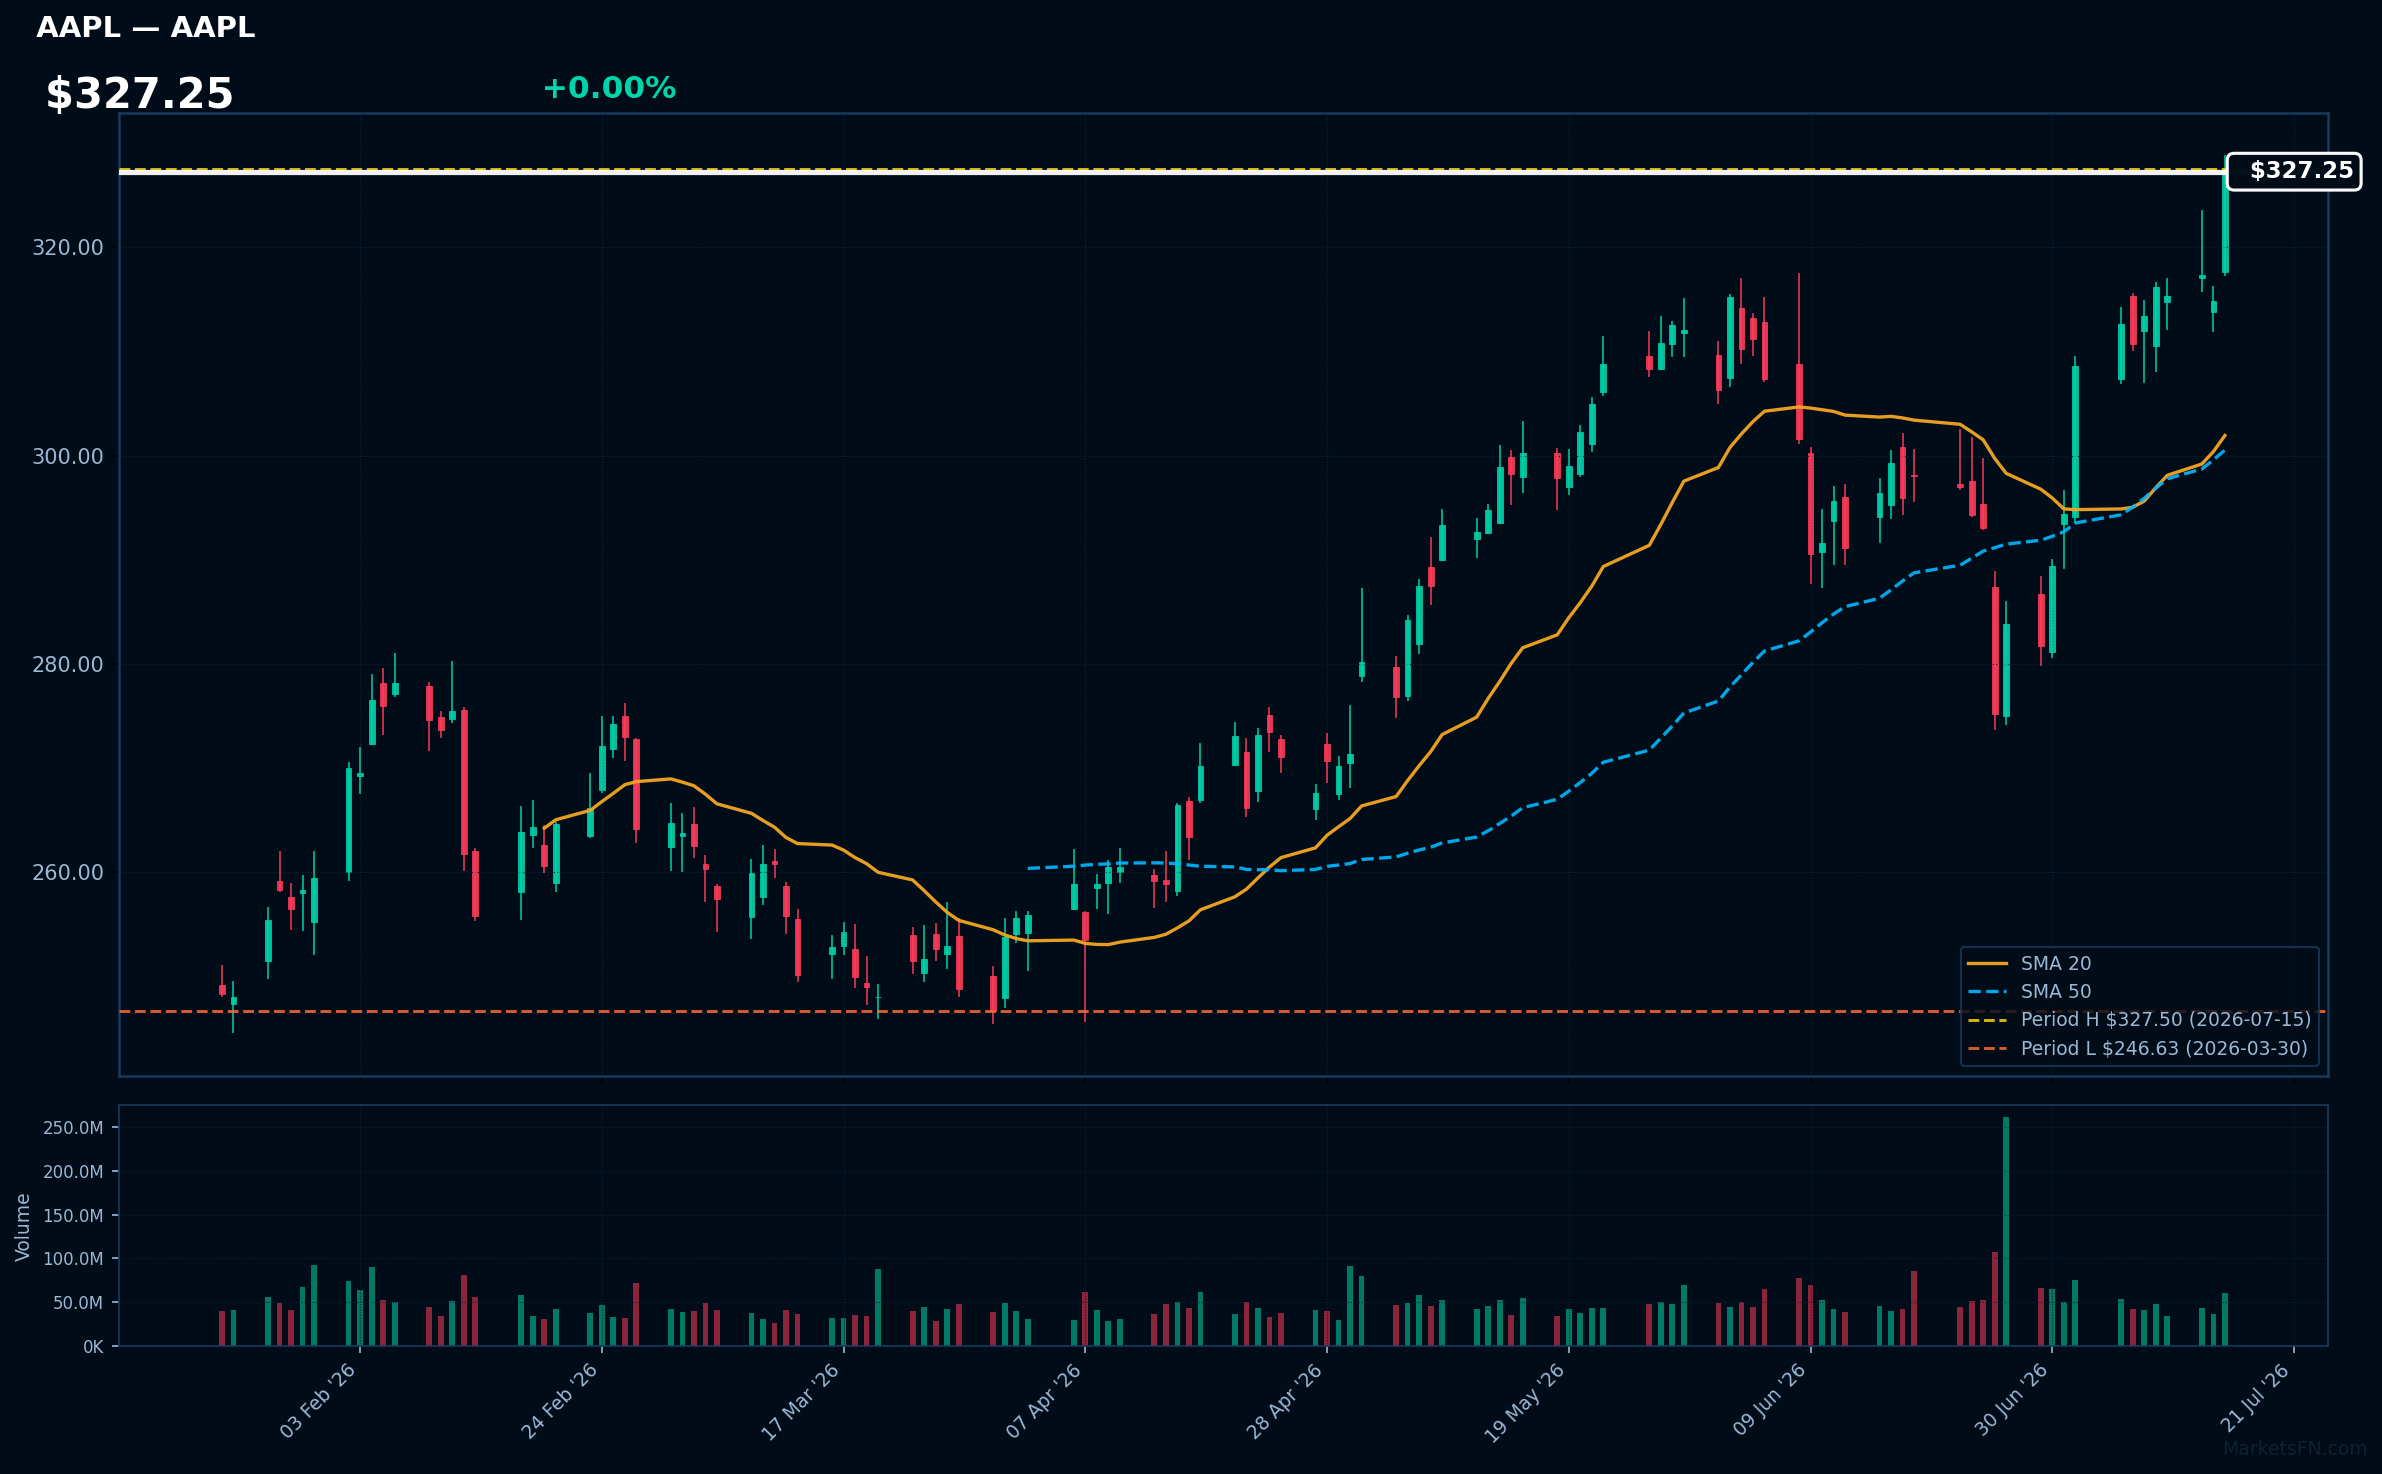
AAPL | Apple Inc | Technology | Price Last: $327.50 | % Realized: +20.84% | RSI: 68.5 | % above MA200: +19.6% | Trend: Above MA20, MA50, MA200
Apple Inc designs, manufactures, and markets consumer electronics, software, and services. Investors care about its innovative product ecosystem, services growth, and profitability. Its flagship products like iPhones drive revenue, while services like Apple Music and iCloud provide recurring income.
AAPL's RSI(14) is 68.5, indicating rising momentum. The MA alignment is bullish with price > MA20 > MA50 > MA200, showing a sustained uptrend. The stock is 0.0% below its 2026 YTD high, near a potential breakout level, with a 20.8% 2026 YTD return.
Related headlines
- Apple Intelligence approved for launch in China with Alibaba and Baidu
- AAPL's China Memory Chip Plans Draw National Security Scrutiny Lawmakers Say Every Memory Chip Purchase Will Subsidize PLA
- AI Weekly: SK Hynix shares jump up and down, Apple sues OpenAI
- These Chinese Tech Stocks Are on the Rise. Thank Apple and Its AI.
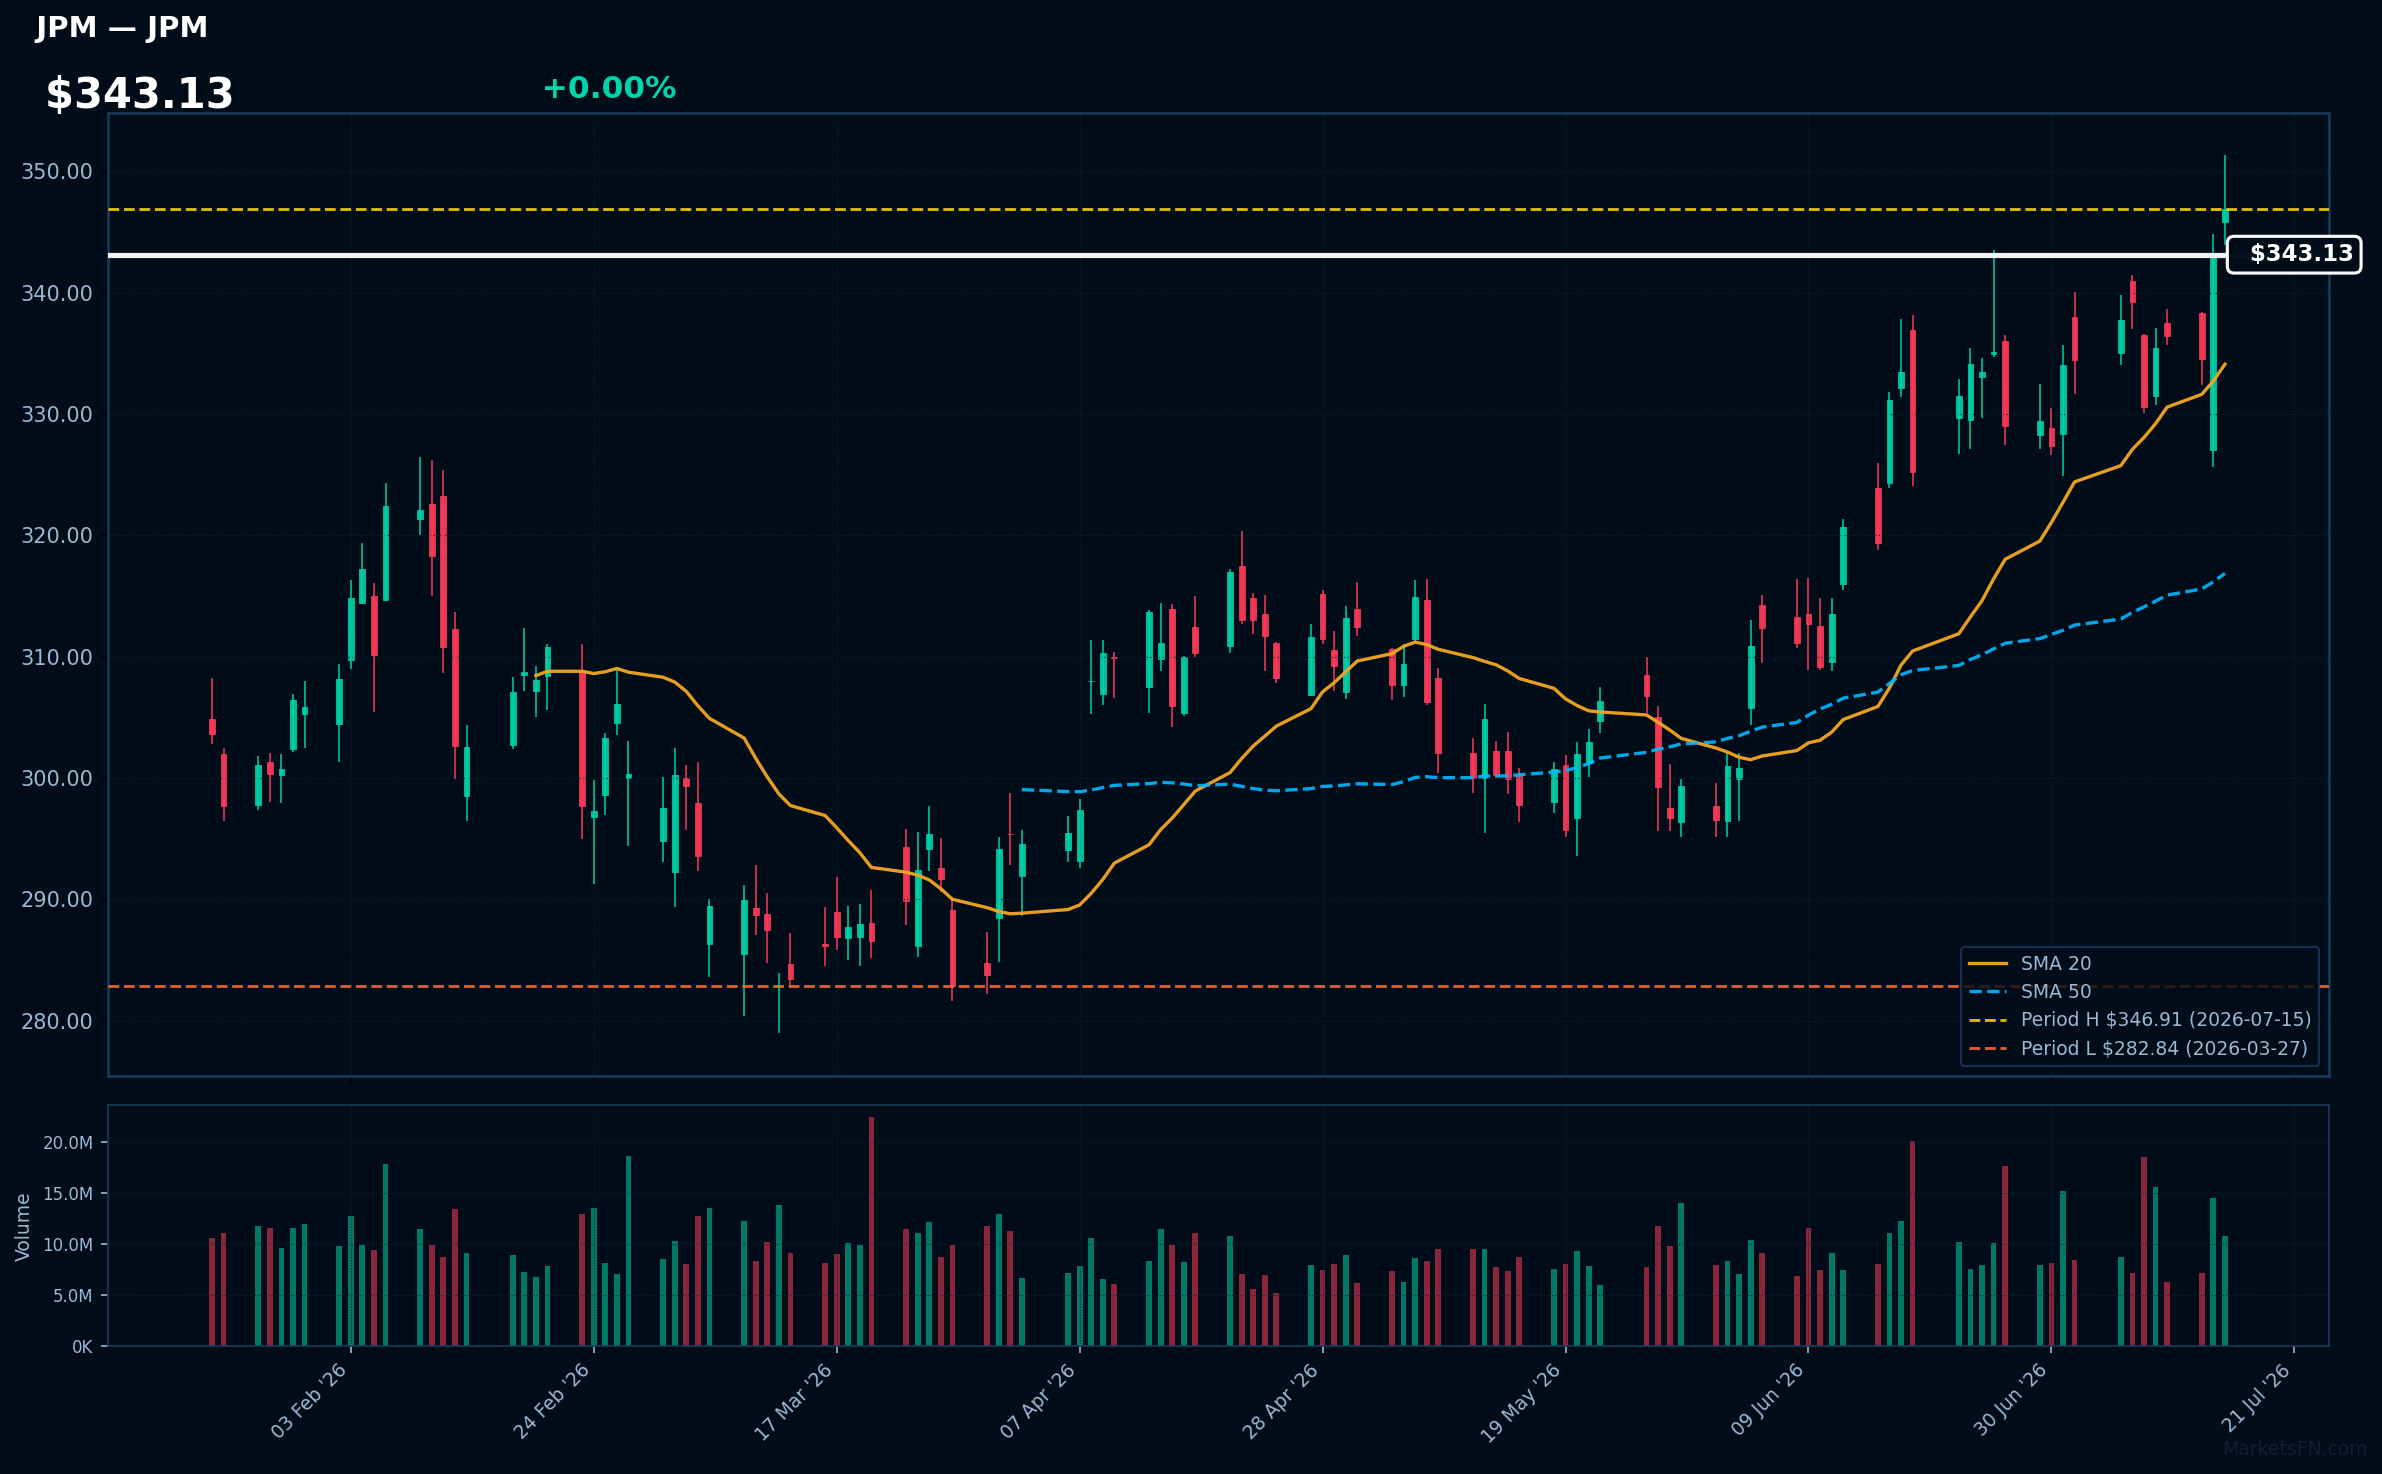
JPM | JPMorgan Chase & Co | Financial | Price Last: $346.91 | % Realized: +6.58% | RSI: 62.8 | % above MA200: +12.0% | Trend: Above MA20, MA50, MA200
JPMorgan Chase & Co is a global financial services firm providing consumer and investment banking, financial transactions processing, asset management, and more. Investors care due to its systemic importance and exposure to global economic trends.
JPMorgan Chase & Co is in a sustained uptrend with price at $343.13, RSI(14) at 62.8, and MA alignment: price > MA20 > MA50 > MA200. It's near its 2026 YTD high, 0.0% below, indicating potential breakout momentum.
Related headlines
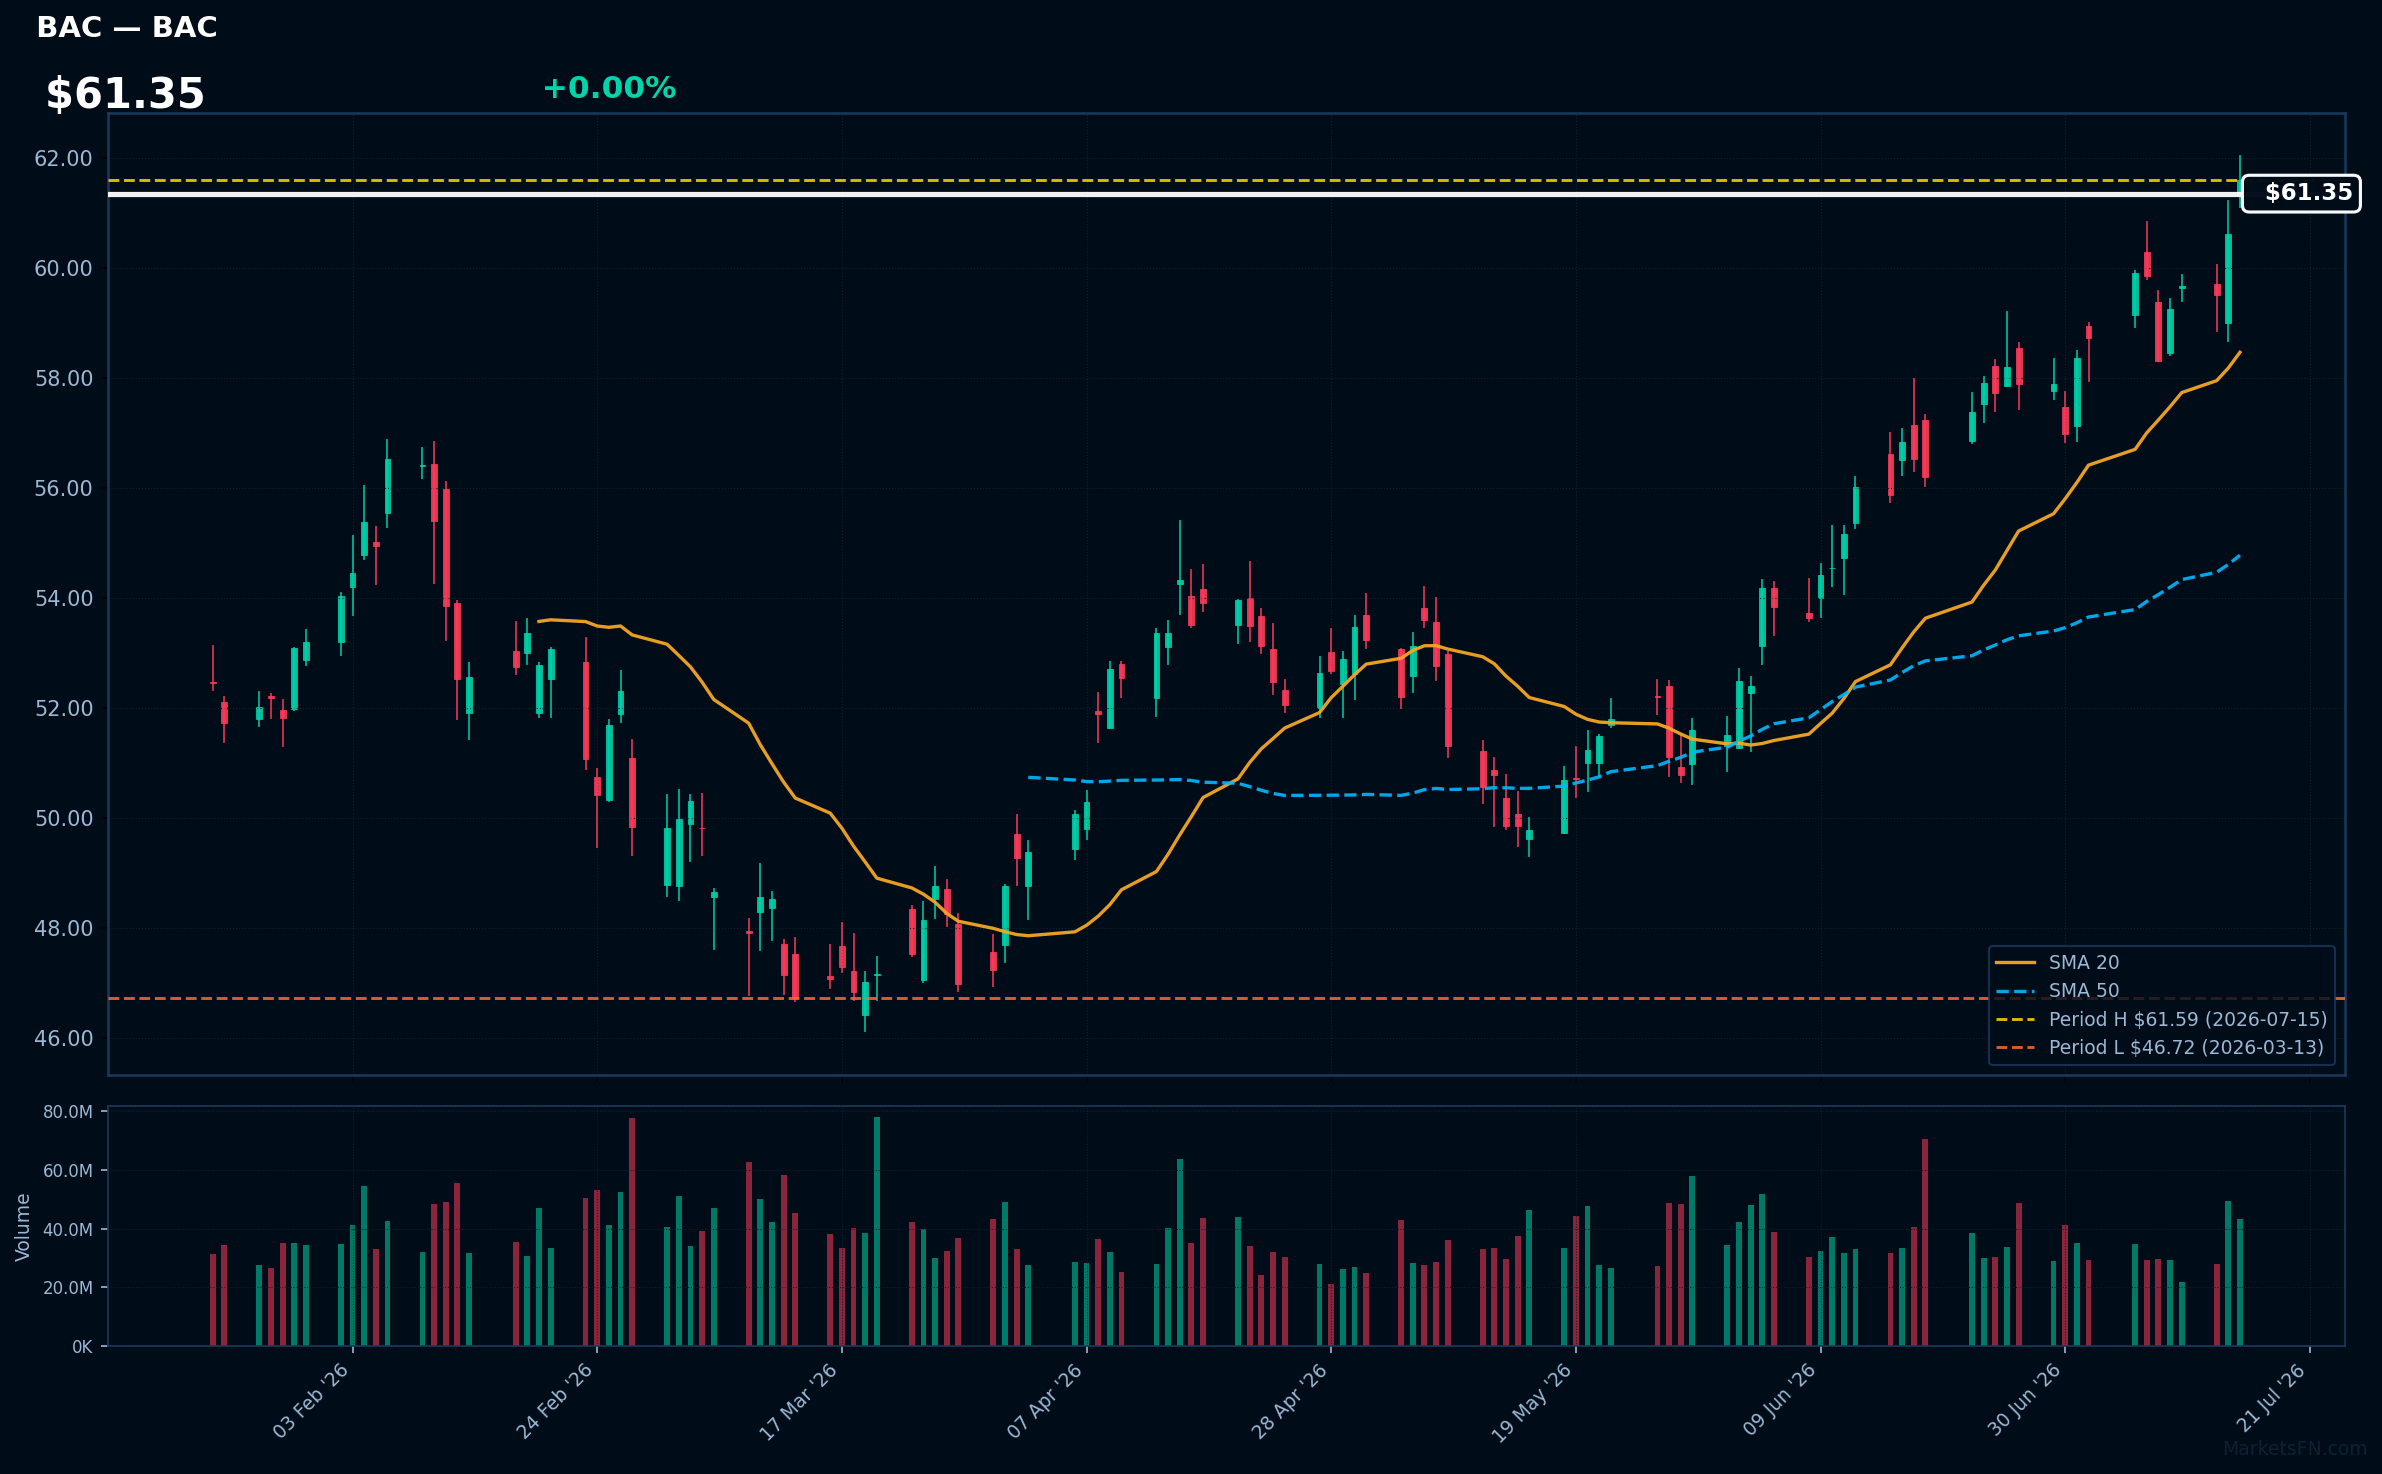
BAC | Bank Of America Corp | Financial | Price Last: $61.59 | % Realized: +10.08% | RSI: 70.8 | % above MA200: +16.3% | Trend: Above MA20, MA50, MA200
Bank Of America Corp is a multinational banking and financial services corporation. Investors should care about its performance as it is a significant player in the US banking sector, influencing overall market sentiment and economic indicators.
The stock is near a potential breakout at $61.35, with RSI(14) at 70.8, indicating strong momentum. The MA alignment (price > MA20 > MA50 > MA200) confirms a sustained uptrend, suggesting continued bullishness.
Related headlines
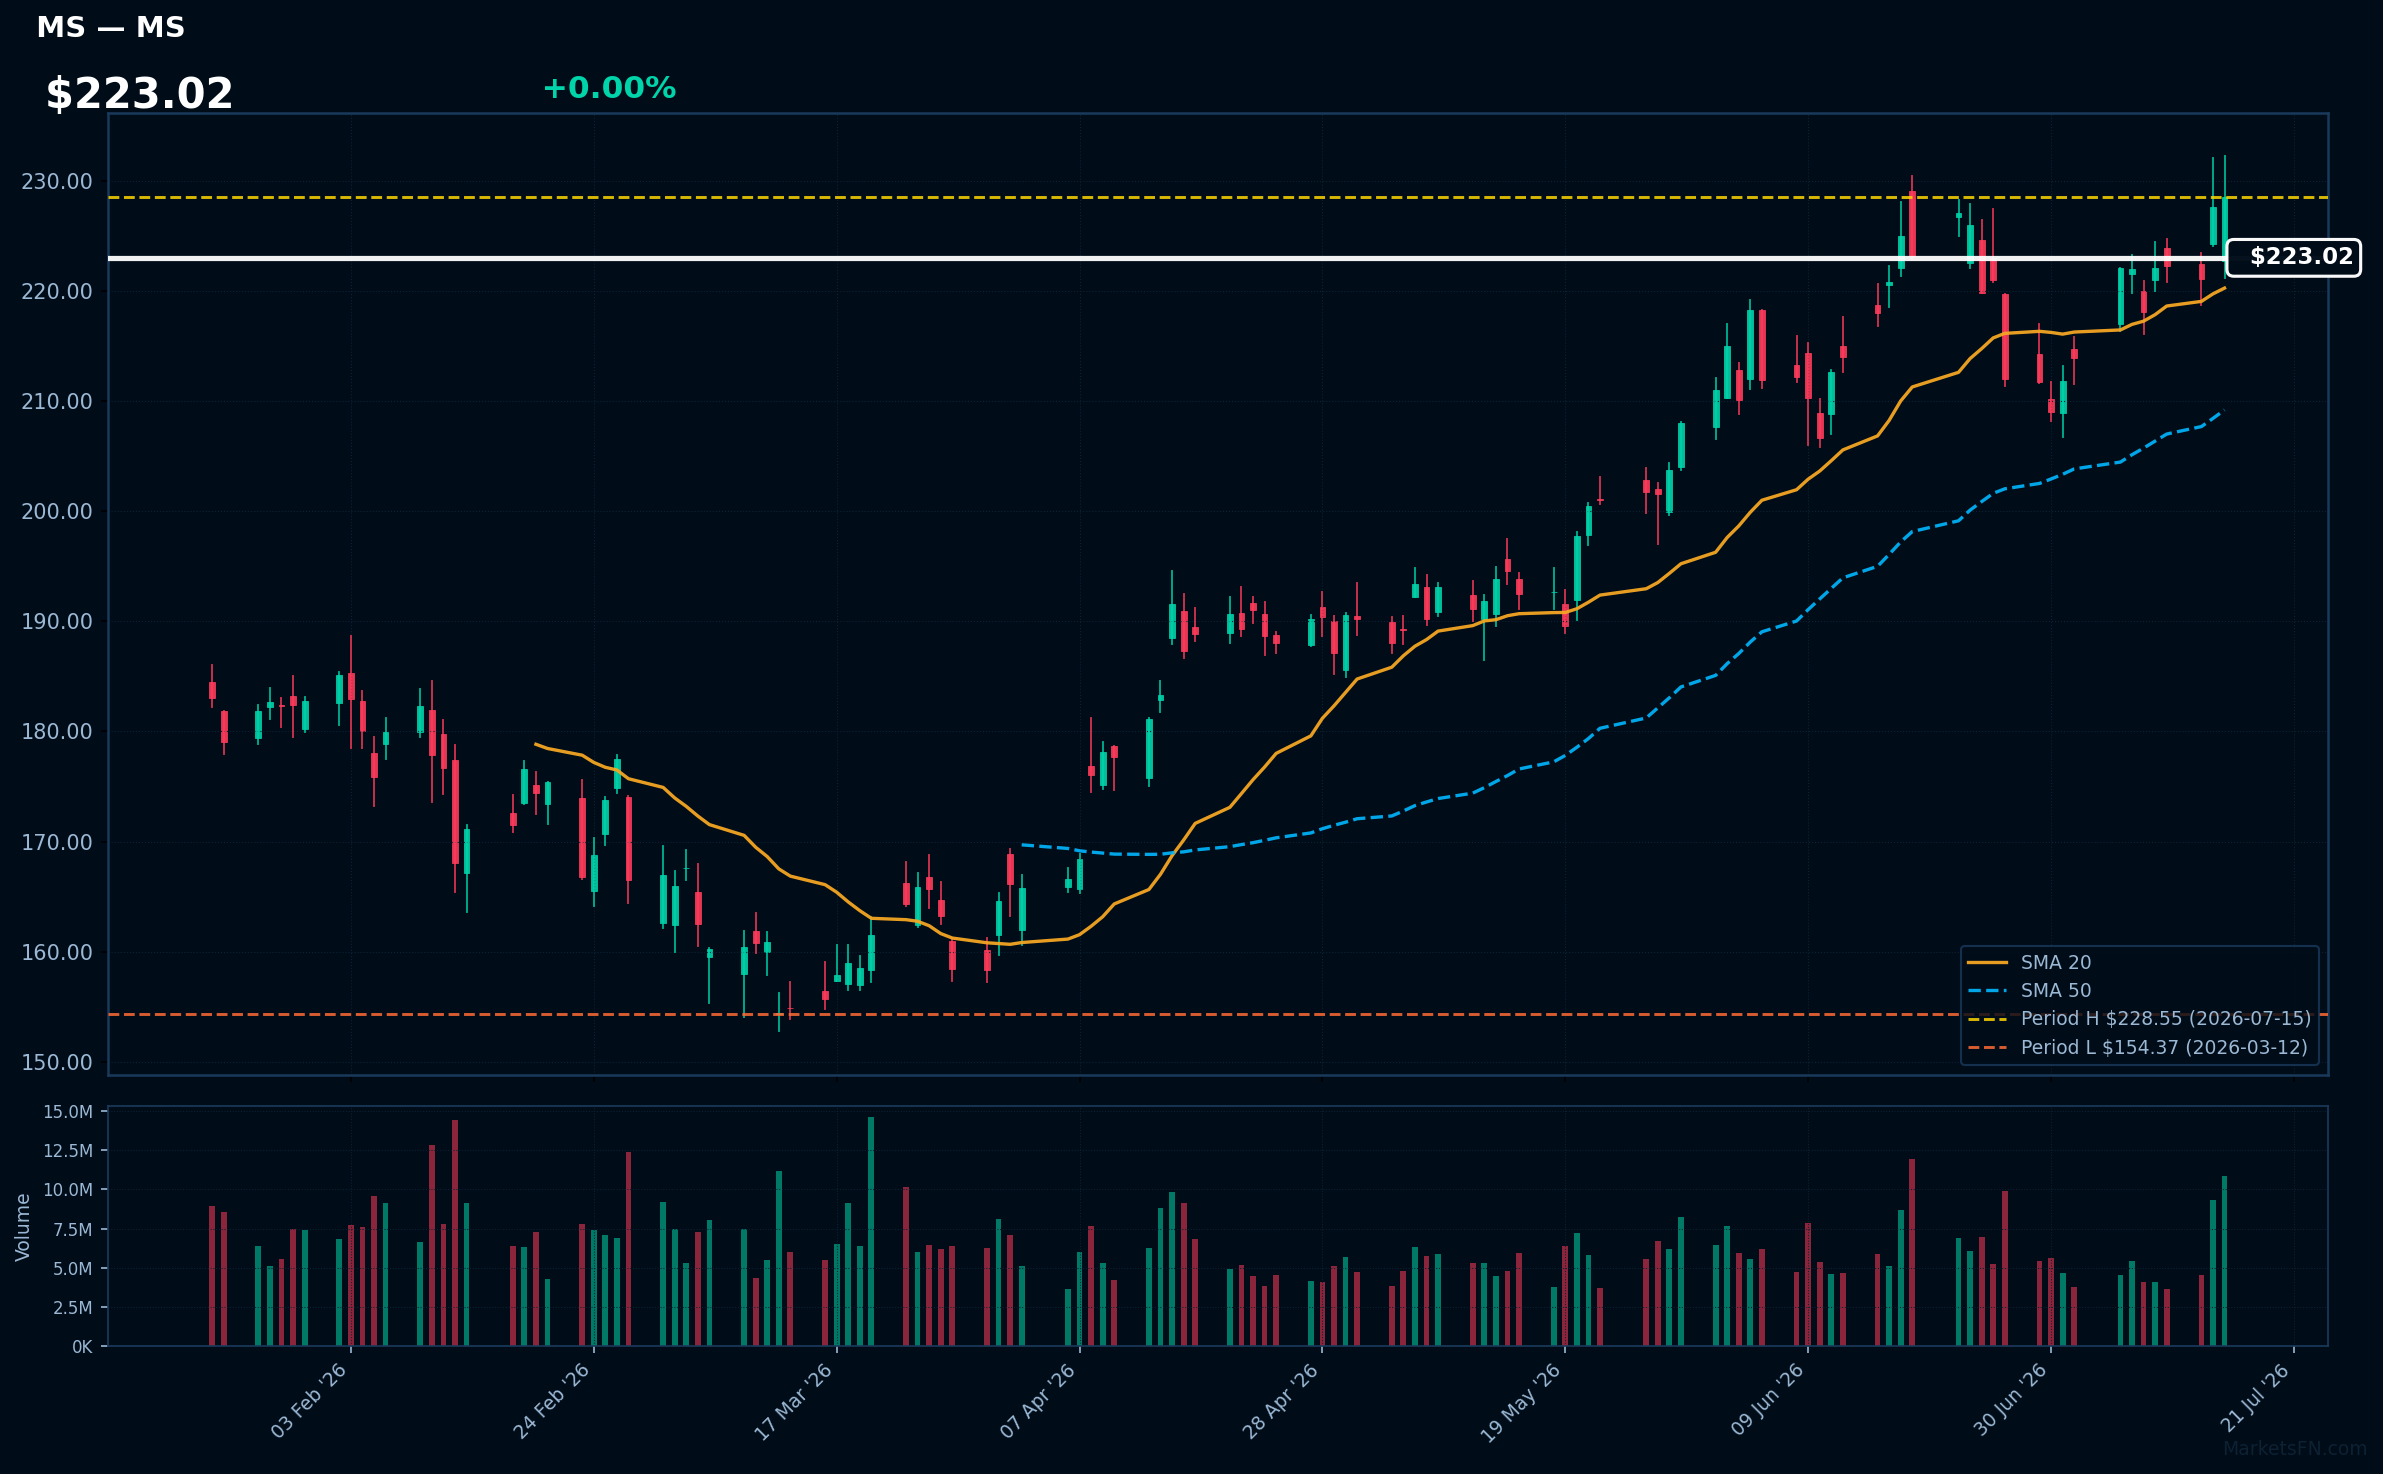
MS | Morgan Stanley | Financial | Price Last: $228.55 | % Realized: +25.65% | RSI: 56.6 | % above MA200: +26.0% | Trend: Above MA20, MA50, MA200
Morgan Stanley is a global financial services firm providing investment banking, wealth management, and investment management services. Investors should care about its performance as it reflects the health of global financial markets and its competitive positioning within them.
Morgan Stanley's RSI(14) is 56.6, indicating neutral momentum. The stock is in a sustained uptrend with price > MA20 > MA50 > MA200. It's 0.0% below its 2026 YTD high, suggesting potential for a breakout.
Related headlines
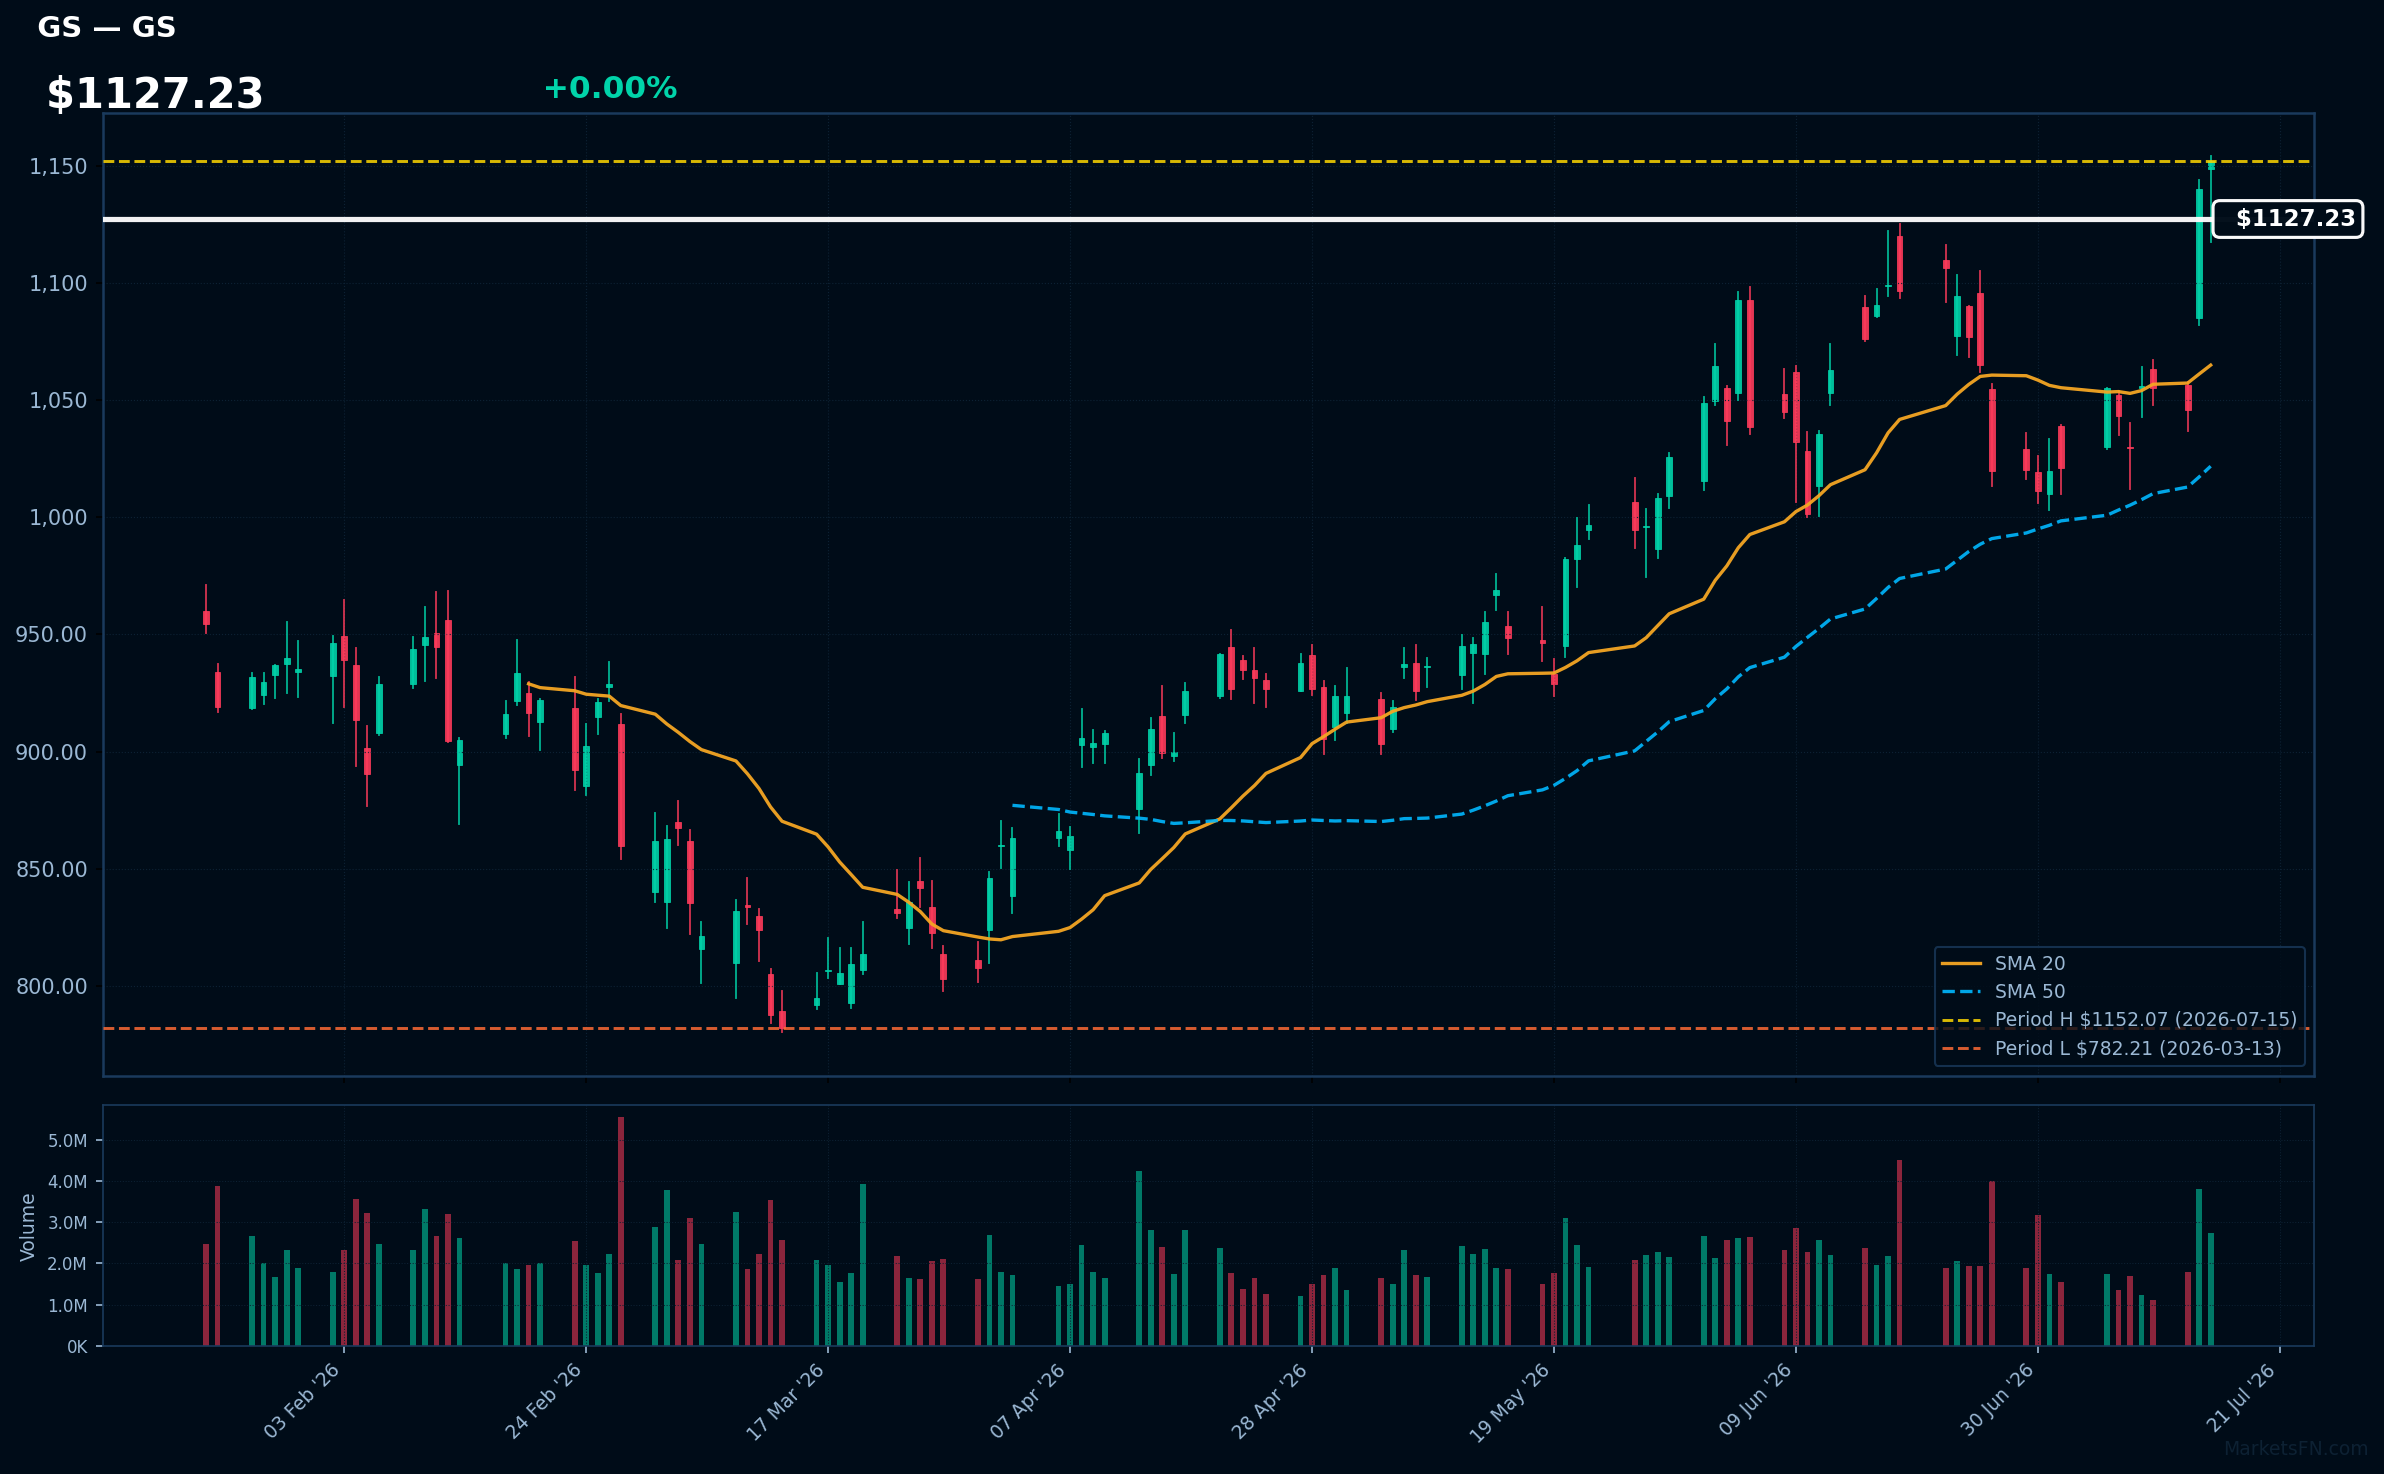
GS | Goldman Sachs Group, Inc | Financial | Price Last: $1152.07 | % Realized: +26.00% | RSI: 62.9 | % above MA200: +27.7% | Trend: Above MA20, MA50, MA200
Goldman Sachs Group, Inc is a global investment bank and financial services company. Investors should care because it is a major player in global markets, providing investment banking, asset management, and securities services, influencing market trends and economic activity.
The stock is in a sustained uptrend with price at $1127.23, RSI(14) at 62.9, and MA alignment: price > MA20 > MA50 > MA200. It's near its 2026 YTD high, up 26.0% YTD, indicating strong momentum with no warning signs.
Related headlines
📉 Nearest to 2026 Low
Sectors represented: Consumer Defensive (2), Technology (1), Consumer Cyclical (1), Industrials (1)
| Ticker | Company | Sector | Price Last | % Realized | 2026 YTD Low Date | RSI | % above MA200 | Trend |
|---|---|---|---|---|---|---|---|---|
| IBM | International Business Machines Corp | Technology | $211.20 | -27.55% | 2026-07-15 | 28.1 | -23.0% | Below MA20, MA50, MA200 |
| PEP | PepsiCo Inc | Consumer Defensive | $135.40 | -4.80% | 2026-06-30 | 43.4 | -9.7% | Below MA20, MA50, MA200 |
| ORLY | O'Reilly Automotive, Inc | Consumer Cyclical | $82.73 | -8.42% | 2026-07-15 | 43.5 | -12.0% | Below MA20, MA50, MA200 |
| CPRT | Copart, Inc | Industrials | $27.28 | -27.77% | 2026-07-15 | 39.5 | -25.8% | Below MA20, MA50, MA200 |
| HSY | Hershey Company | Consumer Defensive | $170.27 | -6.66% | 2026-07-15 | 44.9 | -11.7% | Below MA20, MA50, MA200 |
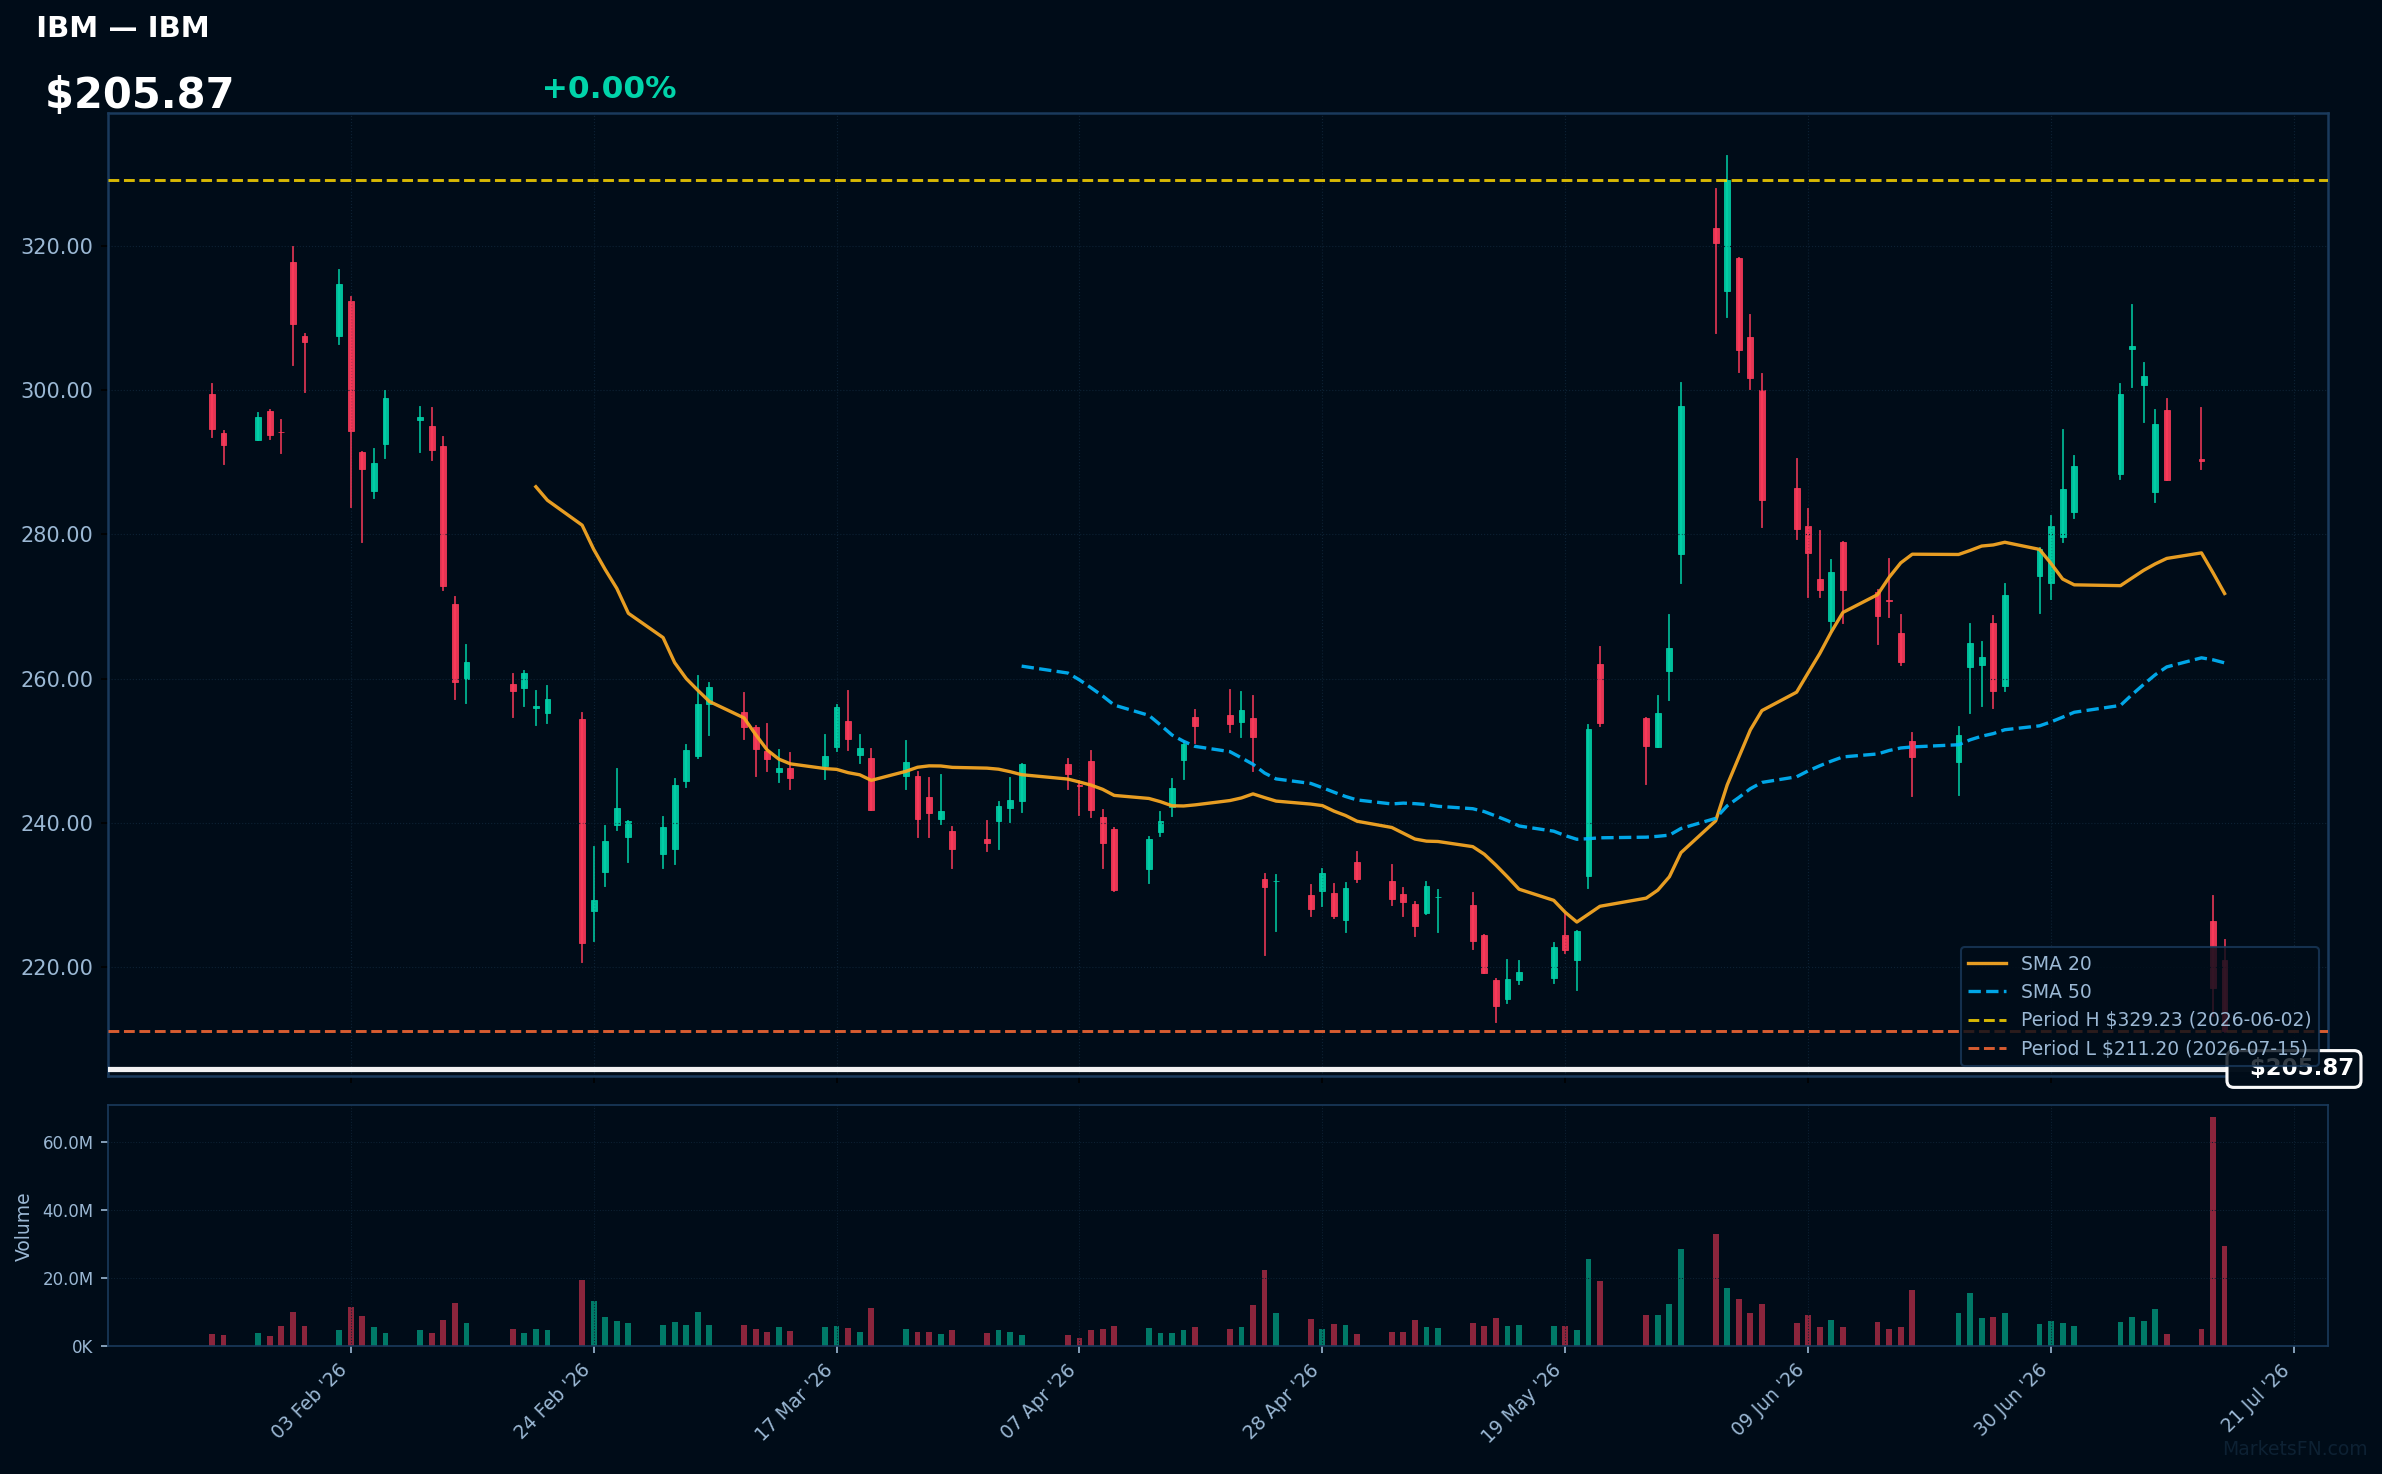
IBM | International Business Machines Corp | Technology | Price Last: $211.20 | % Realized: -27.55% | RSI: 28.1 | % above MA200: -23.0% | Trend: Below MA20, MA50, MA200
International Business Machines Corp (IBM) is a technology company that provides a range of services including cloud computing, artificial intelligence, and IT consulting. Investors care about its ability to adapt to emerging tech trends and maintain market share.
IBM's RSI(14) is 28.1, indicating oversold conditions. It's below MA20, MA50, and MA200, showing bearish alignment. The stock is at its 2026 YTD low, down 27.5% YTD, suggesting a warning sign due to extreme proximity to its low and negative momentum.
Related headlines
- MU, SNDK, SKHY, WDC Stocks Drop Overnight: AI Memory Giants Suffer Reversal As IBM-Driven Rally Fades
- Why Did SPCX, IBM, BSX Drop To 52-Week Lows Today?
- We did not adapt and move quickly enough: IBM CEOs admission of weakness fails to prevent historic 25% stock crash
- Oppenheimer Downgrades IBM Stock After Earnings Miss Triggers Massive Sell-Off
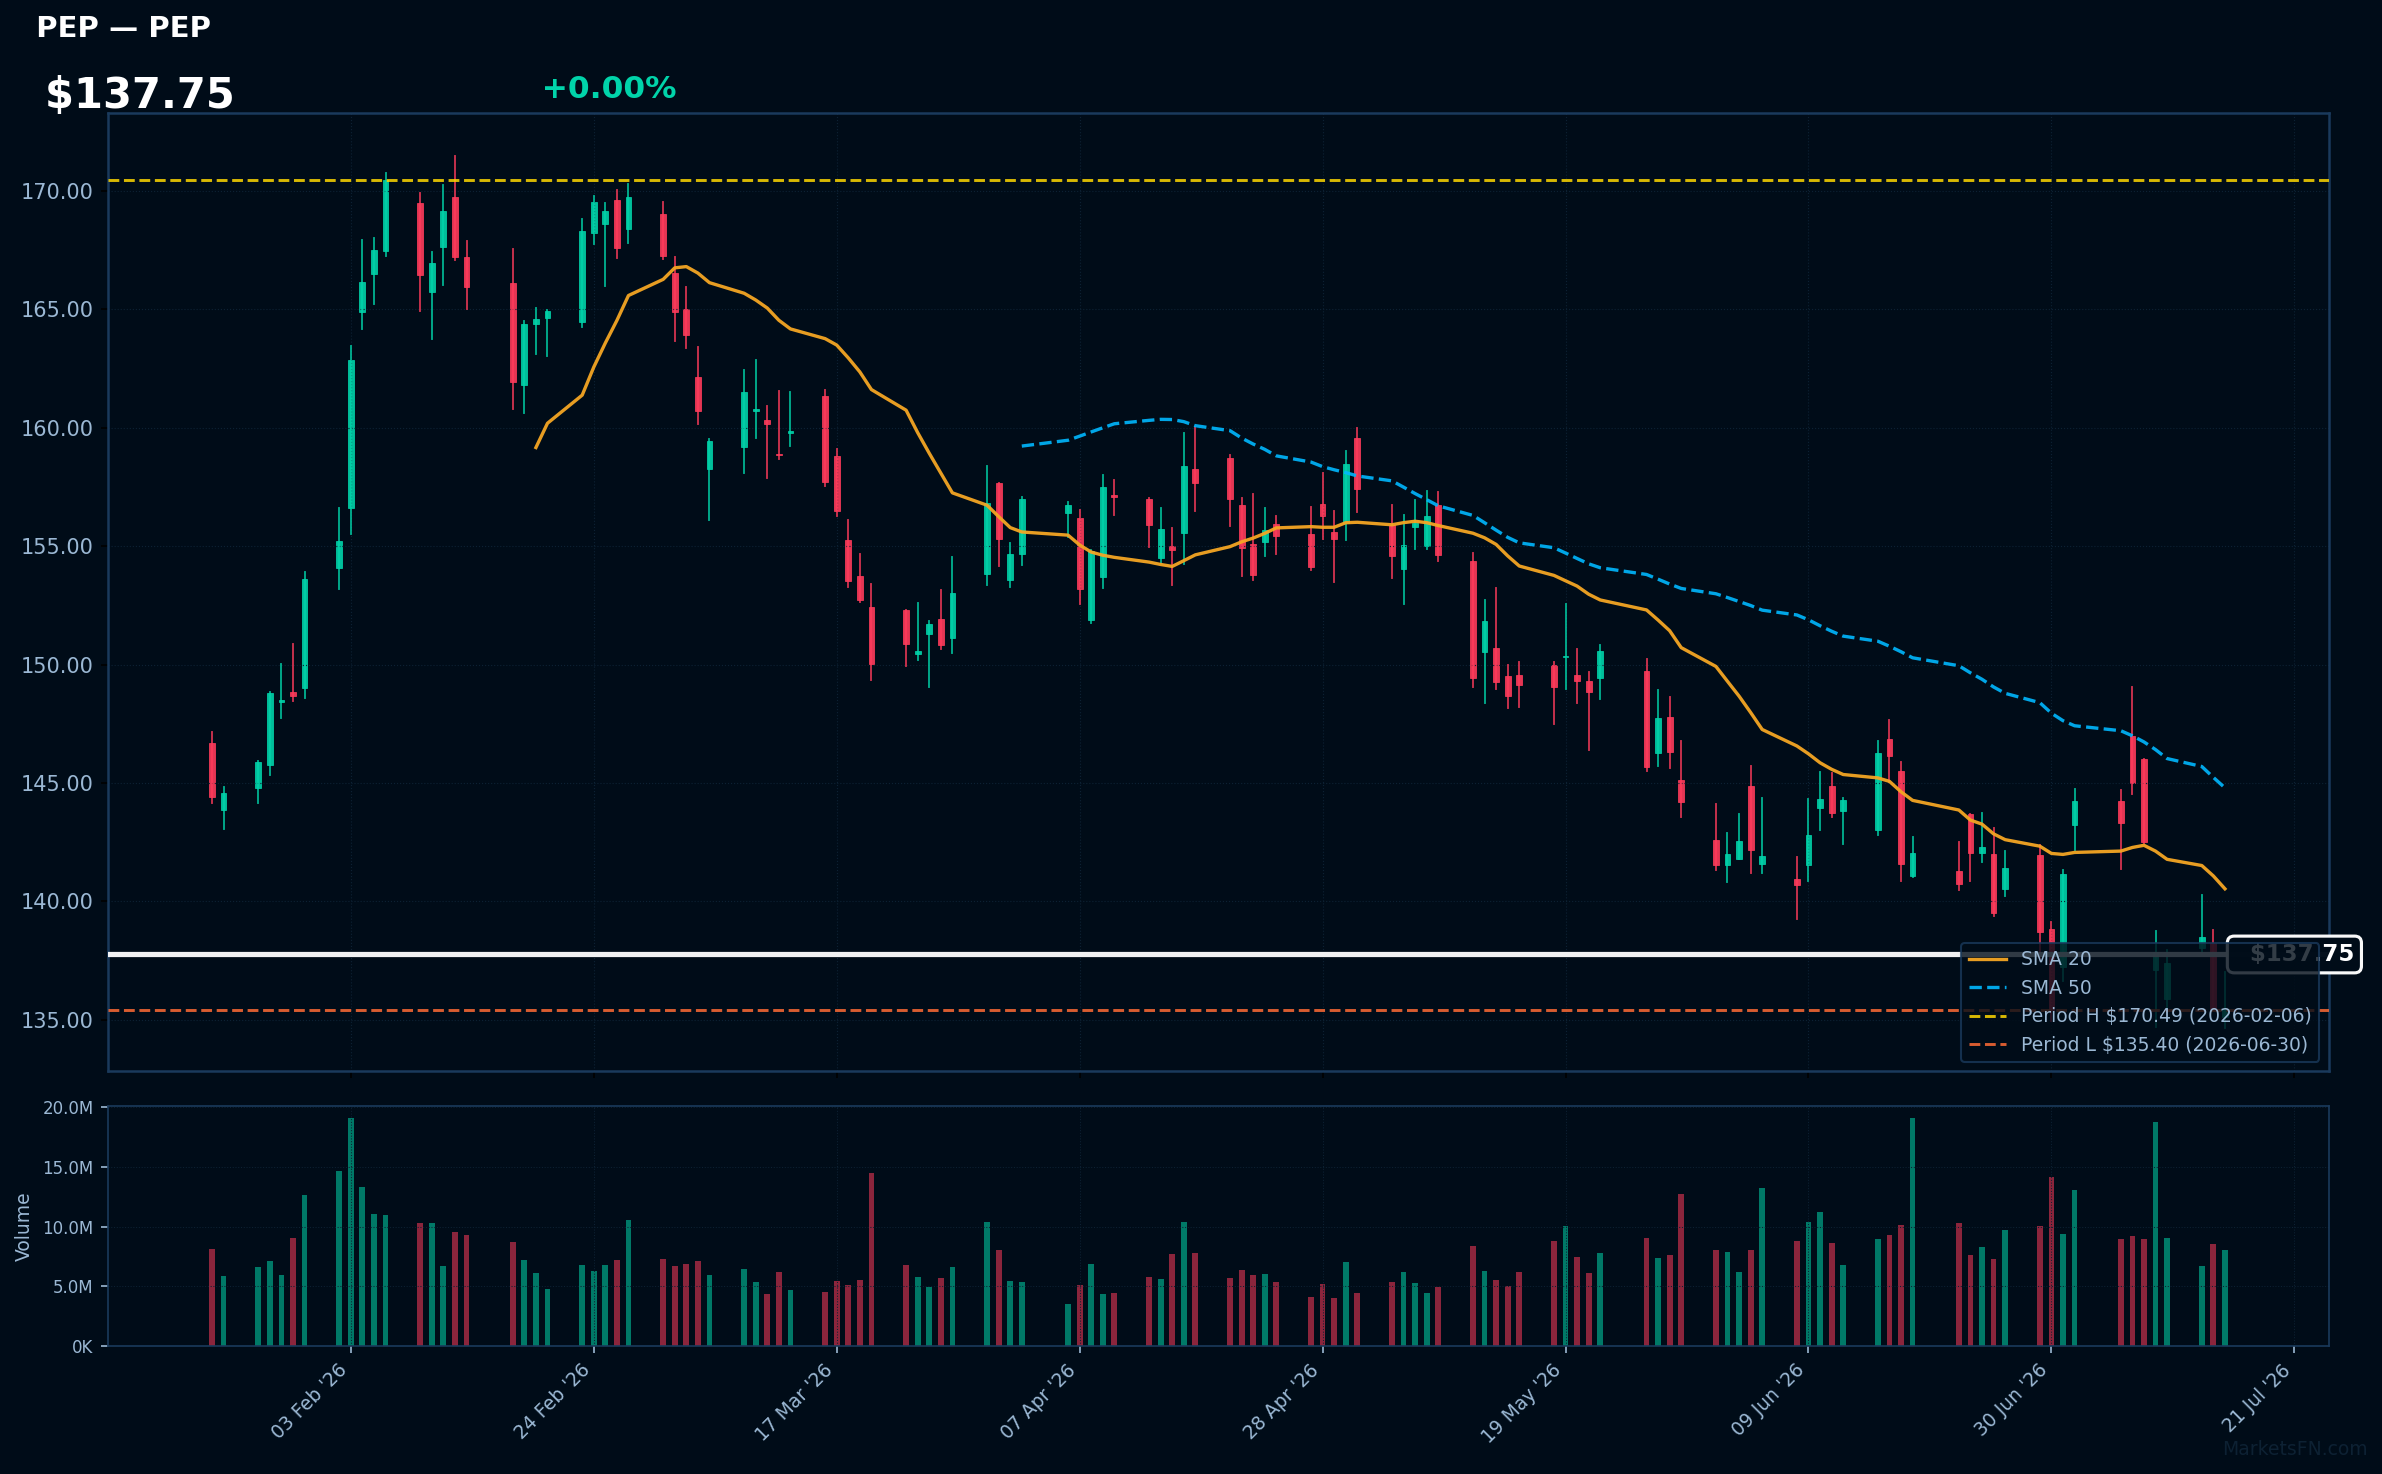
PEP | PepsiCo Inc | Consumer Defensive | Price Last: $135.40 | % Realized: -4.80% | RSI: 43.4 | % above MA200: -9.7% | Trend: Below MA20, MA50, MA200
PepsiCo Inc is a multinational food and beverage corporation that generates revenue through the sale of popular brands such as Pepsi, Lay's, and Gatorade, making it a significant player in the consumer staples sector, with investors caring about its steady demand and dividend yield.
PepsiCo Inc's current technical situation is bearish, with an RSI(14) of 43.4 indicating neutral momentum, while the MA alignment (price < MA20 < MA50 < MA200) signals a sustained downtrend, and the stock testing major support at its 2026 YTD low.
Related headlines
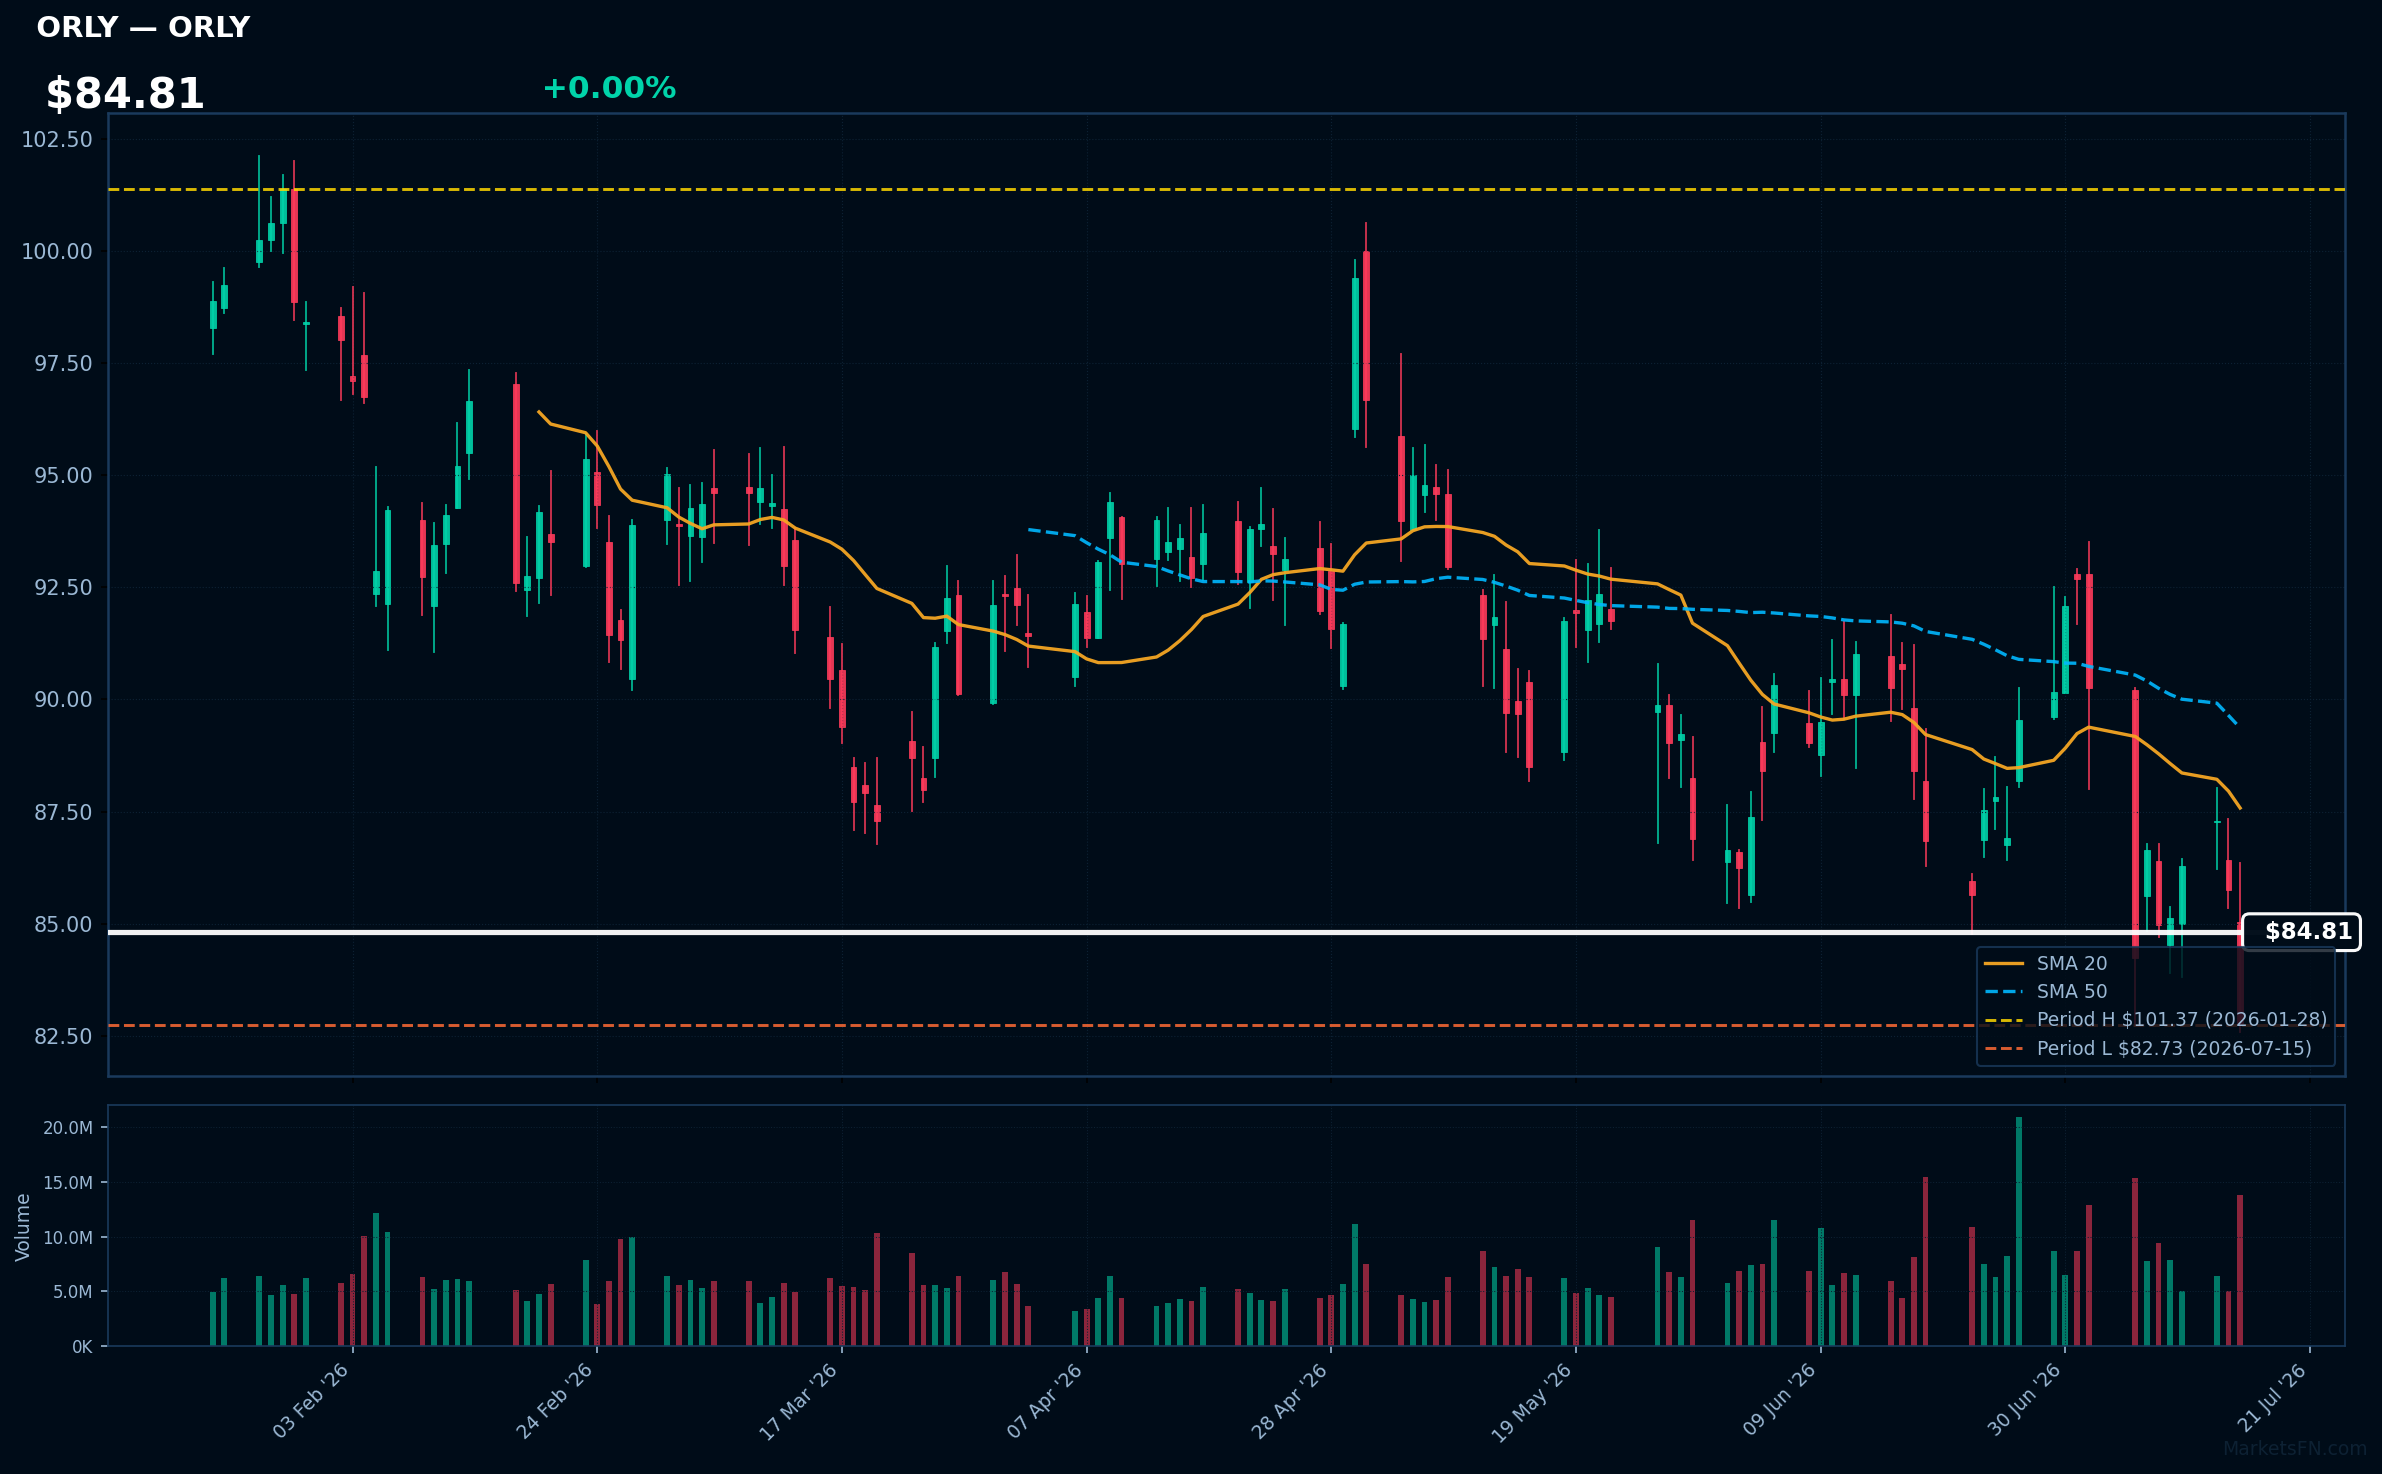
ORLY | O'Reilly Automotive, Inc | Consumer Cyclical | Price Last: $82.73 | % Realized: -8.42% | RSI: 43.5 | % above MA200: -12.0% | Trend: Below MA20, MA50, MA200
O'Reilly Automotive, Inc (ORLY) operates a network of retail stores selling automotive parts and accessories. Investors care due to its market presence and potential for steady demand, driven by the large and relatively stable aftermarket auto parts industry.
ORLY's technicals indicate a sustained downtrend with price ($84.81) below MA20, MA50, and MA200. The RSI(14) is 43.5, nearing oversold territory. The stock is testing major support at its 2026 YTD low, having returned -8.4% YTD, suggesting a warning sign.
Related headlines
- Why Did REE, HTZ, ORLY Stocks Slump To 52-Week Lows Today?
- O'Reilly Stock Sinks on Report of Possible NAPA Bid
- GPC Stock Pops 13%, ORLY Falls 5% OReilly Makes Cash Bid For Genuine Parts $10B Auto Unit, Says Report
- O'Reilly Automotive, Inc. Announces Dates for Its Second Quarter 2026 Earnings Release and Conference Call
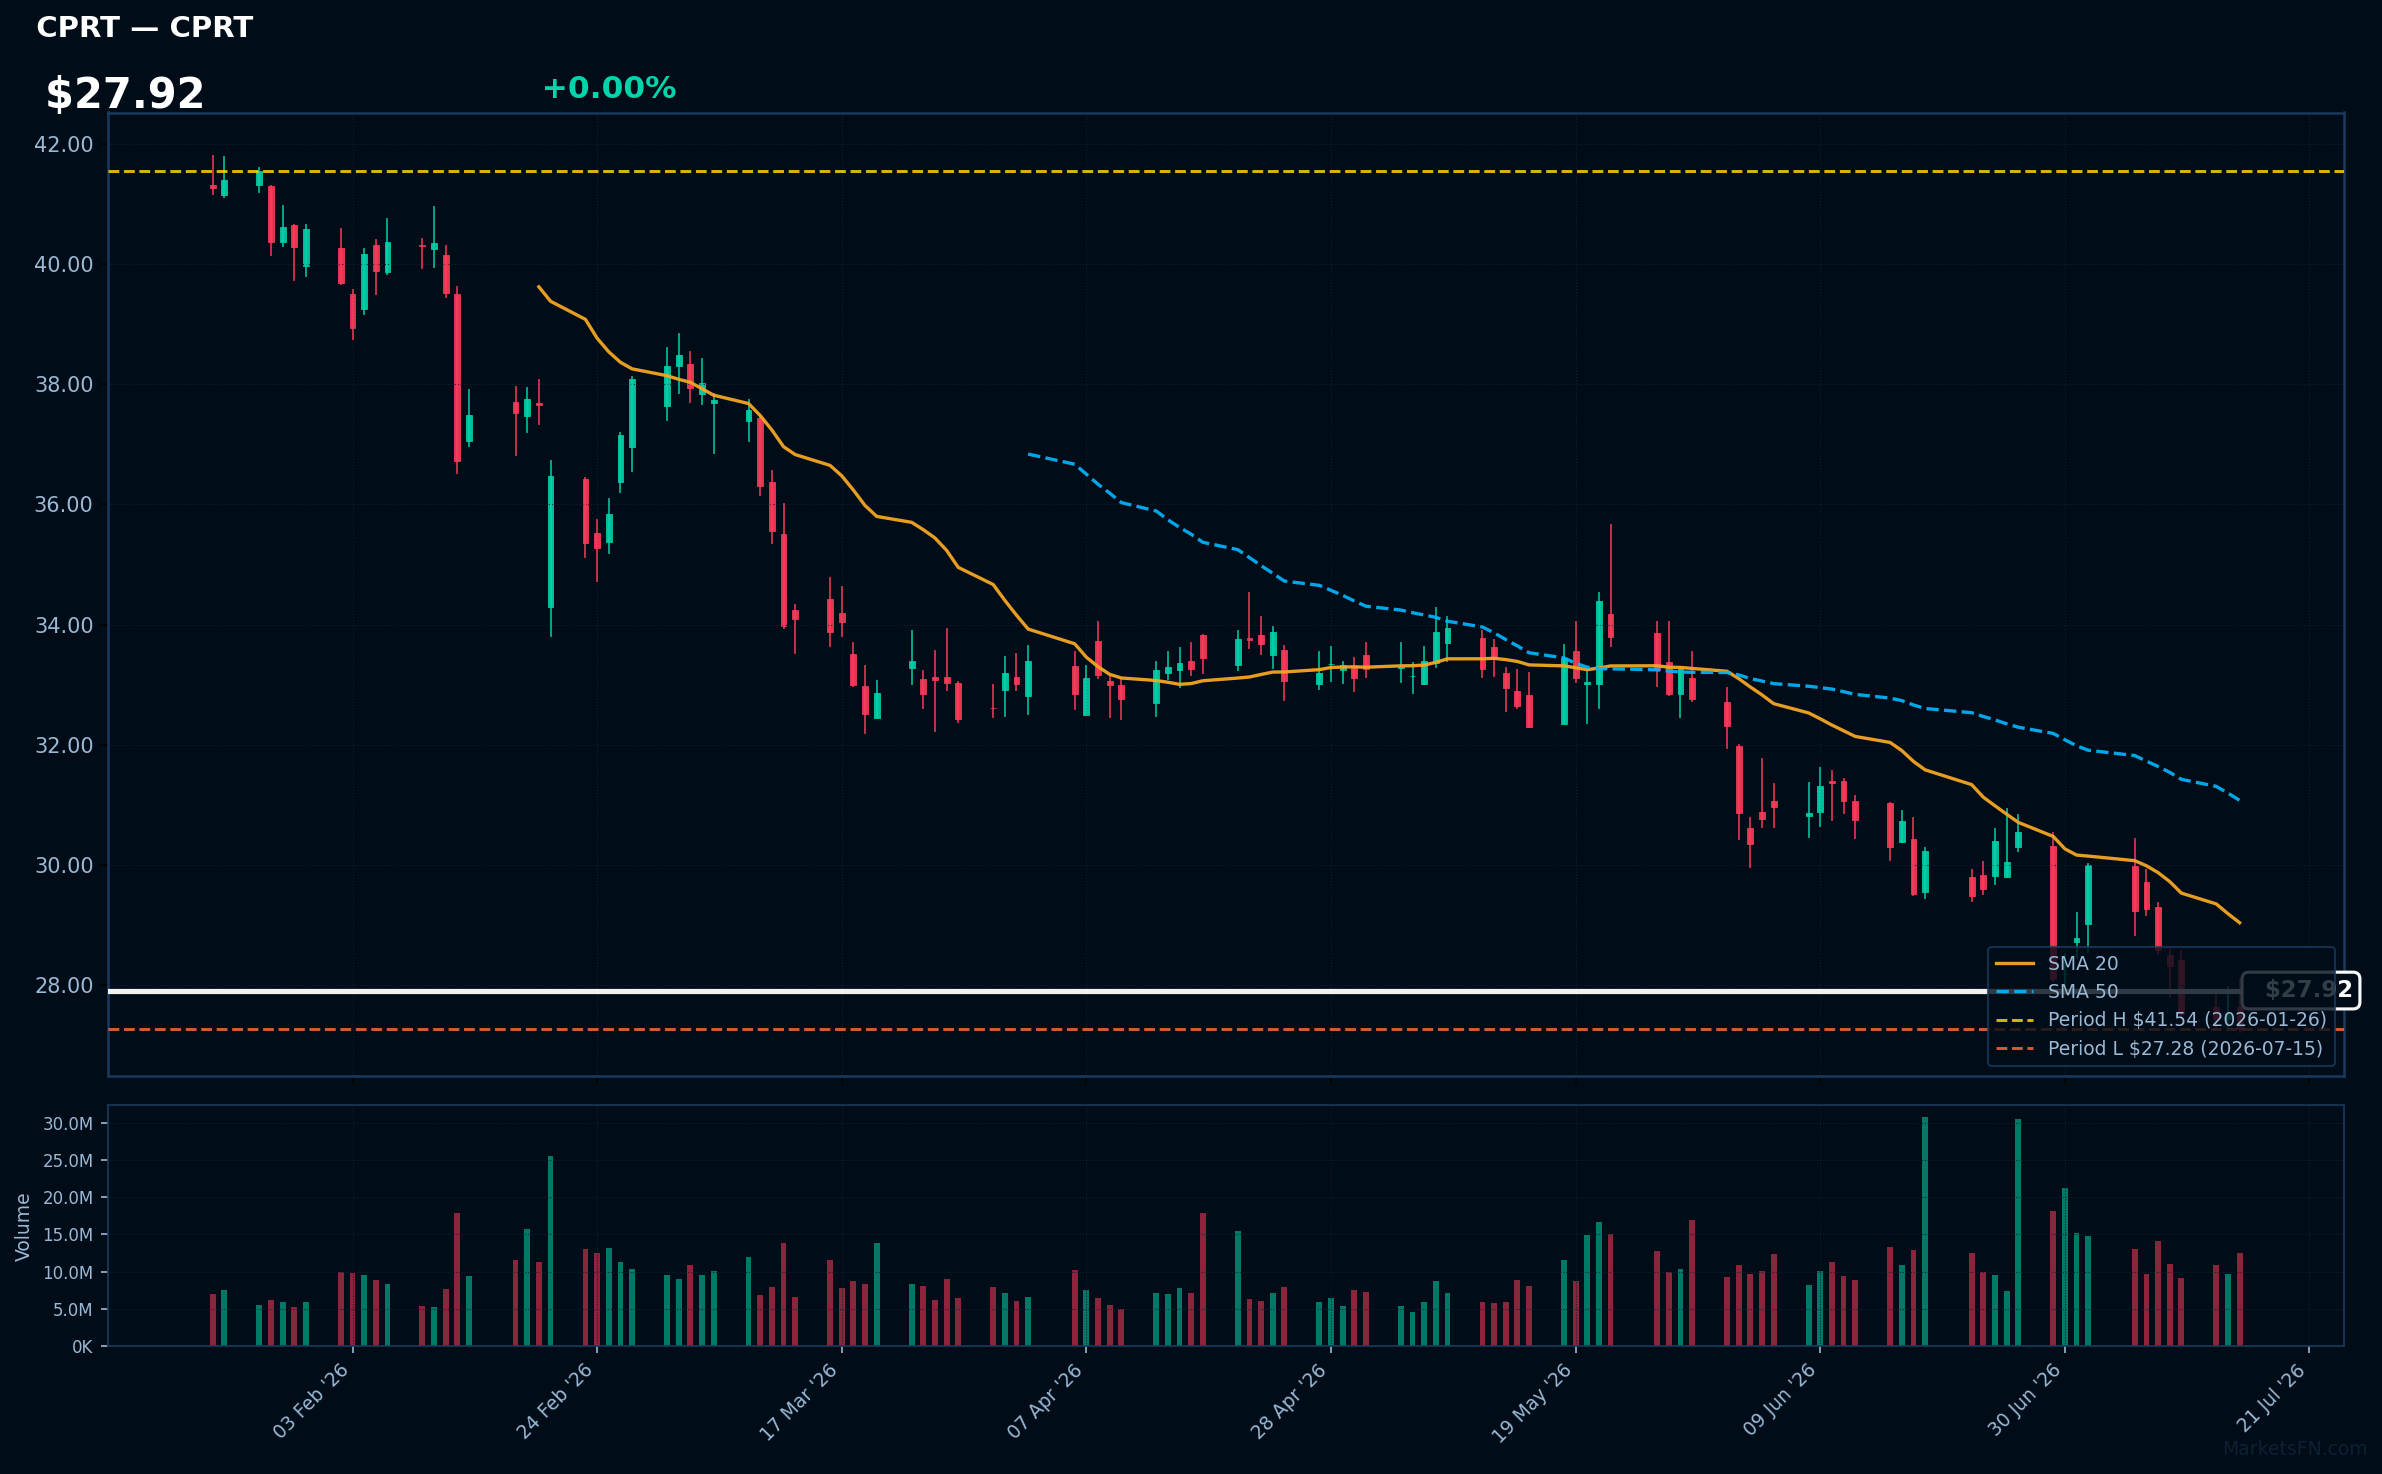
CPRT | Copart, Inc | Industrials | Price Last: $27.28 | % Realized: -27.77% | RSI: 39.5 | % above MA200: -25.8% | Trend: Below MA20, MA50, MA200
Copart, Inc (CPRT) operates an online vehicle auction platform and provides related services, allowing insurance companies and other sellers to sell damaged or used vehicles to buyers worldwide. Investors care due to its market dominance and growth potential in the vehicle remarketing industry.
Copart's technical situation indicates a sustained downtrend with price ($27.92) below MA20, MA50, and MA200. The RSI(14) is 39.5, nearing oversold territory. The stock is testing major support at its 2026 YTD low, having fallen 27.8% YTD, potentially a warning sign.
Related headlines
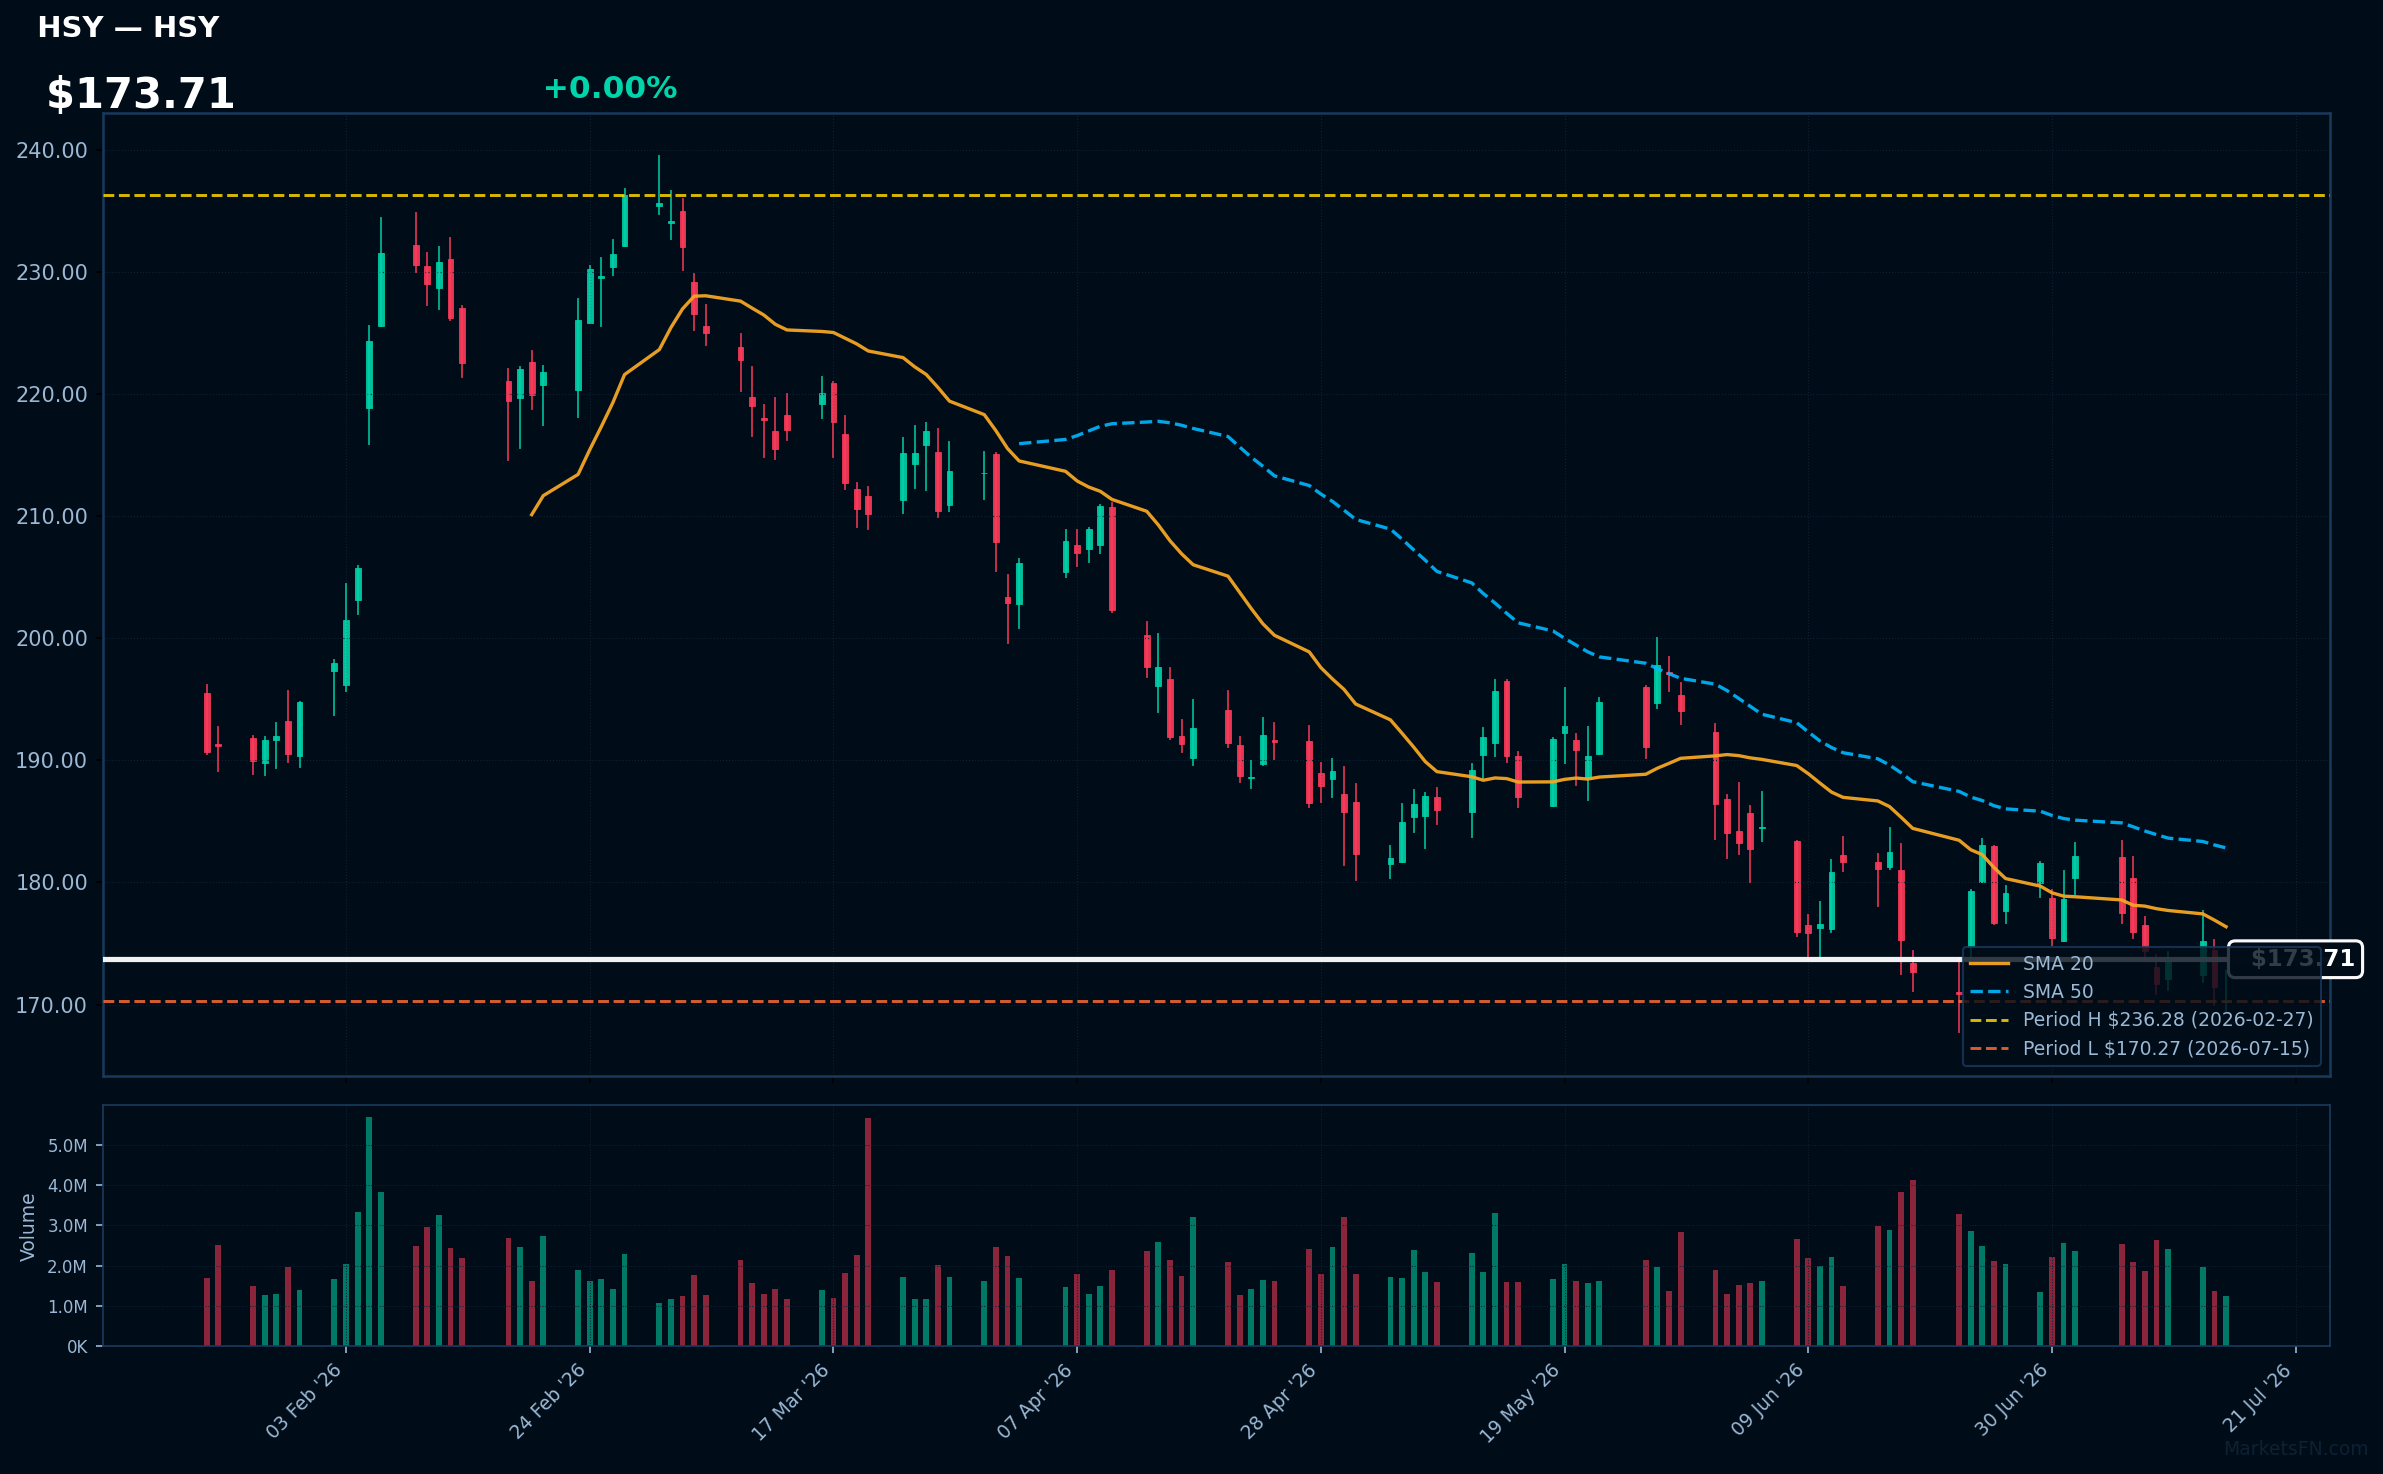
HSY | Hershey Company | Consumer Defensive | Price Last: $170.27 | % Realized: -6.66% | RSI: 44.9 | % above MA200: -11.7% | Trend: Below MA20, MA50, MA200
Hershey Company is a leading manufacturer and distributor of confectionery and snack products. Investors should care about its ability to maintain market share and pricing power in a competitive consumer goods market.
Hershey's current technical situation is bearish, with RSI(14) at 44.9 and a sustained downtrend (price < MA20 < MA50 < MA200). The stock is testing major support at its 2026 YTD low.
Related headlines
Market Commentary
The S&P 500 stocks listed are currently trading near their year-to-date (YTD) extremes as of 2026. Specifically, AAPL, JPM, BAC, MS, and GS are at their YTD highs, while IBM, PEP, ORLY, CPRT, and HSY are at their YTD lows. This indicates that these stocks have either reached new highs or lows since the beginning of 2026 and are currently trading at or very near those levels.
The stocks at YTD highs are predominantly from the financial sector, with JPM, BAC, MS, and GS representing major banks and financial institutions. AAPL, a technology giant, is also at its YTD high. In contrast, the stocks at YTD lows are from diverse sectors, including technology (IBM), consumer staples (PEP, HSY), and consumer discretionary (ORLY, CPRT). This suggests varying sectoral performances and potential shifts in investor sentiment.
Investors should monitor market conditions, sector rotations, and company-specific news to understand the drivers behind these extreme price levels. As the year progresses, changes in these stocks' positions relative to their YTD extremes may indicate broader market trends or sector-specific developments.
Methodology: All 503 S&P 500 constituents screened. Close prices downloaded from 2026-01-01. Period high = highest close since Jan 1 2026; period low = lowest close since Jan 1 2026. Distance = (current price / period extreme − 1) × 100. Technical indicators computed on up to 1 year of daily OHLCV data.
Disclaimer: For informational purposes only. Not investment advice. Past performance is not indicative of future results.

