S&P 500 2026 YTD Highs & Lows Radar: Arista Networks (ANET), Copart, (CPRT) and more
MarketsFN Team

S&P 500 2026 YTD Highs & Lows Radar: Arista Networks (ANET), Copart, (CPRT) and more
Screening all 503 S&P 500 constituents for stocks nearest to their 2026 year-to-date high and their 2026 YTD low. Data as of July 13, 2026. % Realized = total return since Jan 1 2026.
Legend: RSI > 70 = overbought · RSI < 30 = oversold · Green % Realized = positive YTD return · Red = negative.
📈 Nearest to 2026 High
Sectors represented: Industrials (3), Technology (1), Energy (1)
| Ticker | Company | Sector | Price Last | % Realized | 2026 YTD High Date | RSI | % above MA200 | Trend |
|---|---|---|---|---|---|---|---|---|
| ANET | Arista Networks Inc | Technology | $186.96 | +39.94% | 2026-07-10 | 63.9 | +29.7% | Above MA20, MA50, MA200 |
| UNP | Union Pacific Corp | Industrials | $286.96 | +23.74% | 2026-07-10 | 68.4 | +16.5% | Above MA20, MA50, MA200 |
| NSC | Norfolk Southern Corp | Industrials | $327.47 | +13.78% | 2026-07-10 | 63.3 | +9.5% | Above MA20, MA50, MA200 |
| CSX | CSX Corp | Industrials | $49.41 | +36.23% | 2026-07-10 | 68.3 | +22.8% | Above MA20, MA50, MA200 |
| MPC | Marathon Petroleum Corp | Energy | $283.74 | +71.82% | 2026-07-10 | 74.4 | +32.9% | Above MA20, MA50, MA200 |
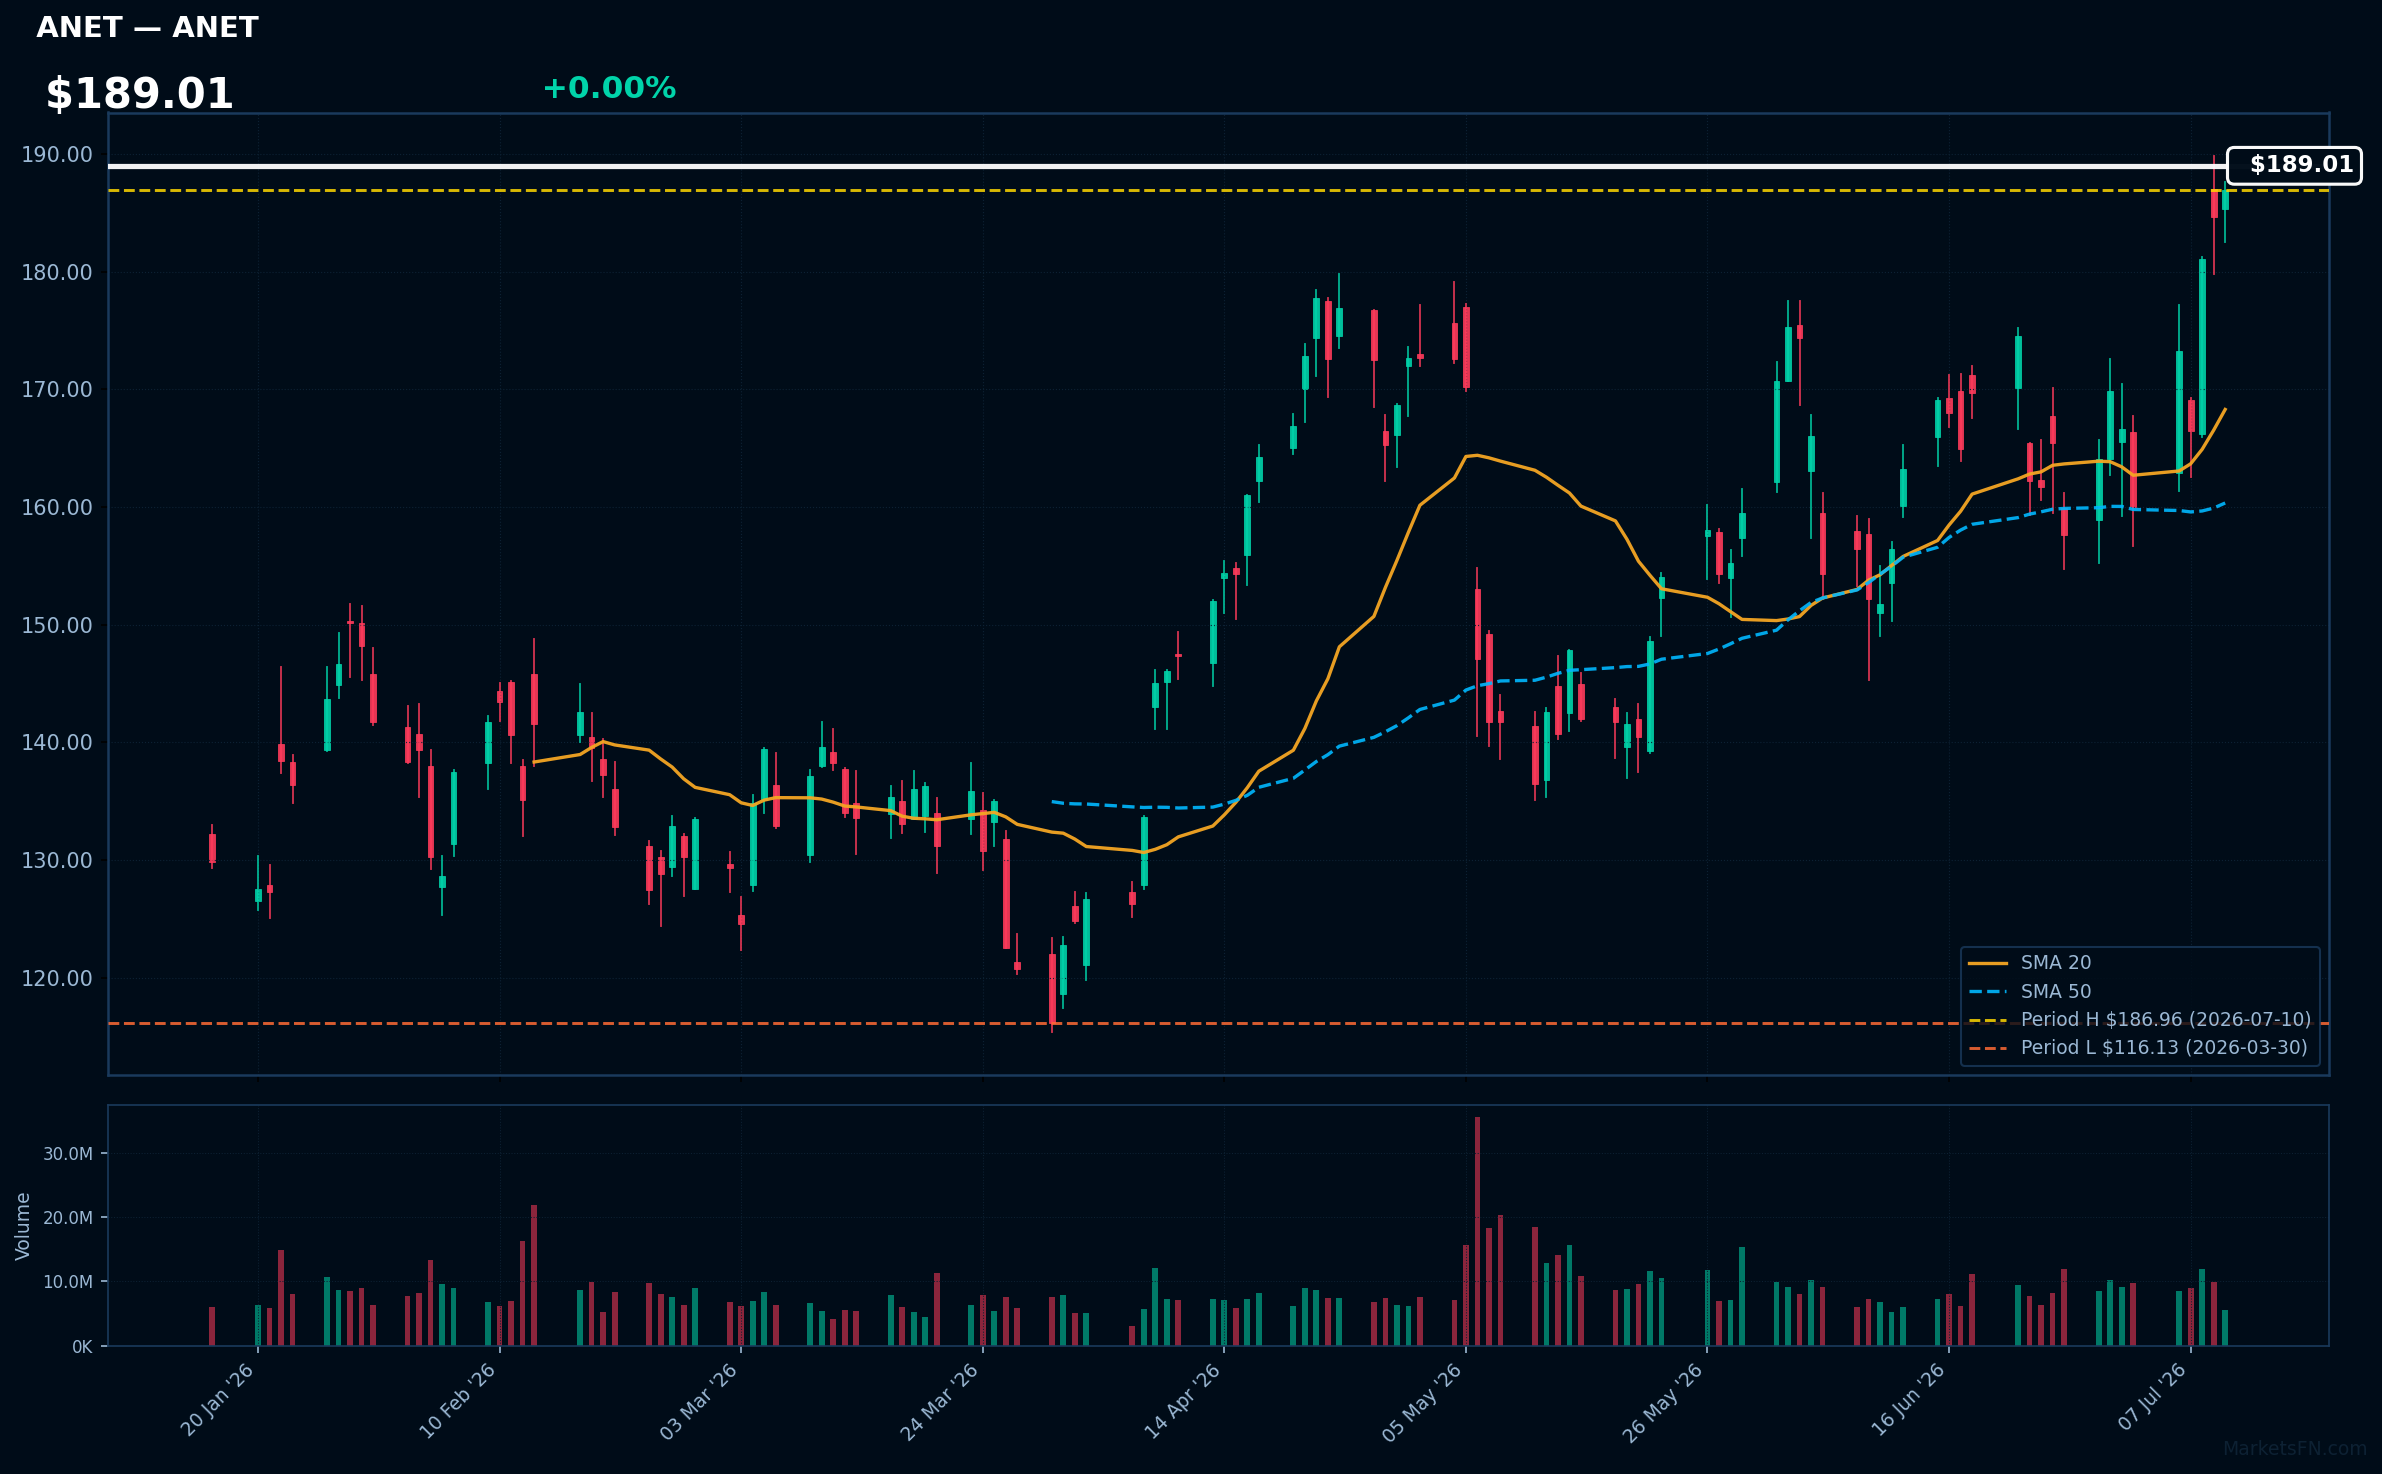
ANET | Arista Networks Inc | Technology | Price Last: $186.96 | % Realized: +39.94% | RSI: 63.9 | % above MA200: +29.7% | Trend: Above MA20, MA50, MA200
Arista Networks Inc is a data center networking solutions provider, offering high-performance, scalable Ethernet switching and routing products. Investors should care due to its strong presence in cloud networking, driven by demand for AI and hyperscale data centers.
Arista Networks Inc is in a sustained uptrend with bullish MA alignment: price ($189.01) > MA20 > MA50 > MA200. RSI(14) is 63.9, near its 2026 YTD high, indicating strong momentum with 39.9% 2026 YTD return, suggesting potential for further breakout.
Related headlines
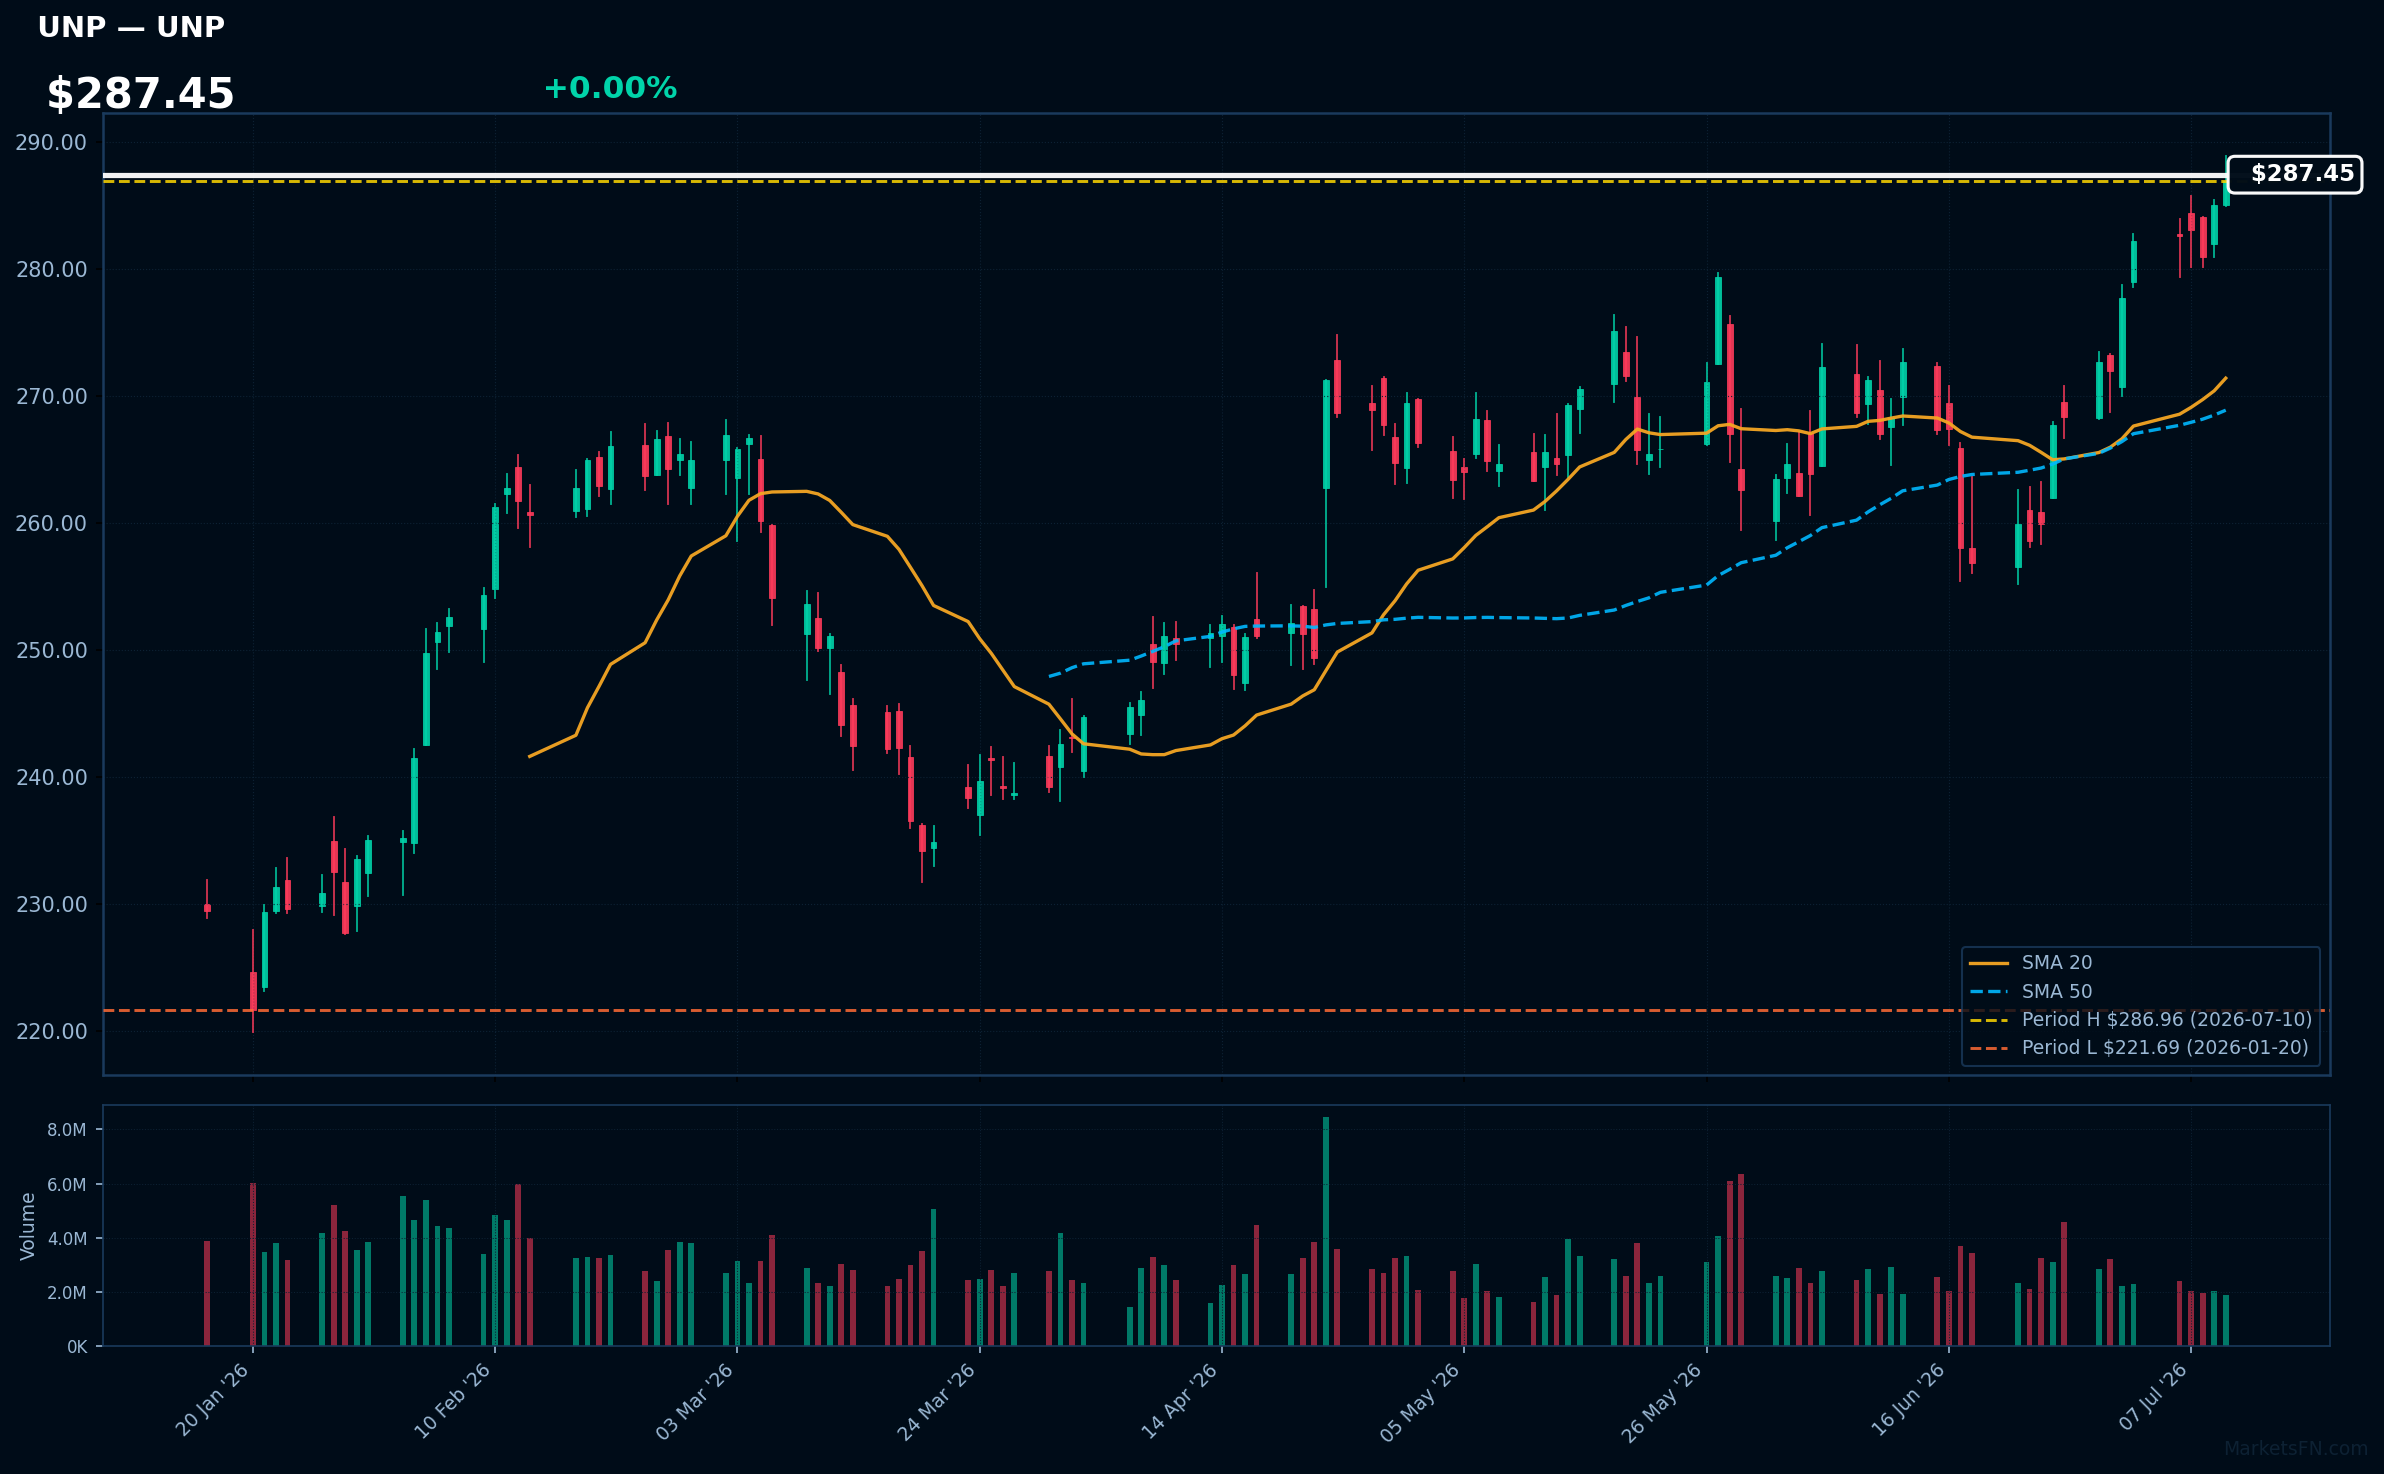
UNP | Union Pacific Corp | Industrials | Price Last: $286.96 | % Realized: +23.74% | RSI: 68.4 | % above MA200: +16.5% | Trend: Above MA20, MA50, MA200
Union Pacific Corp (UNP) operates North America's largest railroad network, transporting goods like coal, chemicals, and agricultural products. Investors should care because UNP's rail network is critical to US supply chains, and its performance can indicate broader economic trends.
UNP's technicals indicate momentum: RSI(14) is 68.4, and MA alignment is bullish with price > MA20 > MA50 > MA200. The stock is 0.0% below its 2026 YTD high, suggesting a potential breakout.
Related headlines
- EXCLUSIVE: Union Pacific, Norfolk Southern CEOs talk about the rail merger that could reshape the U.S. economy
- Union Pacific, Norfolk Southern submit more merger data
- Union Pacific and Norfolk Southern Respond to STB's Request for Supplemental Information, Submitting First Round of Their Responses
- Union Pacific and Norfolk Southern Celebrate Americas 250th Anniversary with Worlds Largest Steam Locomotive in Philadelphia
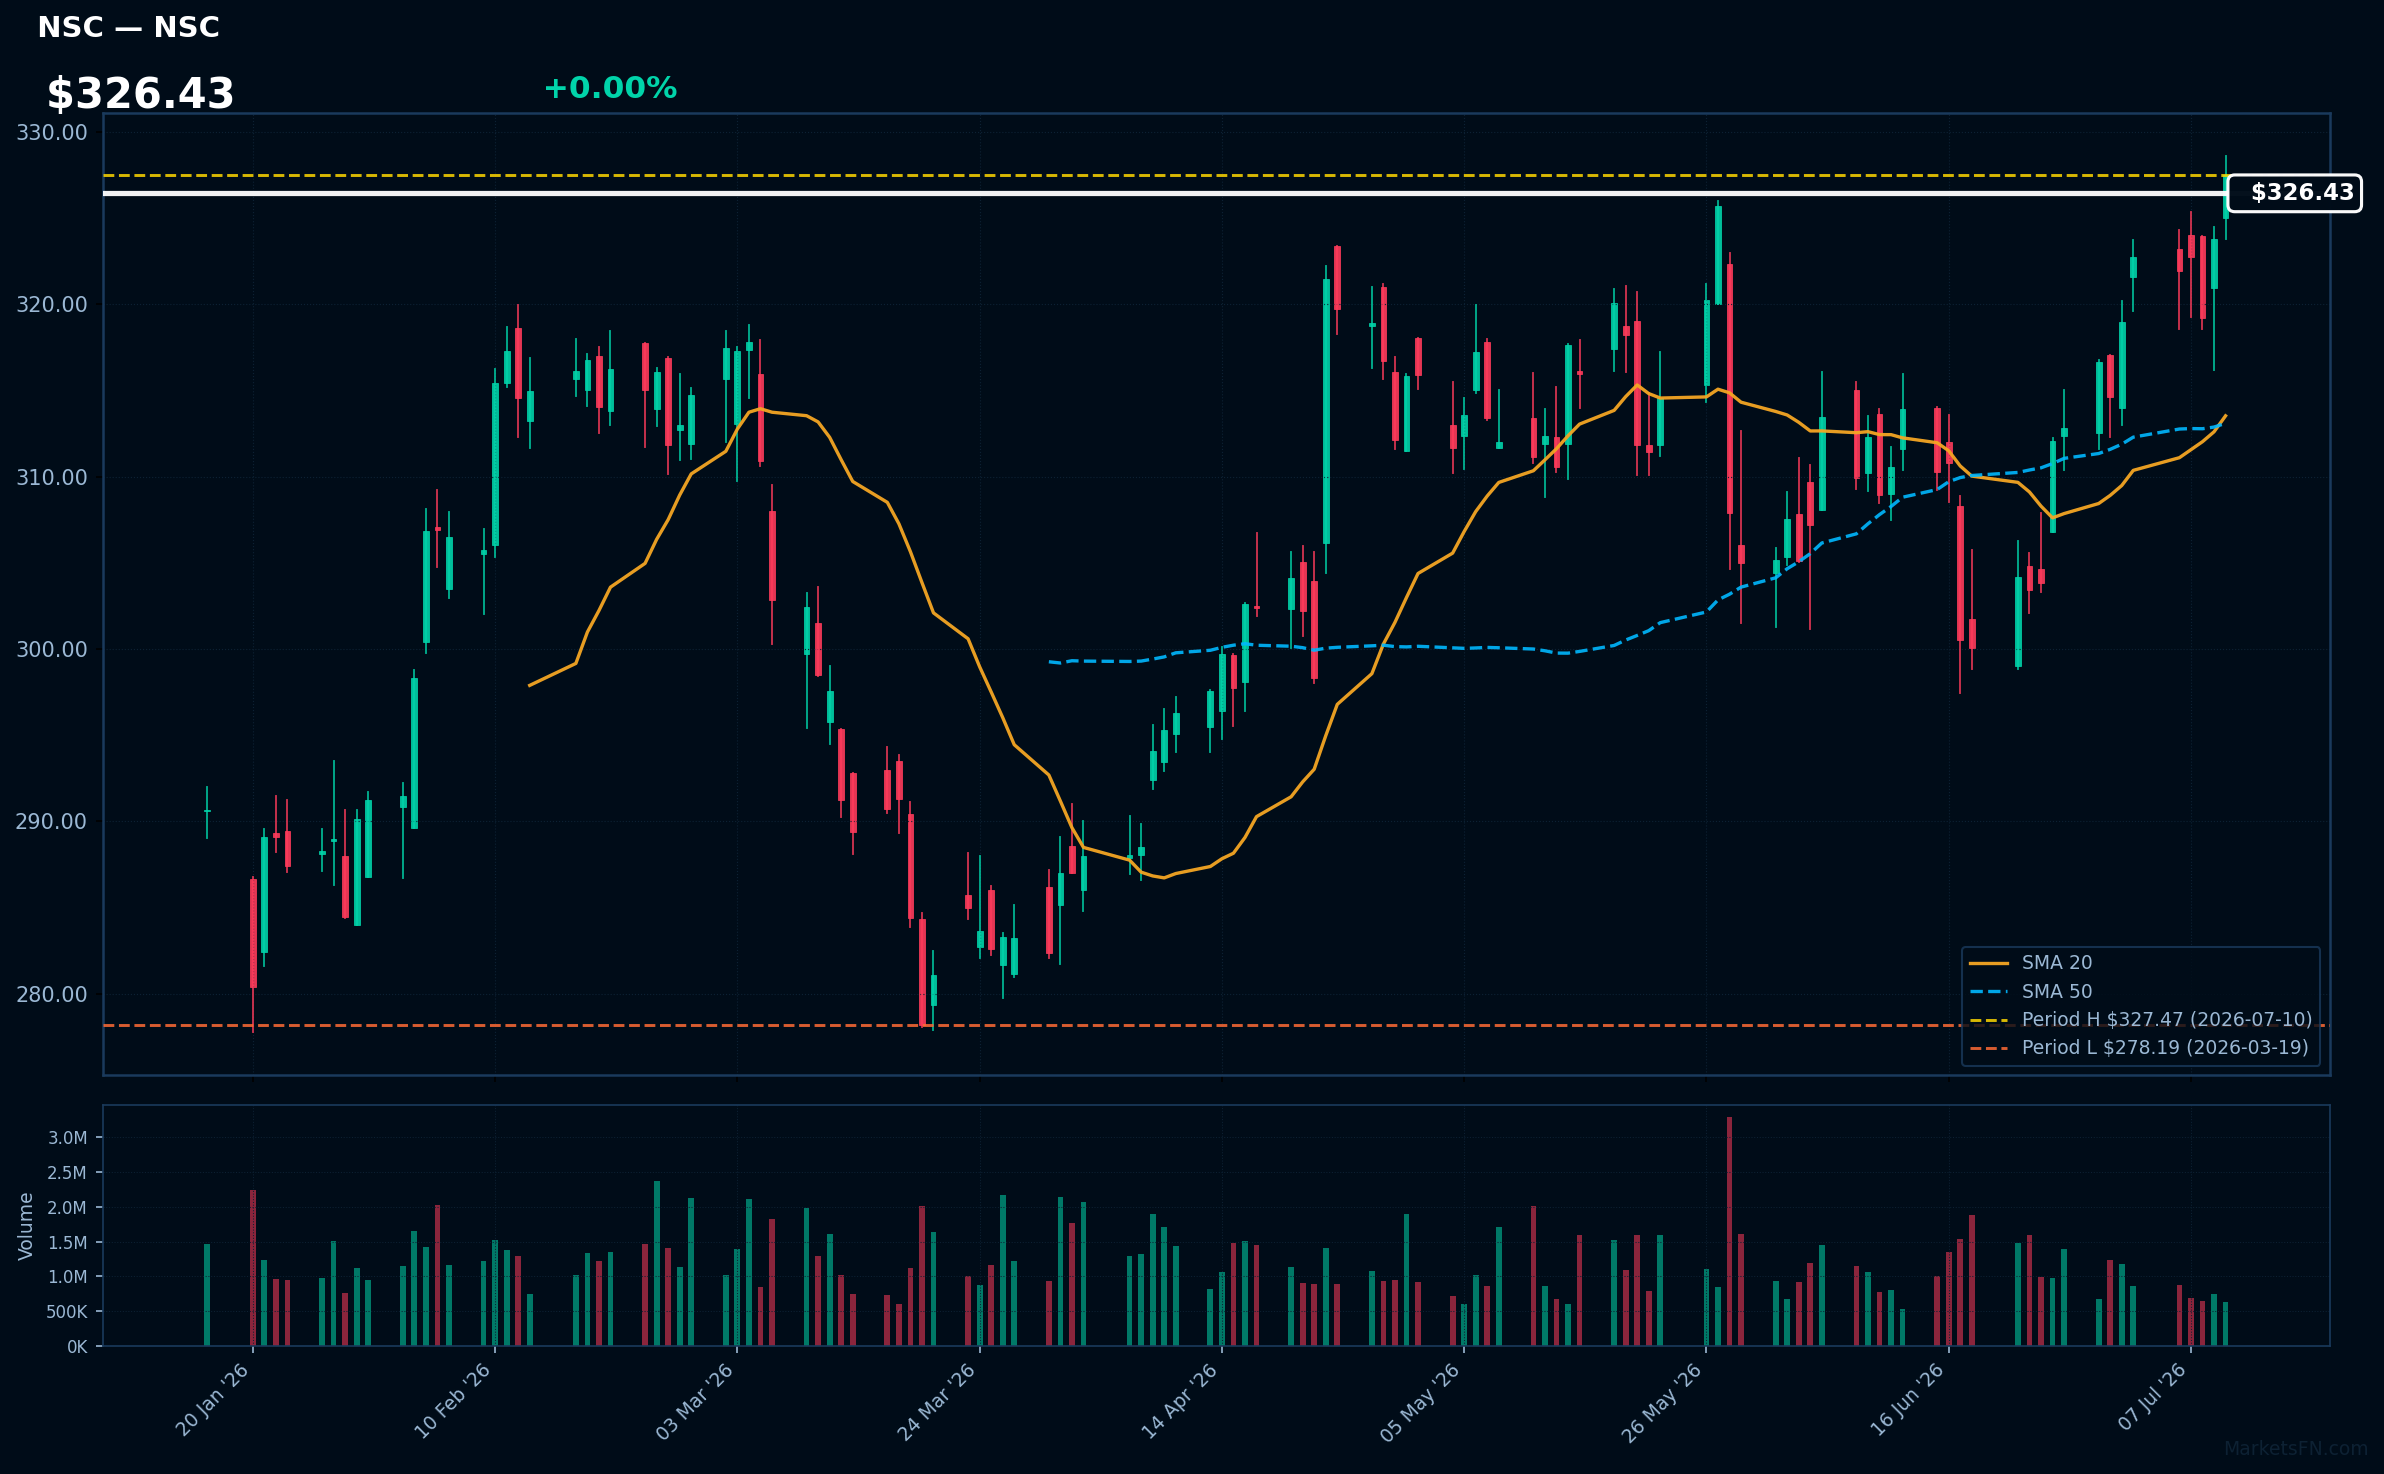
NSC | Norfolk Southern Corp | Industrials | Price Last: $327.47 | % Realized: +13.78% | RSI: 63.3 | % above MA200: +9.5% | Trend: Above MA20, MA50, MA200
Norfolk Southern Corp operates a rail network transporting coal, crude oil, and intermodal containers. Investors should care about its operational efficiency and market share in the rail industry, as these factors directly impact revenue and profitability.
NSC's RSI(14) is 63.3, indicating rising momentum. The MA alignment (price > MA20 > MA50 > MA200) suggests a sustained uptrend. With the stock 0.0% below its 2026 YTD high, it nears a potential breakout level, reinforcing the bullish technical picture.
Related headlines
- EXCLUSIVE: Union Pacific, Norfolk Southern CEOs talk about the rail merger that could reshape the U.S. economy
- Union Pacific, Norfolk Southern submit more merger data
- Union Pacific and Norfolk Southern Respond to STB's Request for Supplemental Information, Submitting First Round of Their Responses
- Union Pacific and Norfolk Southern Celebrate Americas 250th Anniversary with Worlds Largest Steam Locomotive in Philadelphia
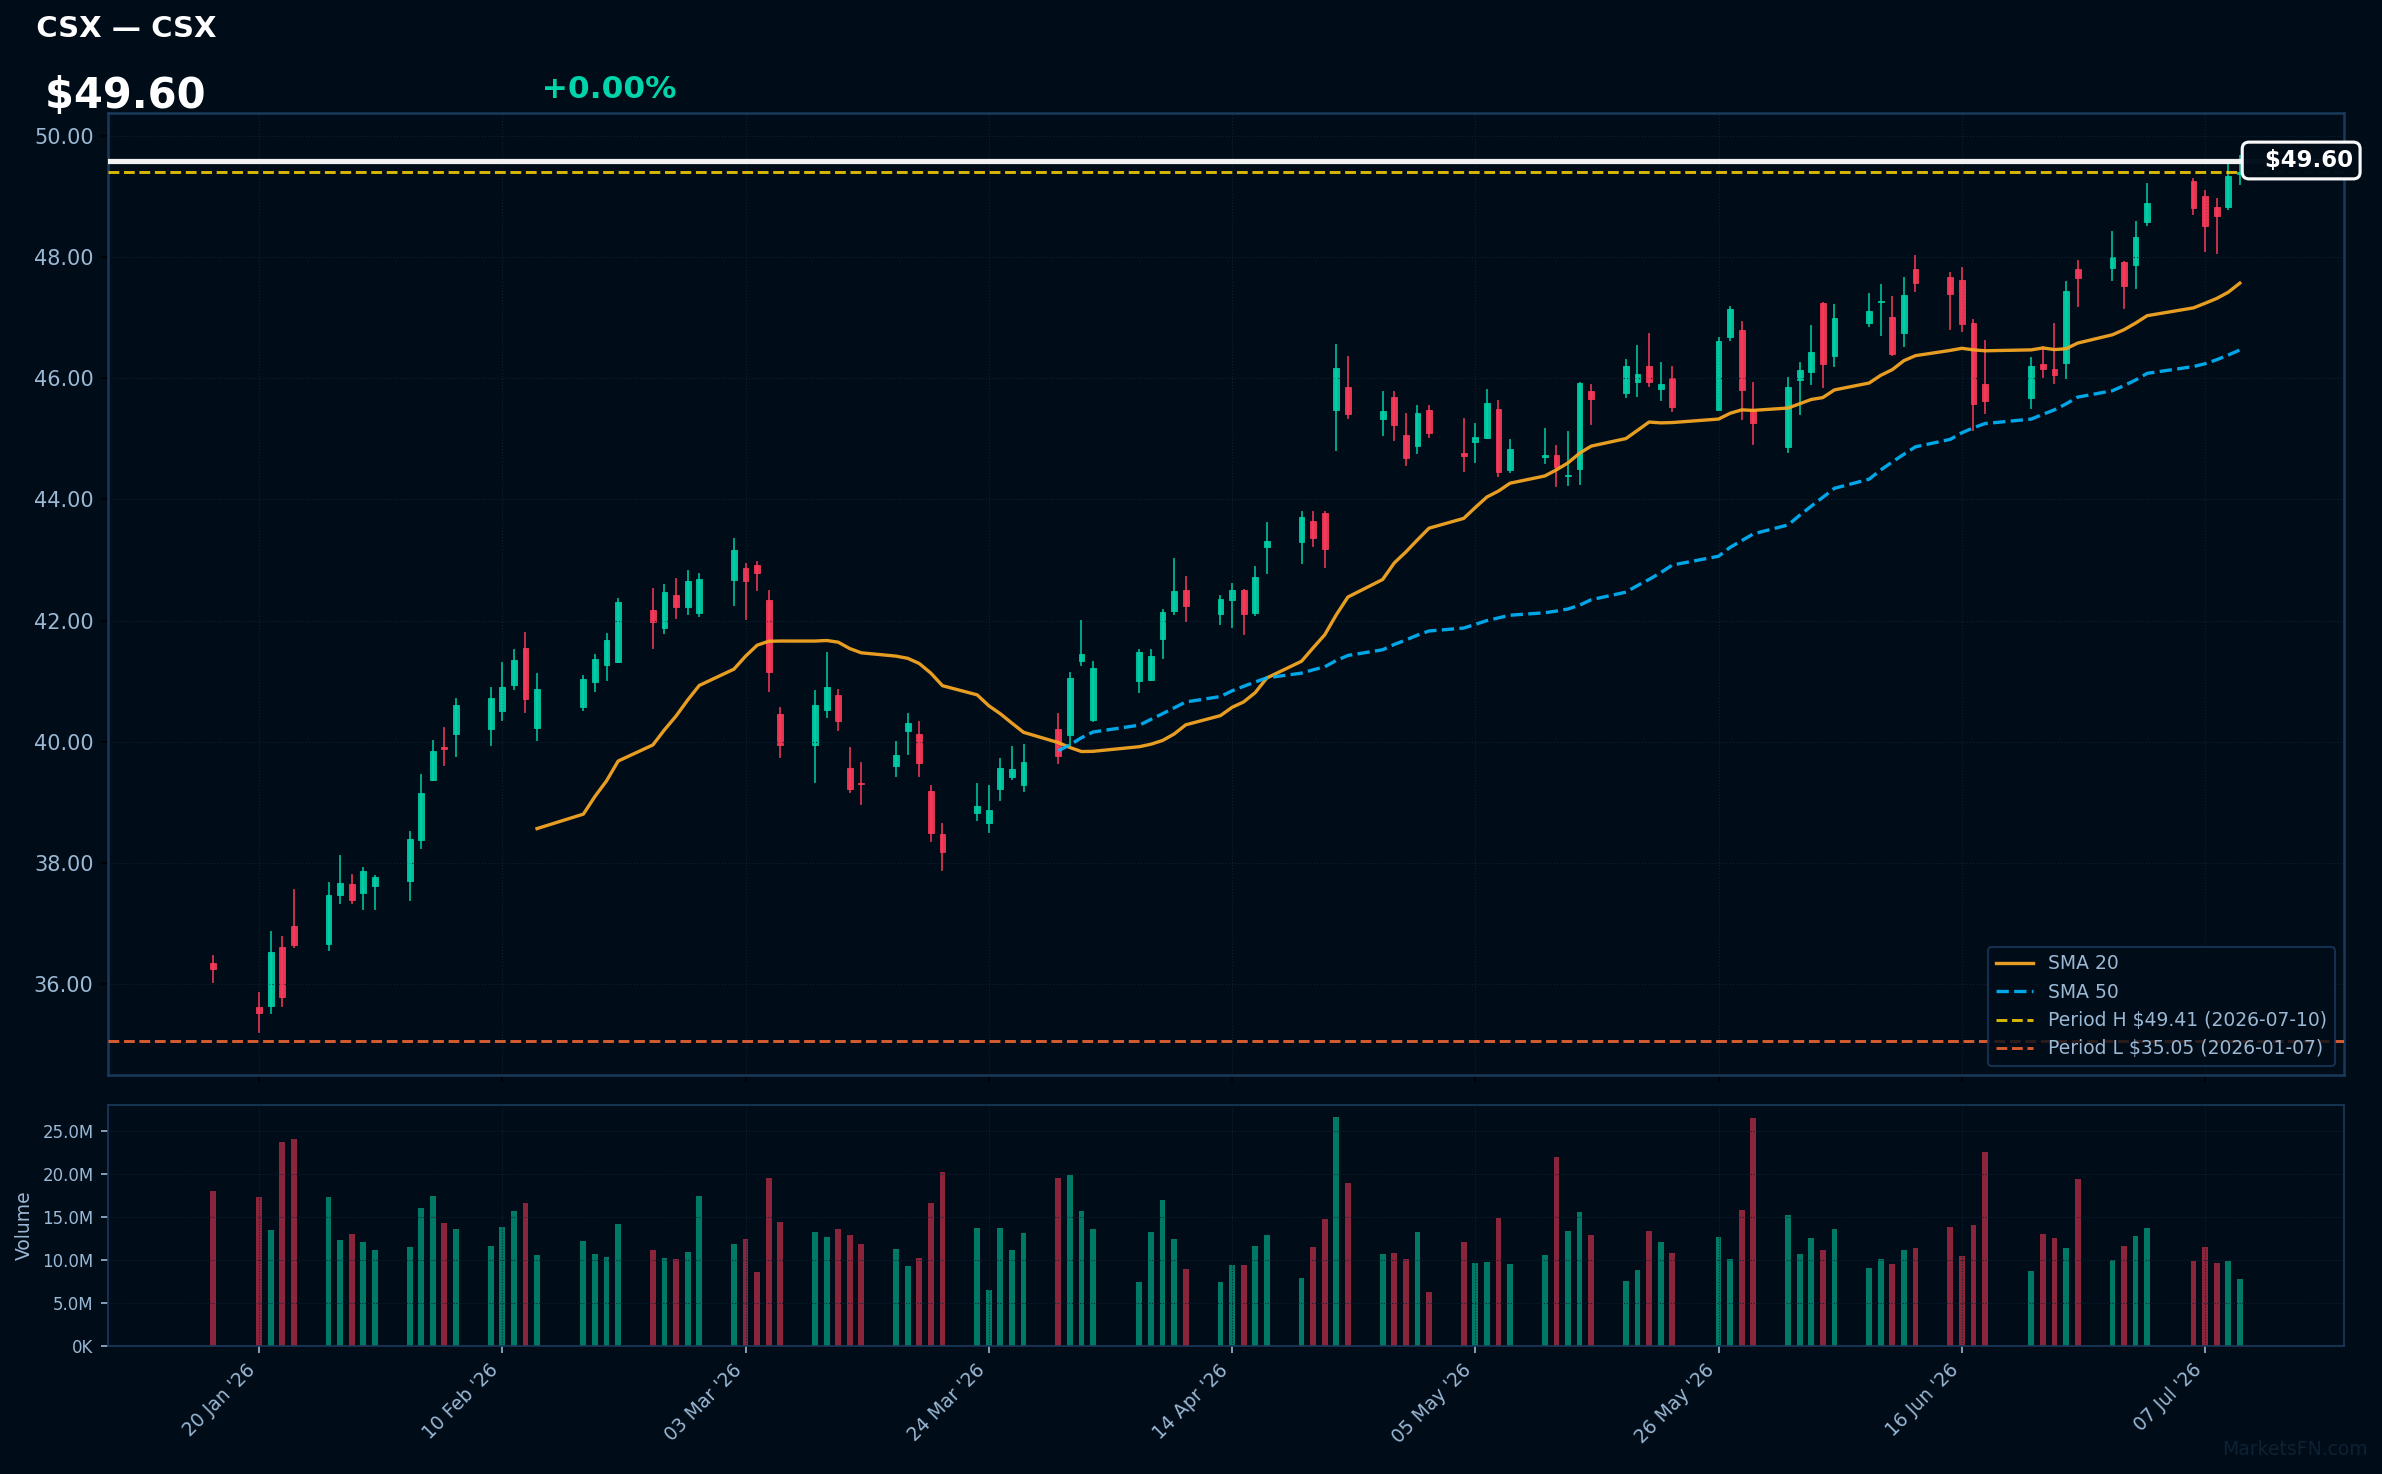
CSX | CSX Corp | Industrials | Price Last: $49.41 | % Realized: +36.23% | RSI: 68.3 | % above MA200: +22.8% | Trend: Above MA20, MA50, MA200
CSX Corp operates a rail network transporting coal, intermodal containers, and automotive goods, making it a key player in North American freight. Investors should care as its performance reflects industrial demand and economic activity.
CSX is in a sustained uptrend with price > MA20 > MA50 > MA200, RSI(14) at 68.3, and is 0.0% below its 2026 YTD high, indicating strong momentum with potential for breakout.
Related headlines
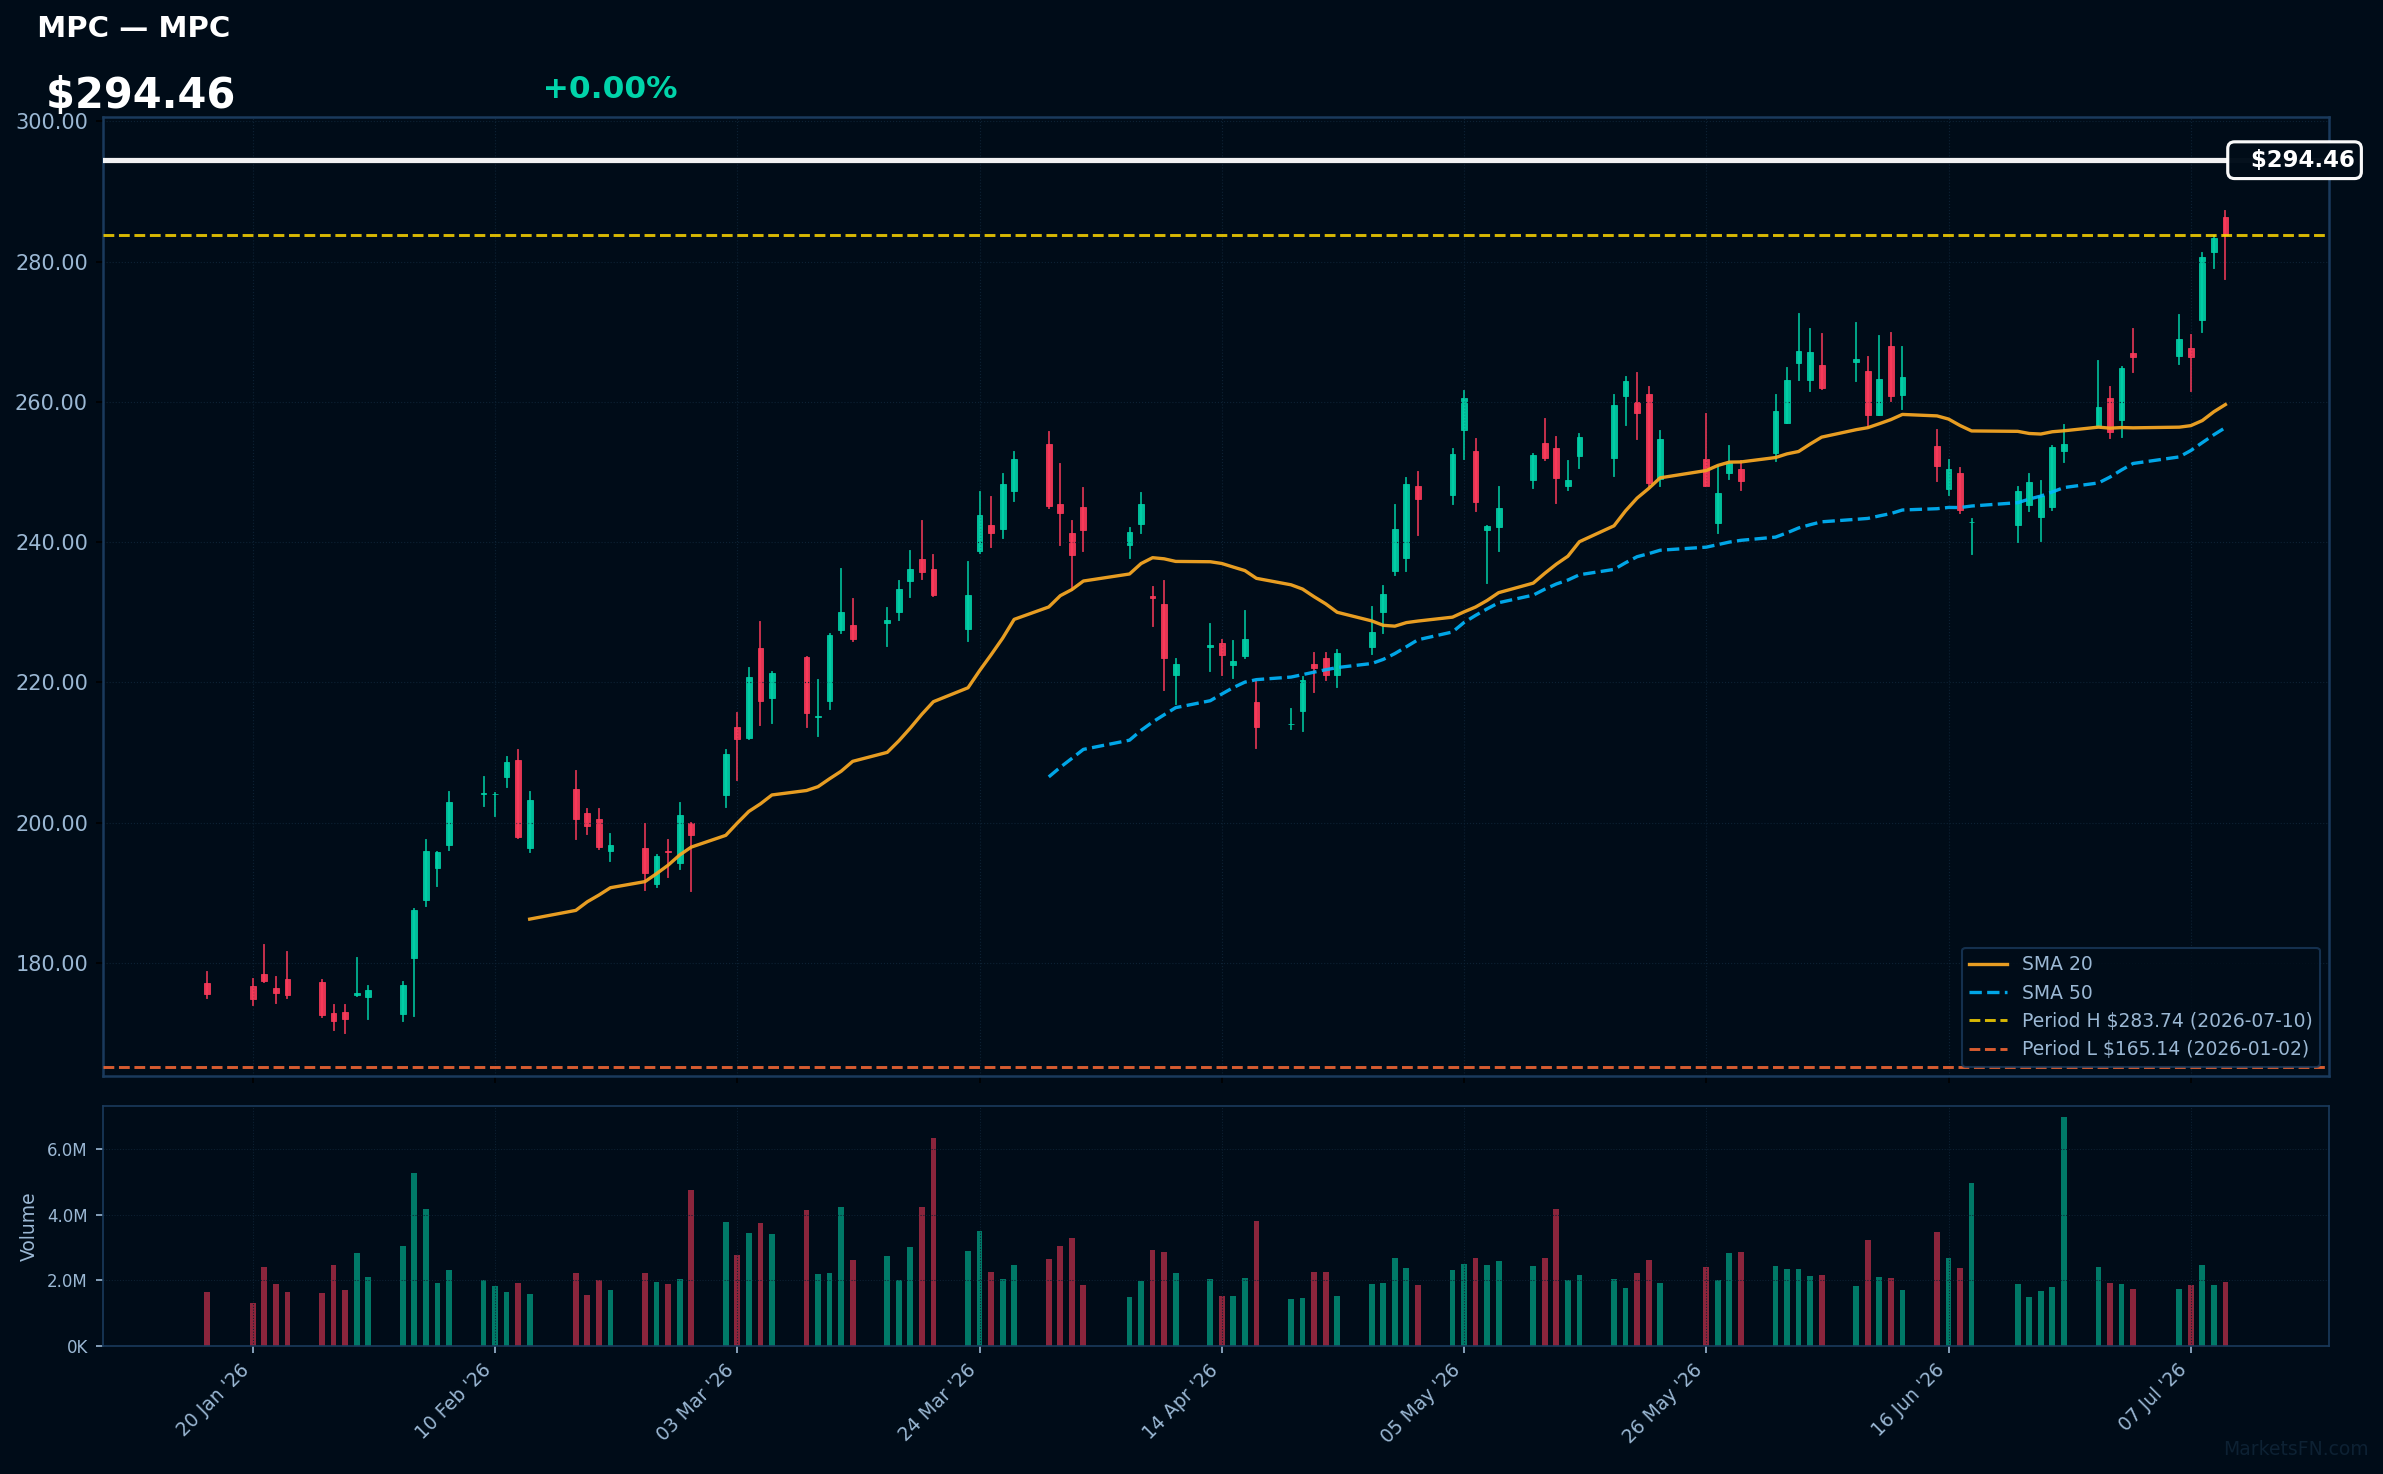
MPC | Marathon Petroleum Corp | Energy | Price Last: $283.74 | % Realized: +71.82% | RSI: 74.4 | % above MA200: +32.9% | Trend: Above MA20, MA50, MA200
Marathon Petroleum Corp is a refining and marketing company, operating refineries and distributing petroleum products. Investors should care about its refining capacity, product demand, and margin trends, as these drive profitability.
MPC's RSI(14) is 74.4, nearing overbought territory. Bullish MA alignment (price > MA20 > MA50 > MA200) indicates a sustained uptrend. The stock is 0.0% below its 2026 YTD high, suggesting potential breakout momentum.
Related headlines
- BP, Marathon, 7-Eleven, Walmart sued for allegedly using AI to boost California gas prices
- Marathon Petroleum Corp. to Report Second-Quarter Financial Results on August 4, 2026
- Marathon Petroleum Corp. names Brian Worthington vice president, Investor Relations; Kristina Kazarian to become vice president, Finance and Treasurer
- MPC- A US Refiner Benefitting from Tighter Jet Fuel Market
📉 Nearest to 2026 Low
Sectors represented: Real Estate (2), Industrials (1), Energy (1), Basic Materials (1)
| Ticker | Company | Sector | Price Last | % Realized | 2026 YTD Low Date | RSI | % above MA200 | Trend |
|---|---|---|---|---|---|---|---|---|
| CPRT | Copart, Inc | Industrials | $27.52 | -27.14% | 2026-07-10 | 37.0 | -25.6% | Below MA20, MA50, MA200 |
| EQT | EQT Corp | Energy | $48.85 | -8.62% | 2026-07-10 | 32.5 | -13.7% | Below MA20, MA50, MA200 |
| ALB | Albemarle Corp | Basic Materials | $126.05 | -12.42% | 2026-07-10 | 29.8 | -16.2% | Below MA20, MA50, MA200 |
| CSGP | Costar Group, Inc | Real Estate | $28.39 | -56.78% | 2026-06-30 | 43.0 | -45.9% | Below MA20, MA50, MA200 |
| VICI | VICI Properties Inc | Real Estate | $26.01 | -7.60% | 2026-07-09 | 42.6 | -9.7% | Below MA20, MA50, MA200 |
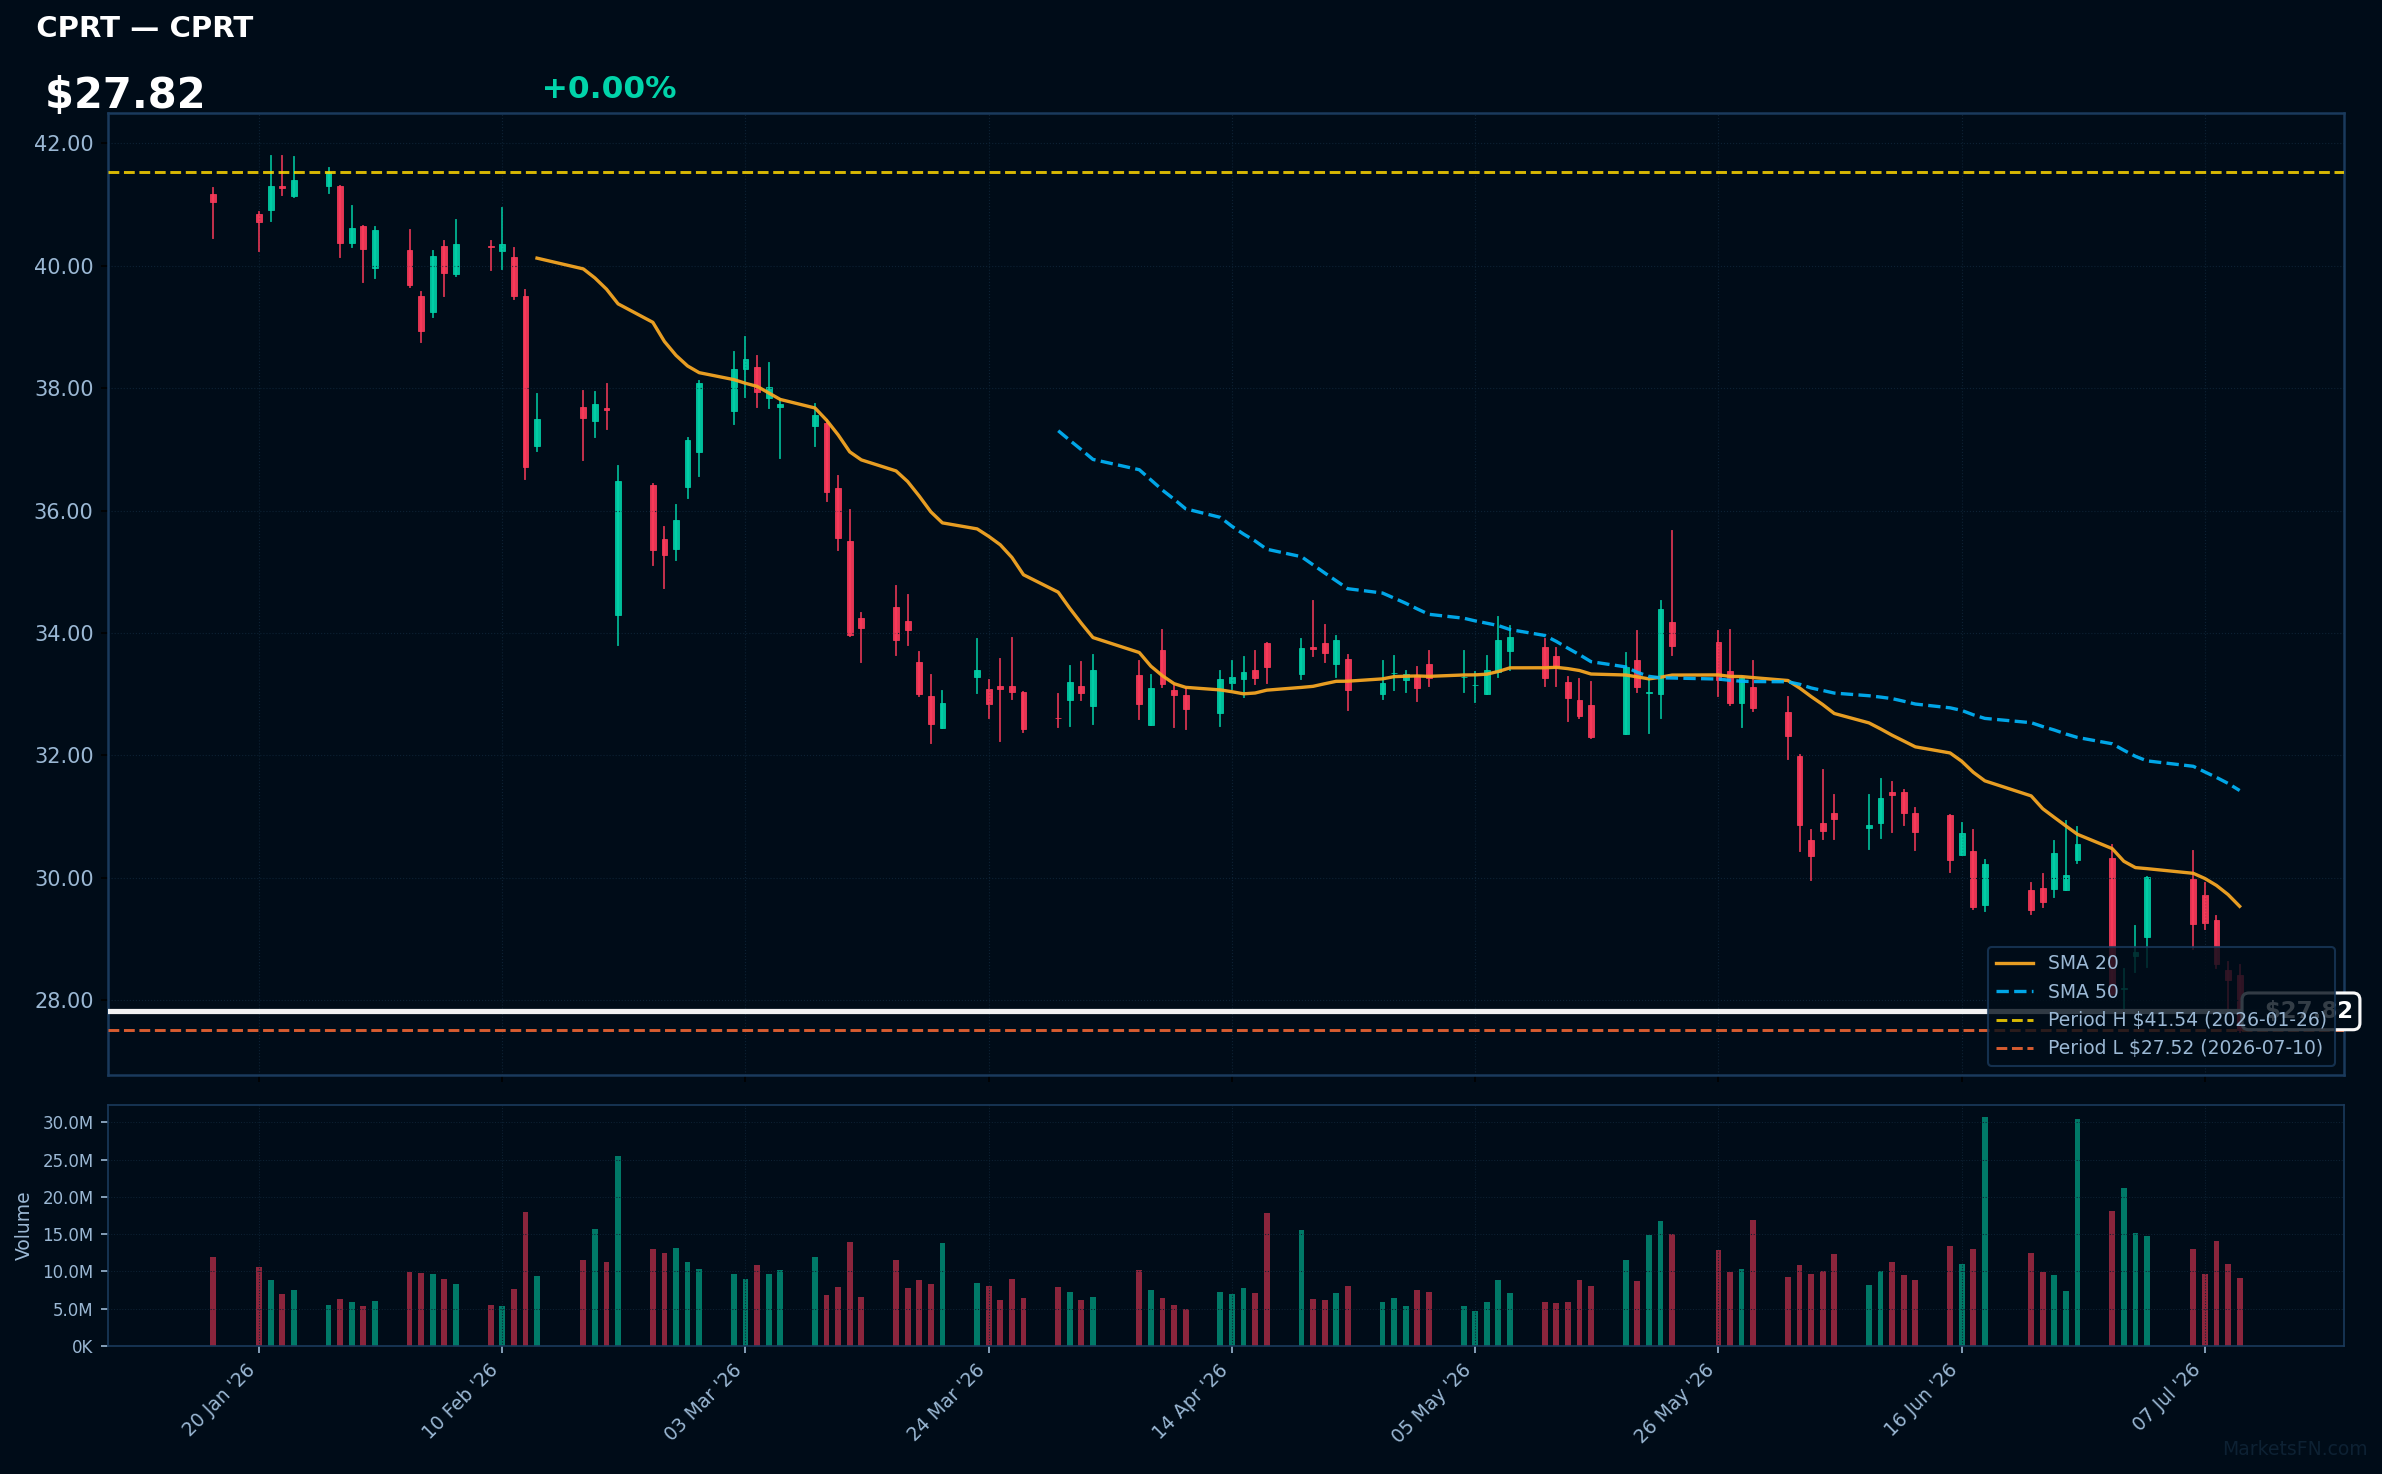
CPRT | Copart, Inc | Industrials | Price Last: $27.52 | % Realized: -27.14% | RSI: 37.0 | % above MA200: -25.6% | Trend: Below MA20, MA50, MA200
Copart, Inc operates online vehicle auction platforms and provides remarketing services for salvage and used vehicles to insurance companies, charities, and other organizations, making it a key player in the vehicle disposal and redistribution market.
Copart's technicals indicate a sustained downtrend with price at $27.82 below all key MAs (MA20, MA50, MA200) and RSI(14) at 37.0, suggesting weakening momentum and testing major support at its 2026 YTD low.
Related headlines
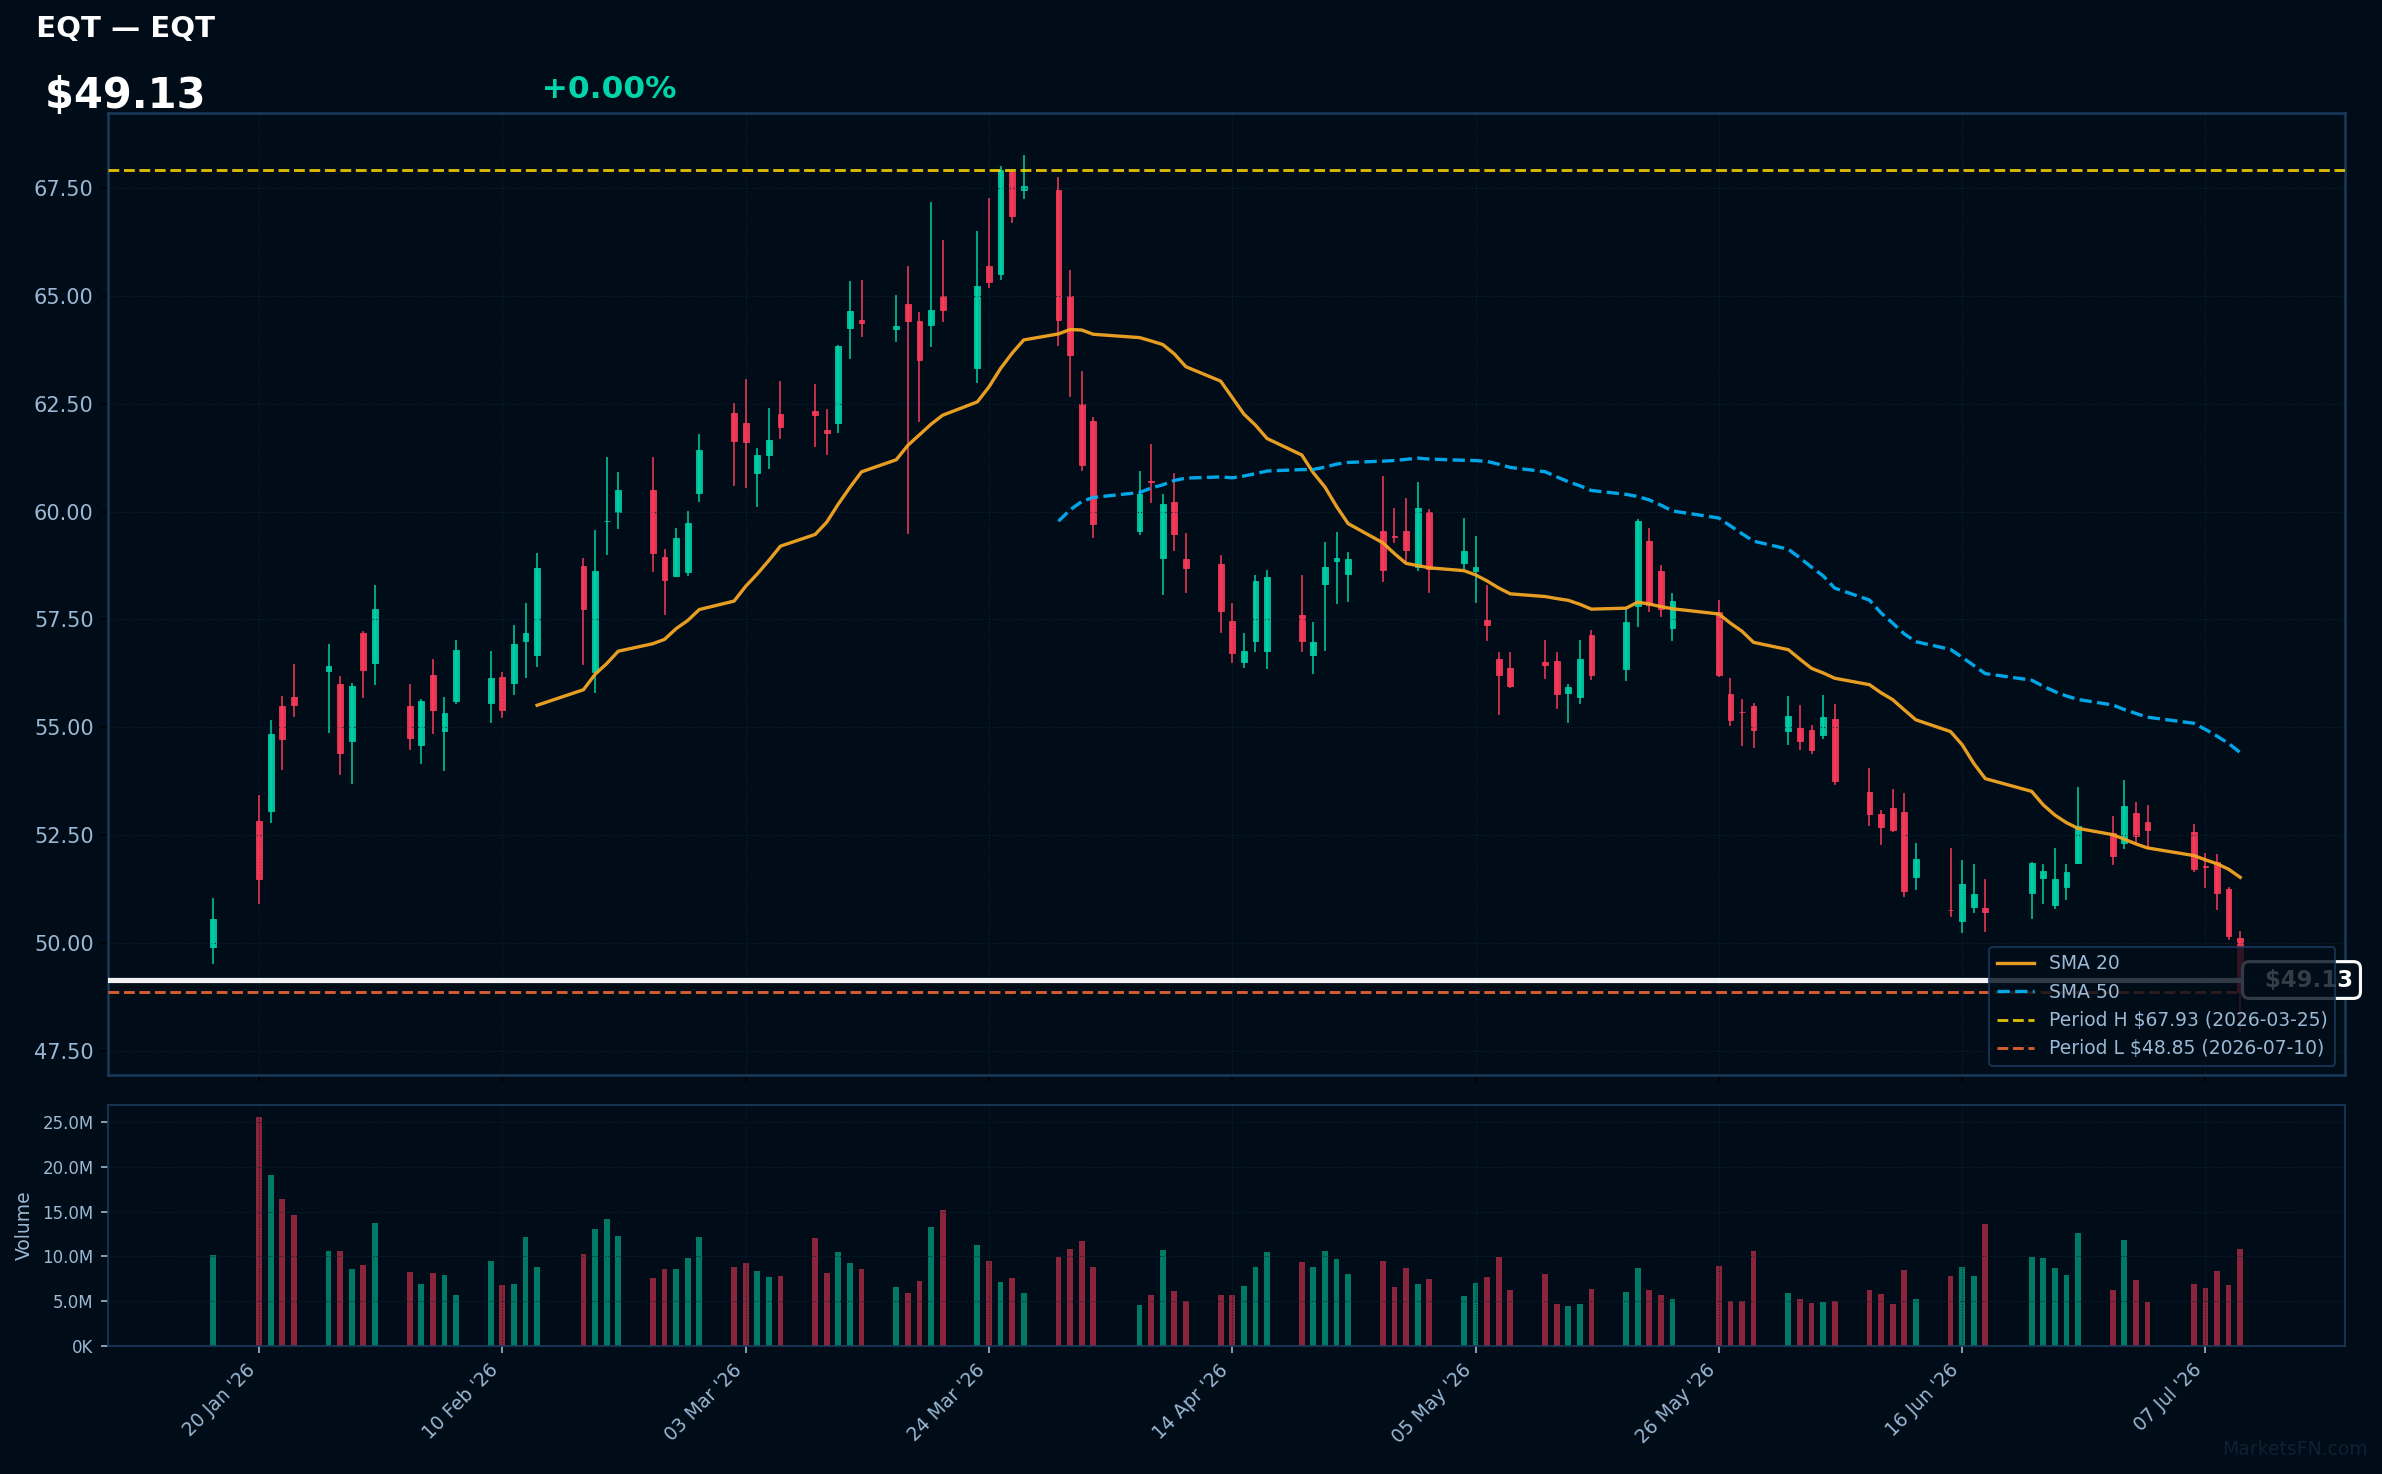
EQT | EQT Corp | Energy | Price Last: $48.85 | % Realized: -8.62% | RSI: 32.5 | % above MA200: -13.7% | Trend: Below MA20, MA50, MA200
EQT Corp is a natural gas producer. Investors should care because its production levels and pricing directly impact revenue; however, the specific operational details are not provided in the given data.
EQT Corp's technicals indicate a sustained downtrend with price ($49.13) below all MAs (MA20, MA50, MA200), RSI(14) at 32.5, and testing major support at its 2026 YTD low, suggesting a warning sign.
Related headlines
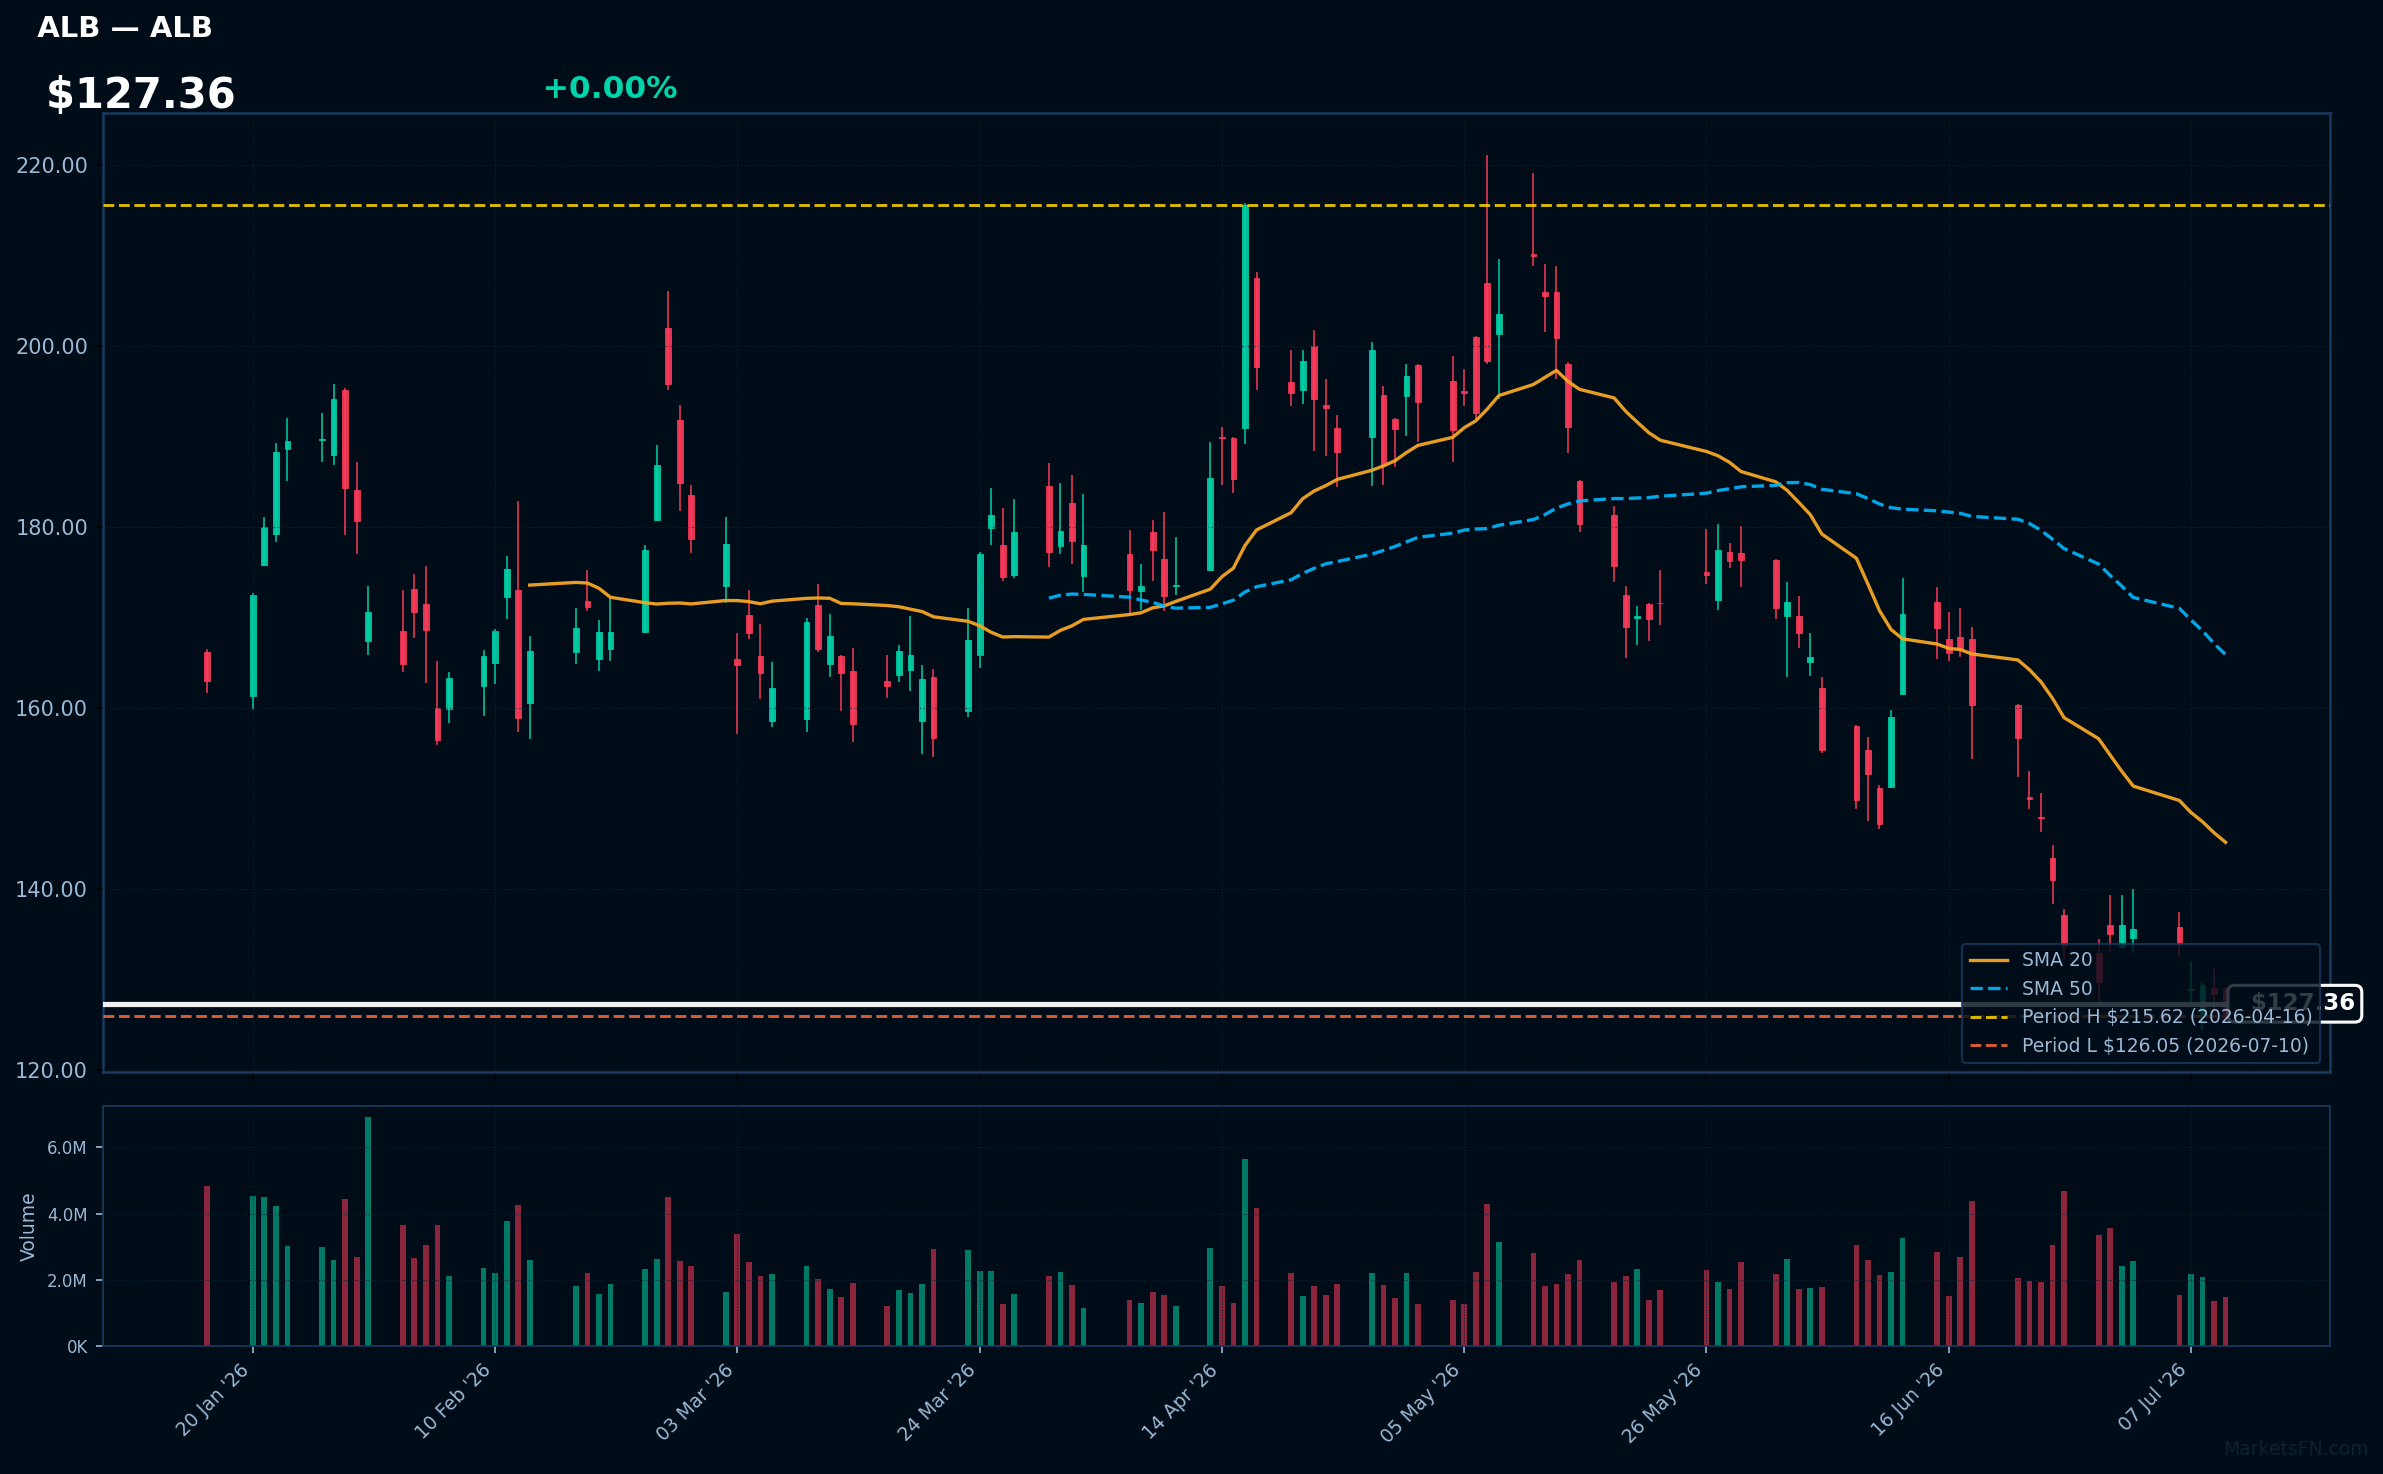
ALB | Albemarle Corp | Basic Materials | Price Last: $126.05 | % Realized: -12.42% | RSI: 29.8 | % above MA200: -16.2% | Trend: Below MA20, MA50, MA200
Albemarle Corp (ALB) is a leading producer of lithium, bromine, and refining catalysts. Investors care due to its critical role in lithium-ion battery production for electric vehicles, making its performance sensitive to trends in the EV and energy storage sectors.
ALB's technical situation indicates a potential warning sign with an RSI(14) of 29.8, suggesting oversold conditions, and the price below MA20, MA50, and MA200, showing bearish alignment. The stock is at its 2026 YTD low, having returned -12.4% YTD.
Related headlines
- Albemarle Corporation to Release Second Quarter 2026 Earnings Results on Wednesday, August 5, 2026
- Albemarle Corp. stock outperforms competitors on strong trading day
- Albemarle Corp. stock underperforms Friday when compared to competitors
- Albemarle Corp. stock underperforms Thursday when compared to competitors
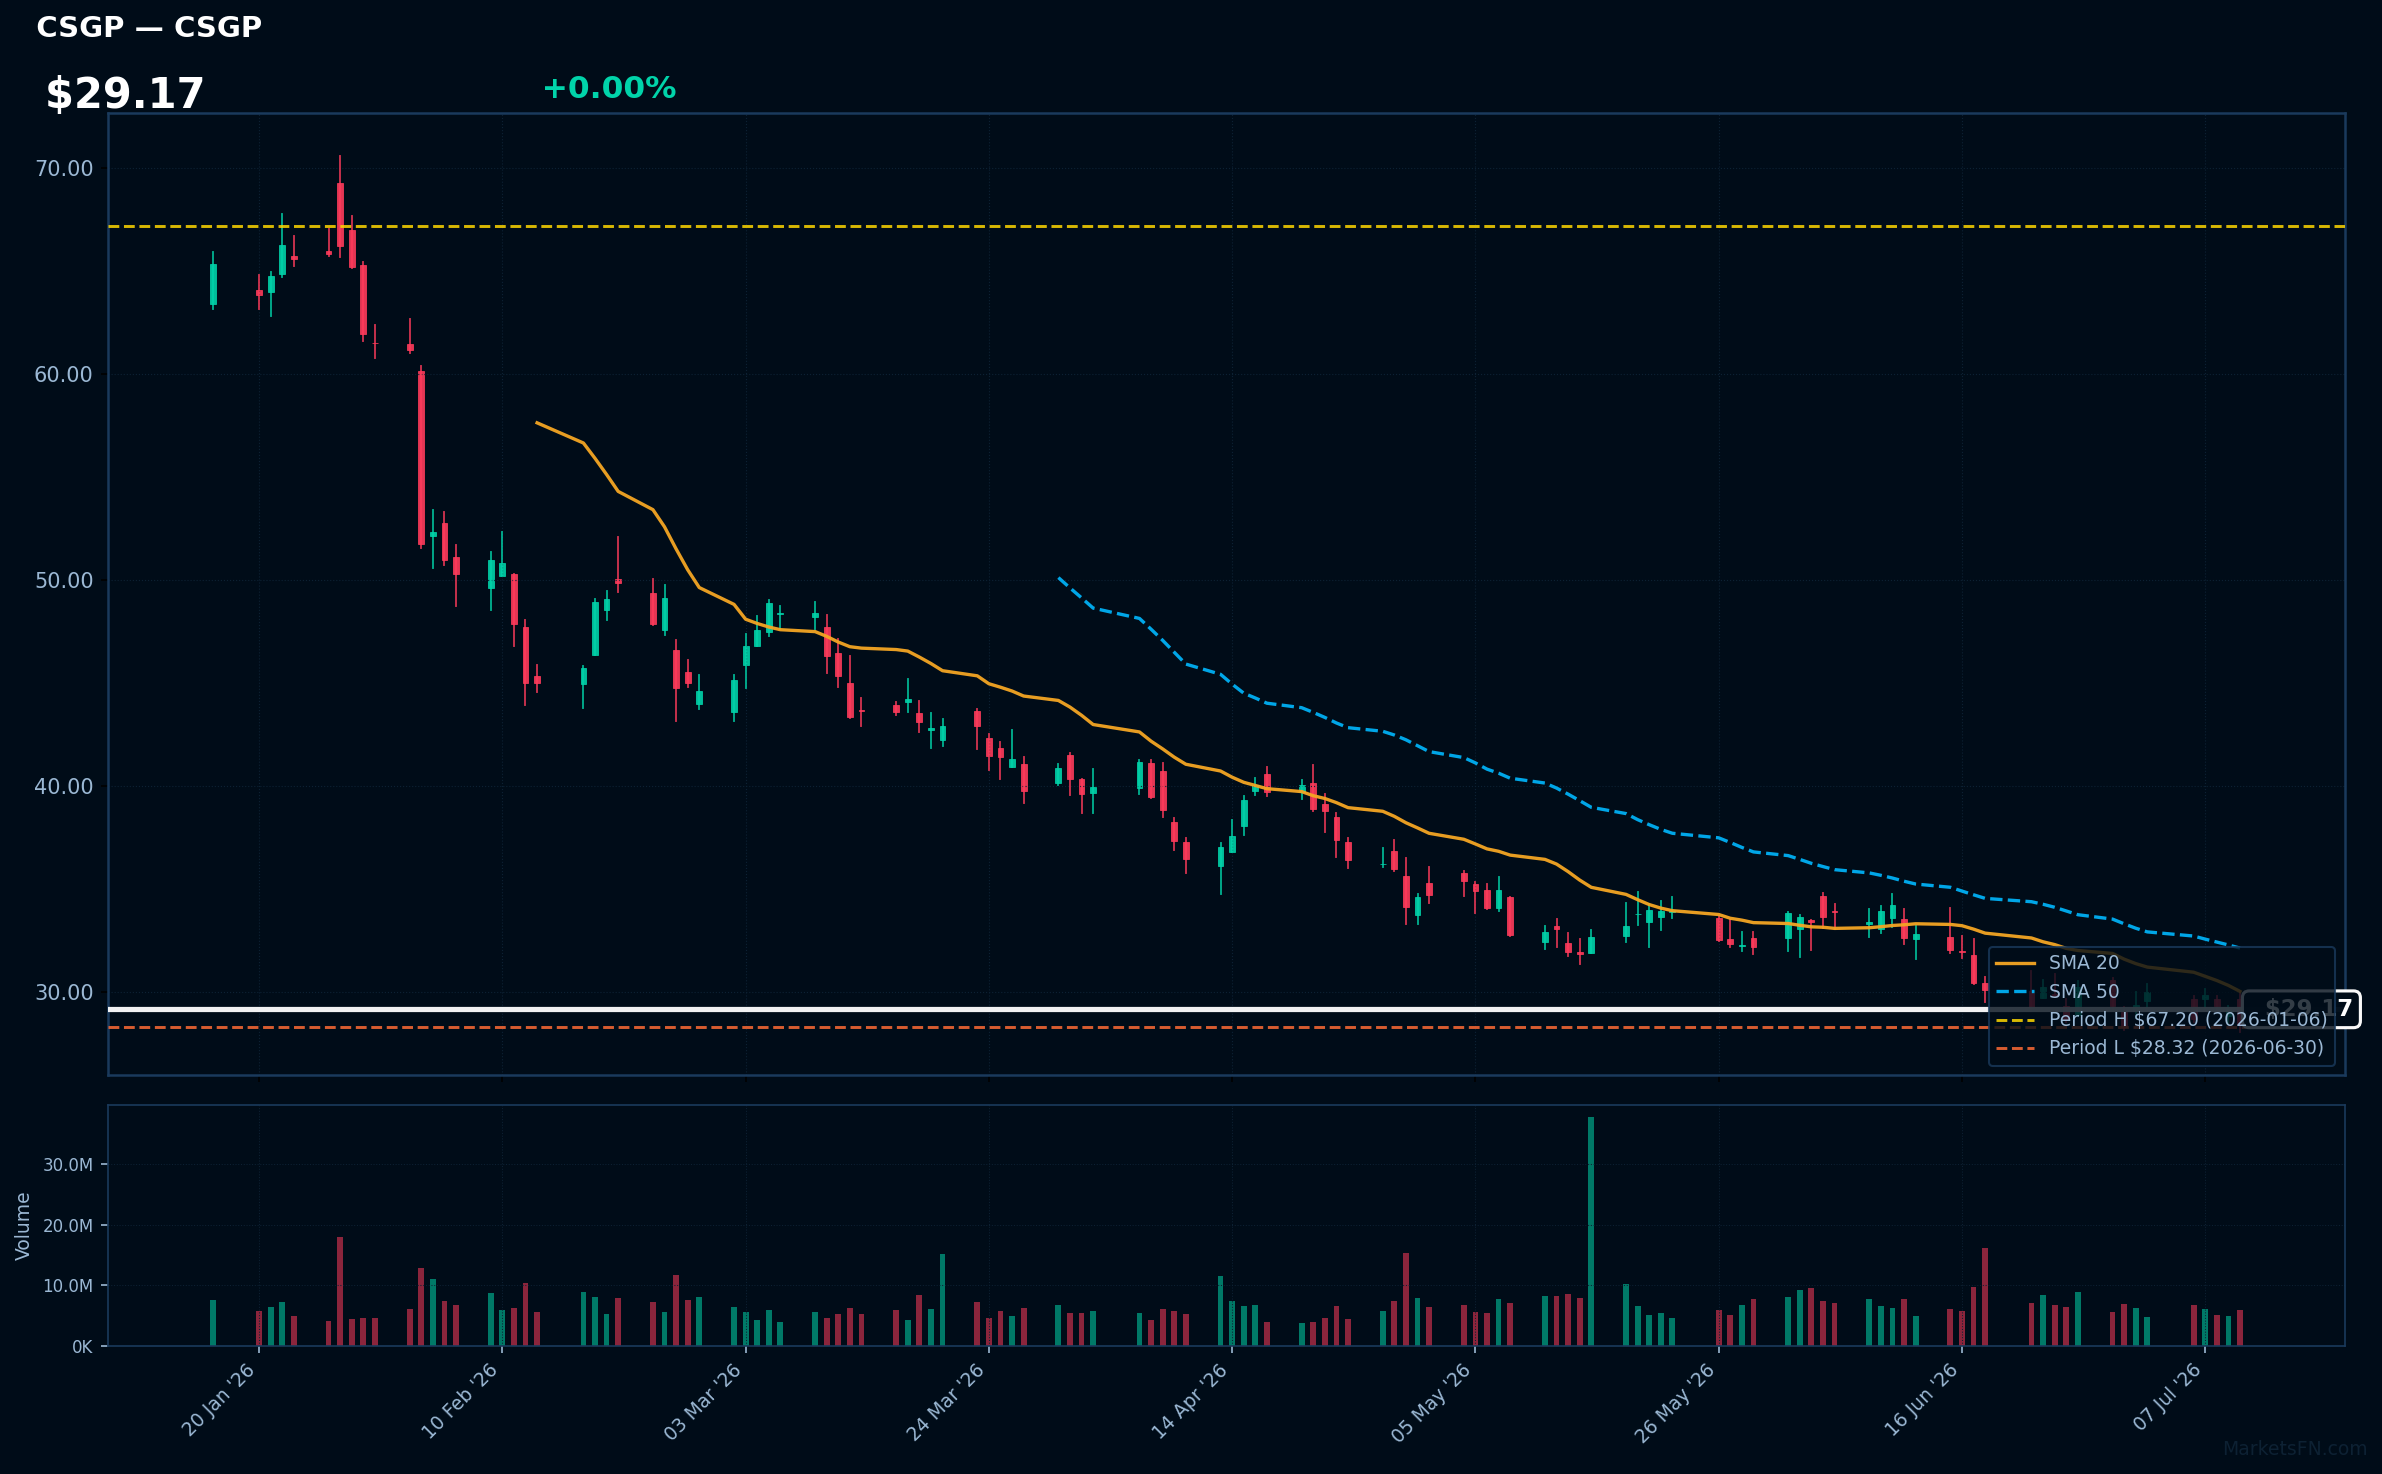
CSGP | Costar Group, Inc | Real Estate | Price Last: $28.39 | % Realized: -56.78% | RSI: 43.0 | % above MA200: -45.9% | Trend: Below MA20, MA50, MA200
Costar Group, Inc provides commercial real estate information, analytics, and marketing services. Investors should care because its data and platform influence property market dynamics, making it a key player in the $1.4 trillion US commercial real estate market.
CSGP is testing major support at its 2026 YTD low, with RSI(14) at 43.0 indicating neutral momentum. Bearish MA alignment (price < MA20 < MA50 < MA200) and -56.8% 2026 YTD return signal a sustained downtrend, potentially a warning sign.
Related headlines
- CoStar Group Announces Launch of CoStar Platform in France
- CoStar Group to Report Financial Results for Second Quarter on July 28, 2026
- CoStar Group Invests in Wikicasa, Italys Agent-Backed Real Estate Marketplace
- CoStar Group Stockholders Overwhelmingly Reelect Director Nominees and Support Say-on-Pay at Annual Meeting of Stockholders
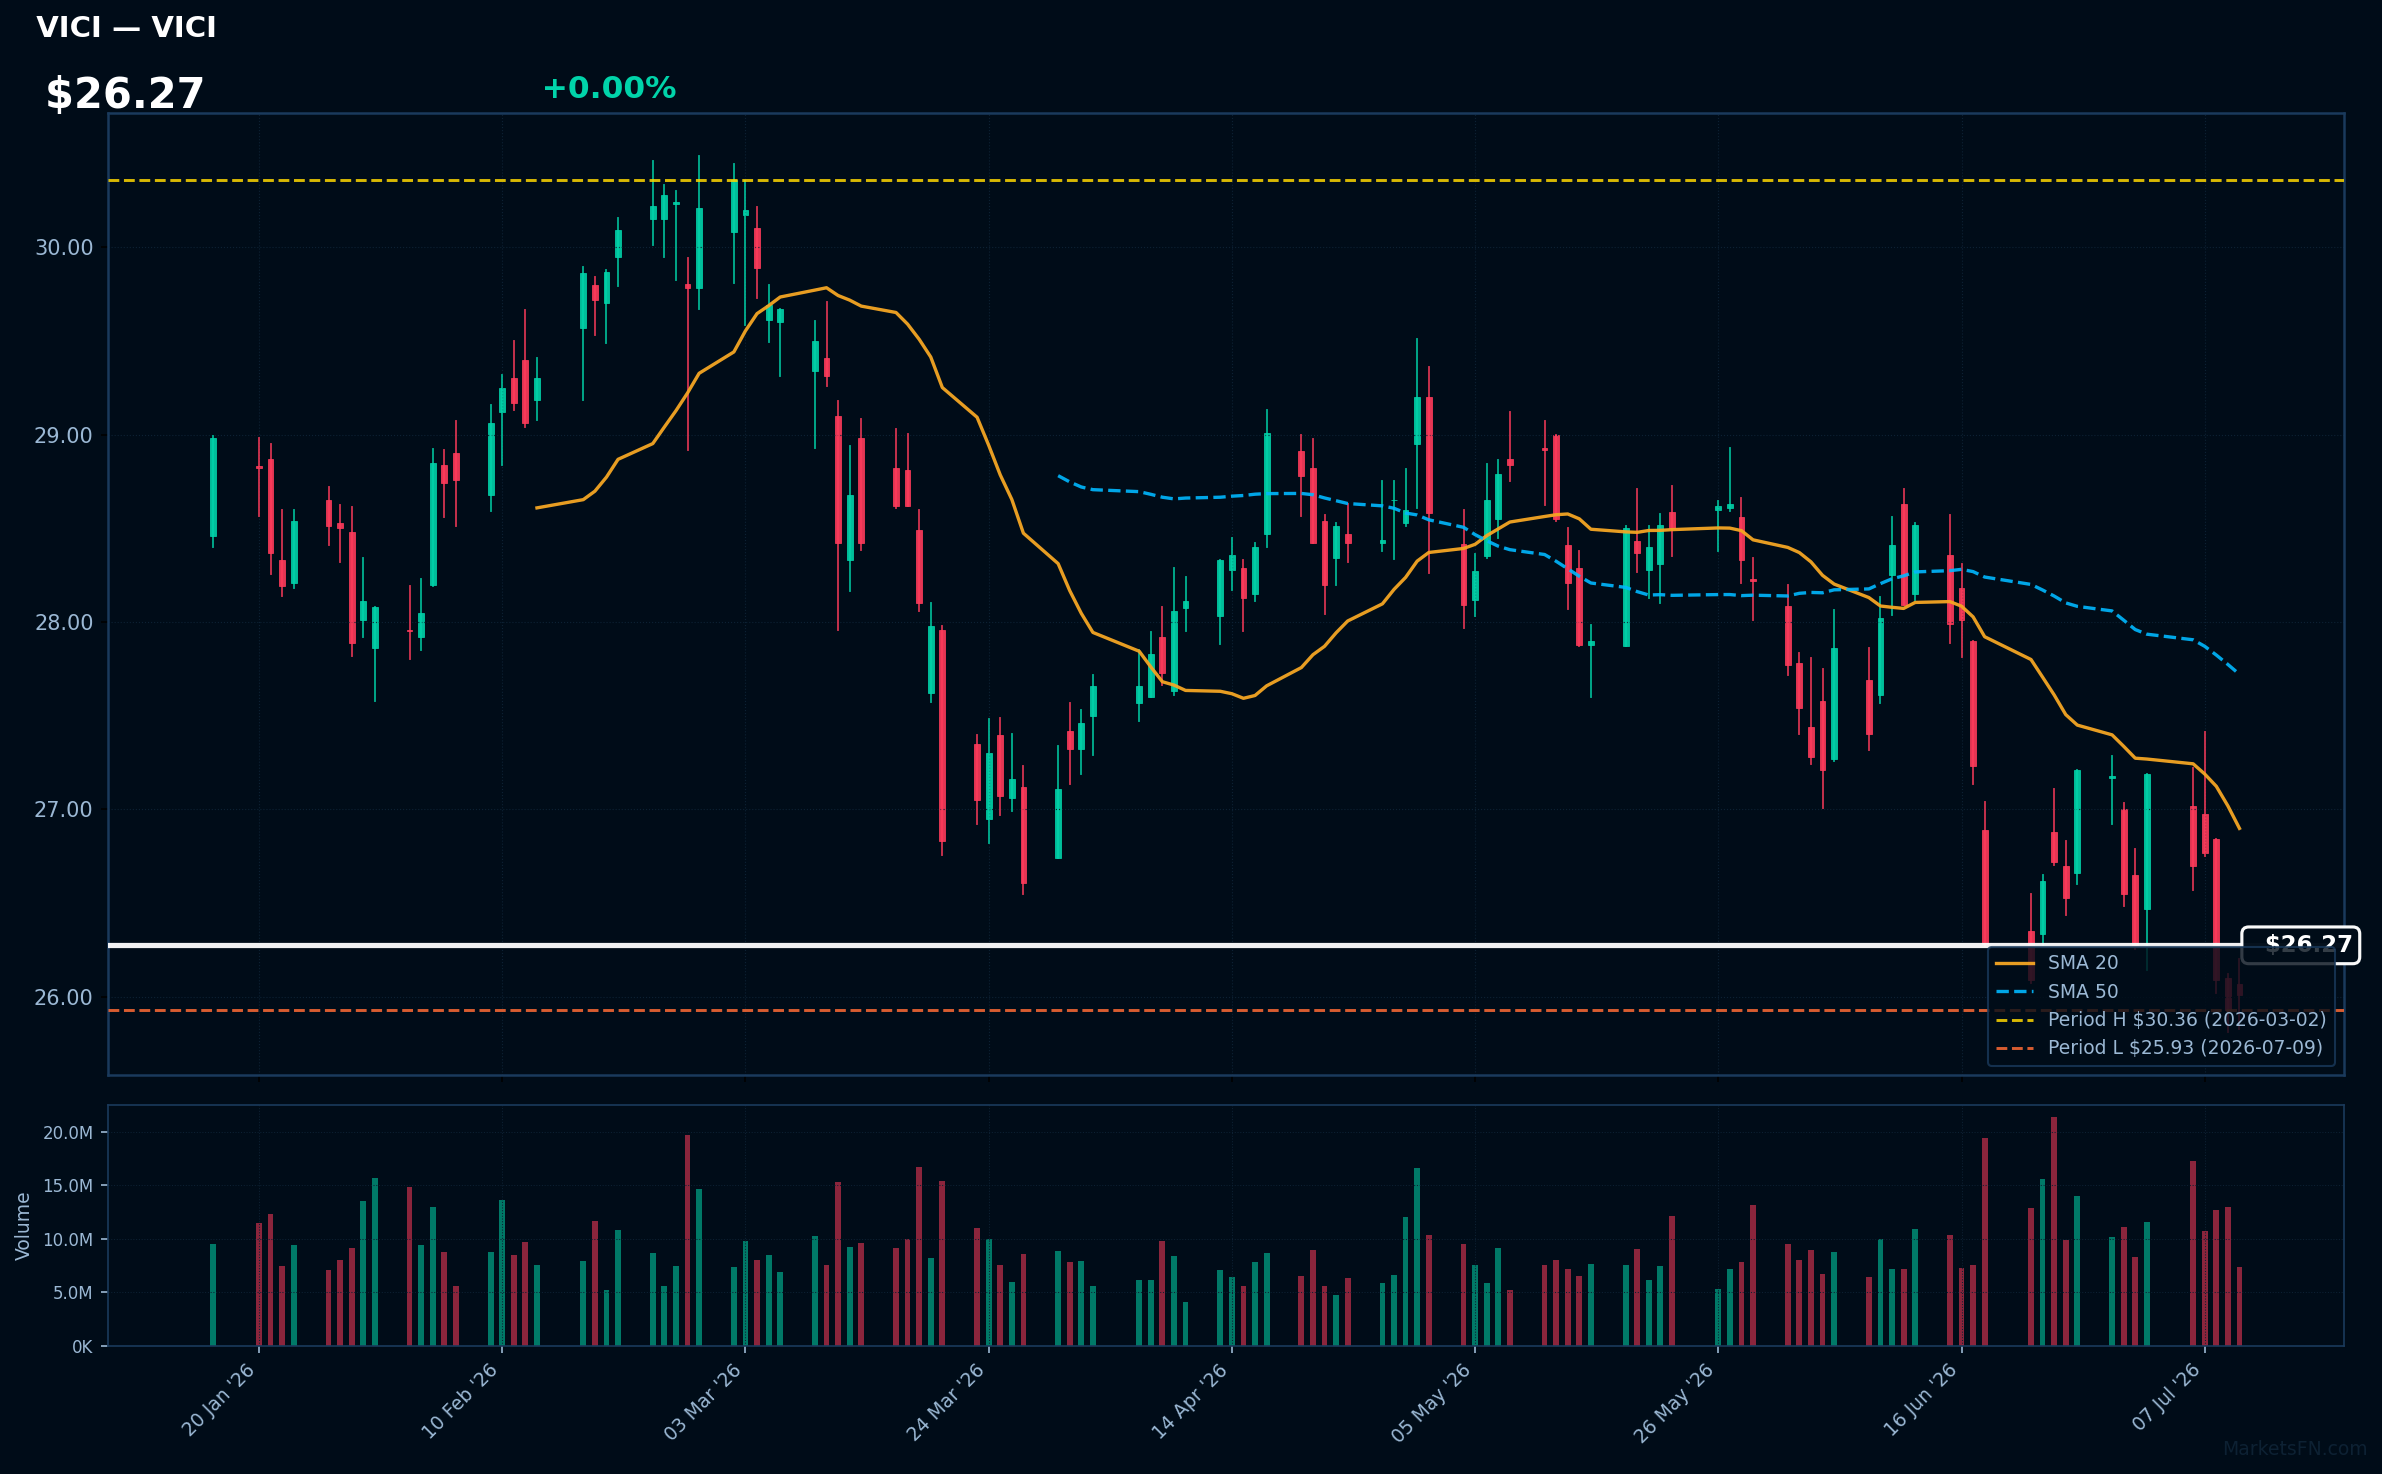
VICI | VICI Properties Inc | Real Estate | Price Last: $26.01 | % Realized: -7.60% | RSI: 42.6 | % above MA200: -9.7% | Trend: Below MA20, MA50, MA200
VICI Properties Inc is a real estate investment trust (REIT) that owns and acquires entertainment, hospitality, and gaming properties. Investors should care because its performance is tied to the recovery and growth of these sectors.
VICI's technical situation is bearish, with an RSI(14) of 42.6 and a sustained downtrend as price ($26.27) remains below MA20, MA50, and MA200. The stock is testing major support, 0.3% above its 2026 YTD low.
Related headlines
- VICI Properties Inc. Announces Release Date for Second Quarter 2026 Results
- VICI Properties Inc. Completes Sale-Leaseback of Canadian Portfolio in Connection With Pure Casino Entertainment's Acquisition of Gamehost
- VICI Properties and Club Med Announce Acquisition and Redevelopment of Carambola Beach Resort in St. Croix
- CLUB MED ADVANCES STRATEGIC NORTH AMERICAN EXPANSION WITH THE REDEVELOPMENT OF CARAMBOLA BEACH RESORT IN ST. CROIX IN PARTNERSHIP WITH VICI PROPERTIES
Market Commentary
The S&P 500 stocks listed are near their 2026 year-to-date (YTD) extremes, with some at their highs and others at their lows. Stocks like ANET, UNP, NSC, CSX, and MPC are at their 2026 YTD highs, indicating strong performance, while CPRT, EQT, and ALB are at their 2026 YTD lows, showing weakness.
The stocks near their 2026 YTD highs are primarily from the industrials sector (UNP, NSC, CSX), suggesting a strong theme in this area, potentially driven by economic growth or infrastructure spending. The presence of MPC, an energy company, also indicates strength in the energy sector. Conversely, the stocks near their 2026 YTD lows are from diverse sectors, including industrials (CPRT), energy (EQT), materials (ALB), and real estate (VICI), indicating a broader-based weakness.
Investors should monitor these stocks for signs of continued strength or weakness, as well as watch for any changes in sector themes and market conditions that may be driving these trends. The proximity of these stocks to their 2026 YTD extremes may indicate a potential turning point or continuation of current trends.
Methodology: All 503 S&P 500 constituents screened. Close prices downloaded from 2026-01-01. Period high = highest close since Jan 1 2026; period low = lowest close since Jan 1 2026. Distance = (current price / period extreme − 1) × 100. Technical indicators computed on up to 1 year of daily OHLCV data.
Disclaimer: For informational purposes only. Not investment advice. Past performance is not indicative of future results.

