Nasdaq 100 2026 YTD Highs & Lows Radar: CSX (CSX), Astrazeneca ADR (AZN) and more
MarketsFN Team

Nasdaq 100 2026 YTD Highs & Lows Radar: CSX (CSX), Astrazeneca ADR (AZN) and more
Screening all 101 Nasdaq 100 constituents for stocks nearest to their 2026 year-to-date high and their 2026 YTD low. Data as of July 13, 2026. % Realized = total return since Jan 1 2026.
Legend: RSI > 70 = overbought · RSI < 30 = oversold · Green % Realized = positive YTD return · Red = negative.
📈 Nearest to 2026 High
Sectors represented: Industrials (1), Technology (1), Communication Services (1), Consumer Cyclical (1), Consumer Defensive (1)
| Ticker | Company | Sector | Price Last | % Realized | 2026 YTD High Date | RSI | % above MA200 | Trend |
|---|---|---|---|---|---|---|---|---|
| CSX | CSX Corp | Industrials | $49.41 | +36.23% | 2026-07-10 | 68.6 | +22.8% | Above MA20, MA50, MA200 |
| CDW | CDW Corp | Technology | $144.39 | +8.43% | 2026-07-10 | 63.5 | +7.6% | Above MA20, MA50, MA200 |
| EA | Electronic Arts, Inc | Communication Services | $206.41 | +0.98% | 2026-07-09 | 70.2 | +2.3% | Above MA20, MA50, MA200 |
| ABNB | Airbnb Inc | Consumer Cyclical | $148.62 | +11.74% | 2026-07-02 | 57.1 | +13.7% | Above MA20, MA50, MA200 |
| MNST | Monster Beverage Corp | Consumer Defensive | $97.39 | +27.88% | 2026-06-29 | 64.6 | +24.0% | Above MA20, MA50, MA200 |
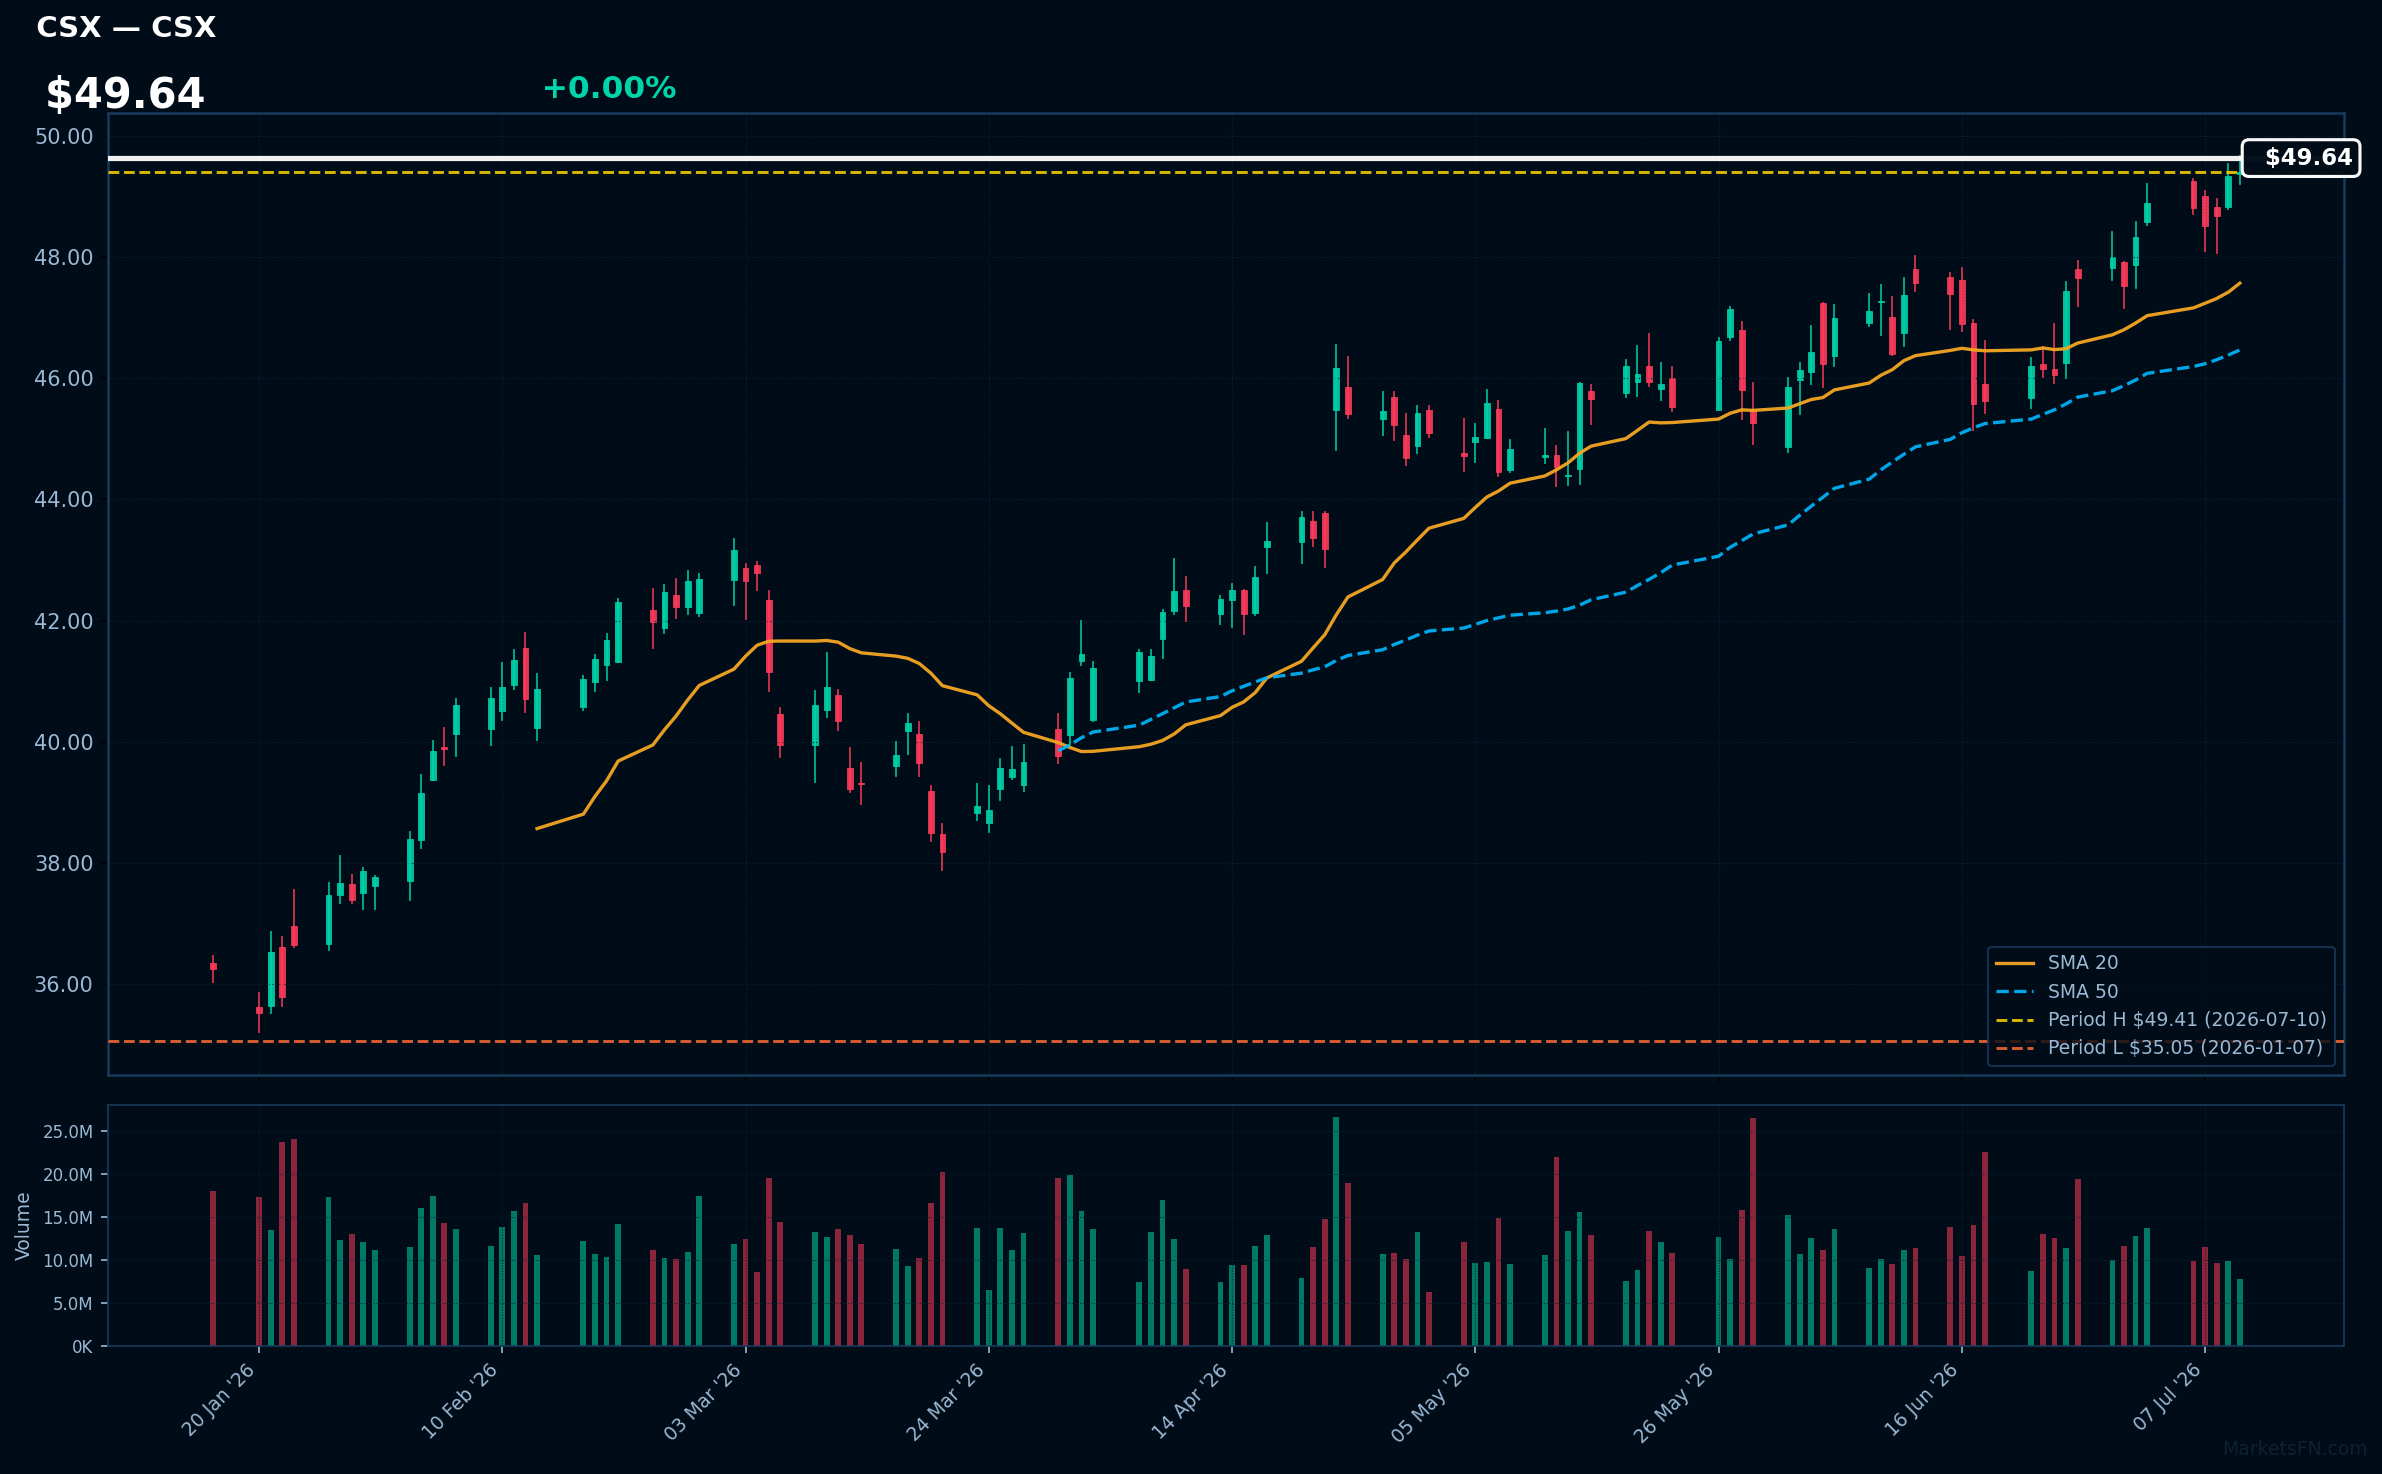
CSX | CSX Corp | Industrials | Price Last: $49.41 | % Realized: +36.23% | RSI: 68.6 | % above MA200: +22.8% | Trend: Above MA20, MA50, MA200
CSX Corp operates a rail network transporting coal, intermodal containers, and automotive goods, making it a key player in North American freight infrastructure; investors should care due to its critical role in supply chains and potential for steady cash flows.
CSX Corp's technicals indicate sustained uptrend with price > MA20 > MA50 > MA200, RSI(14) at 68.6, and 0.0% below its 2026 YTD high, suggesting momentum; the stock is near a potential breakout level with 36.2% 2026 YTD return.
Related headlines
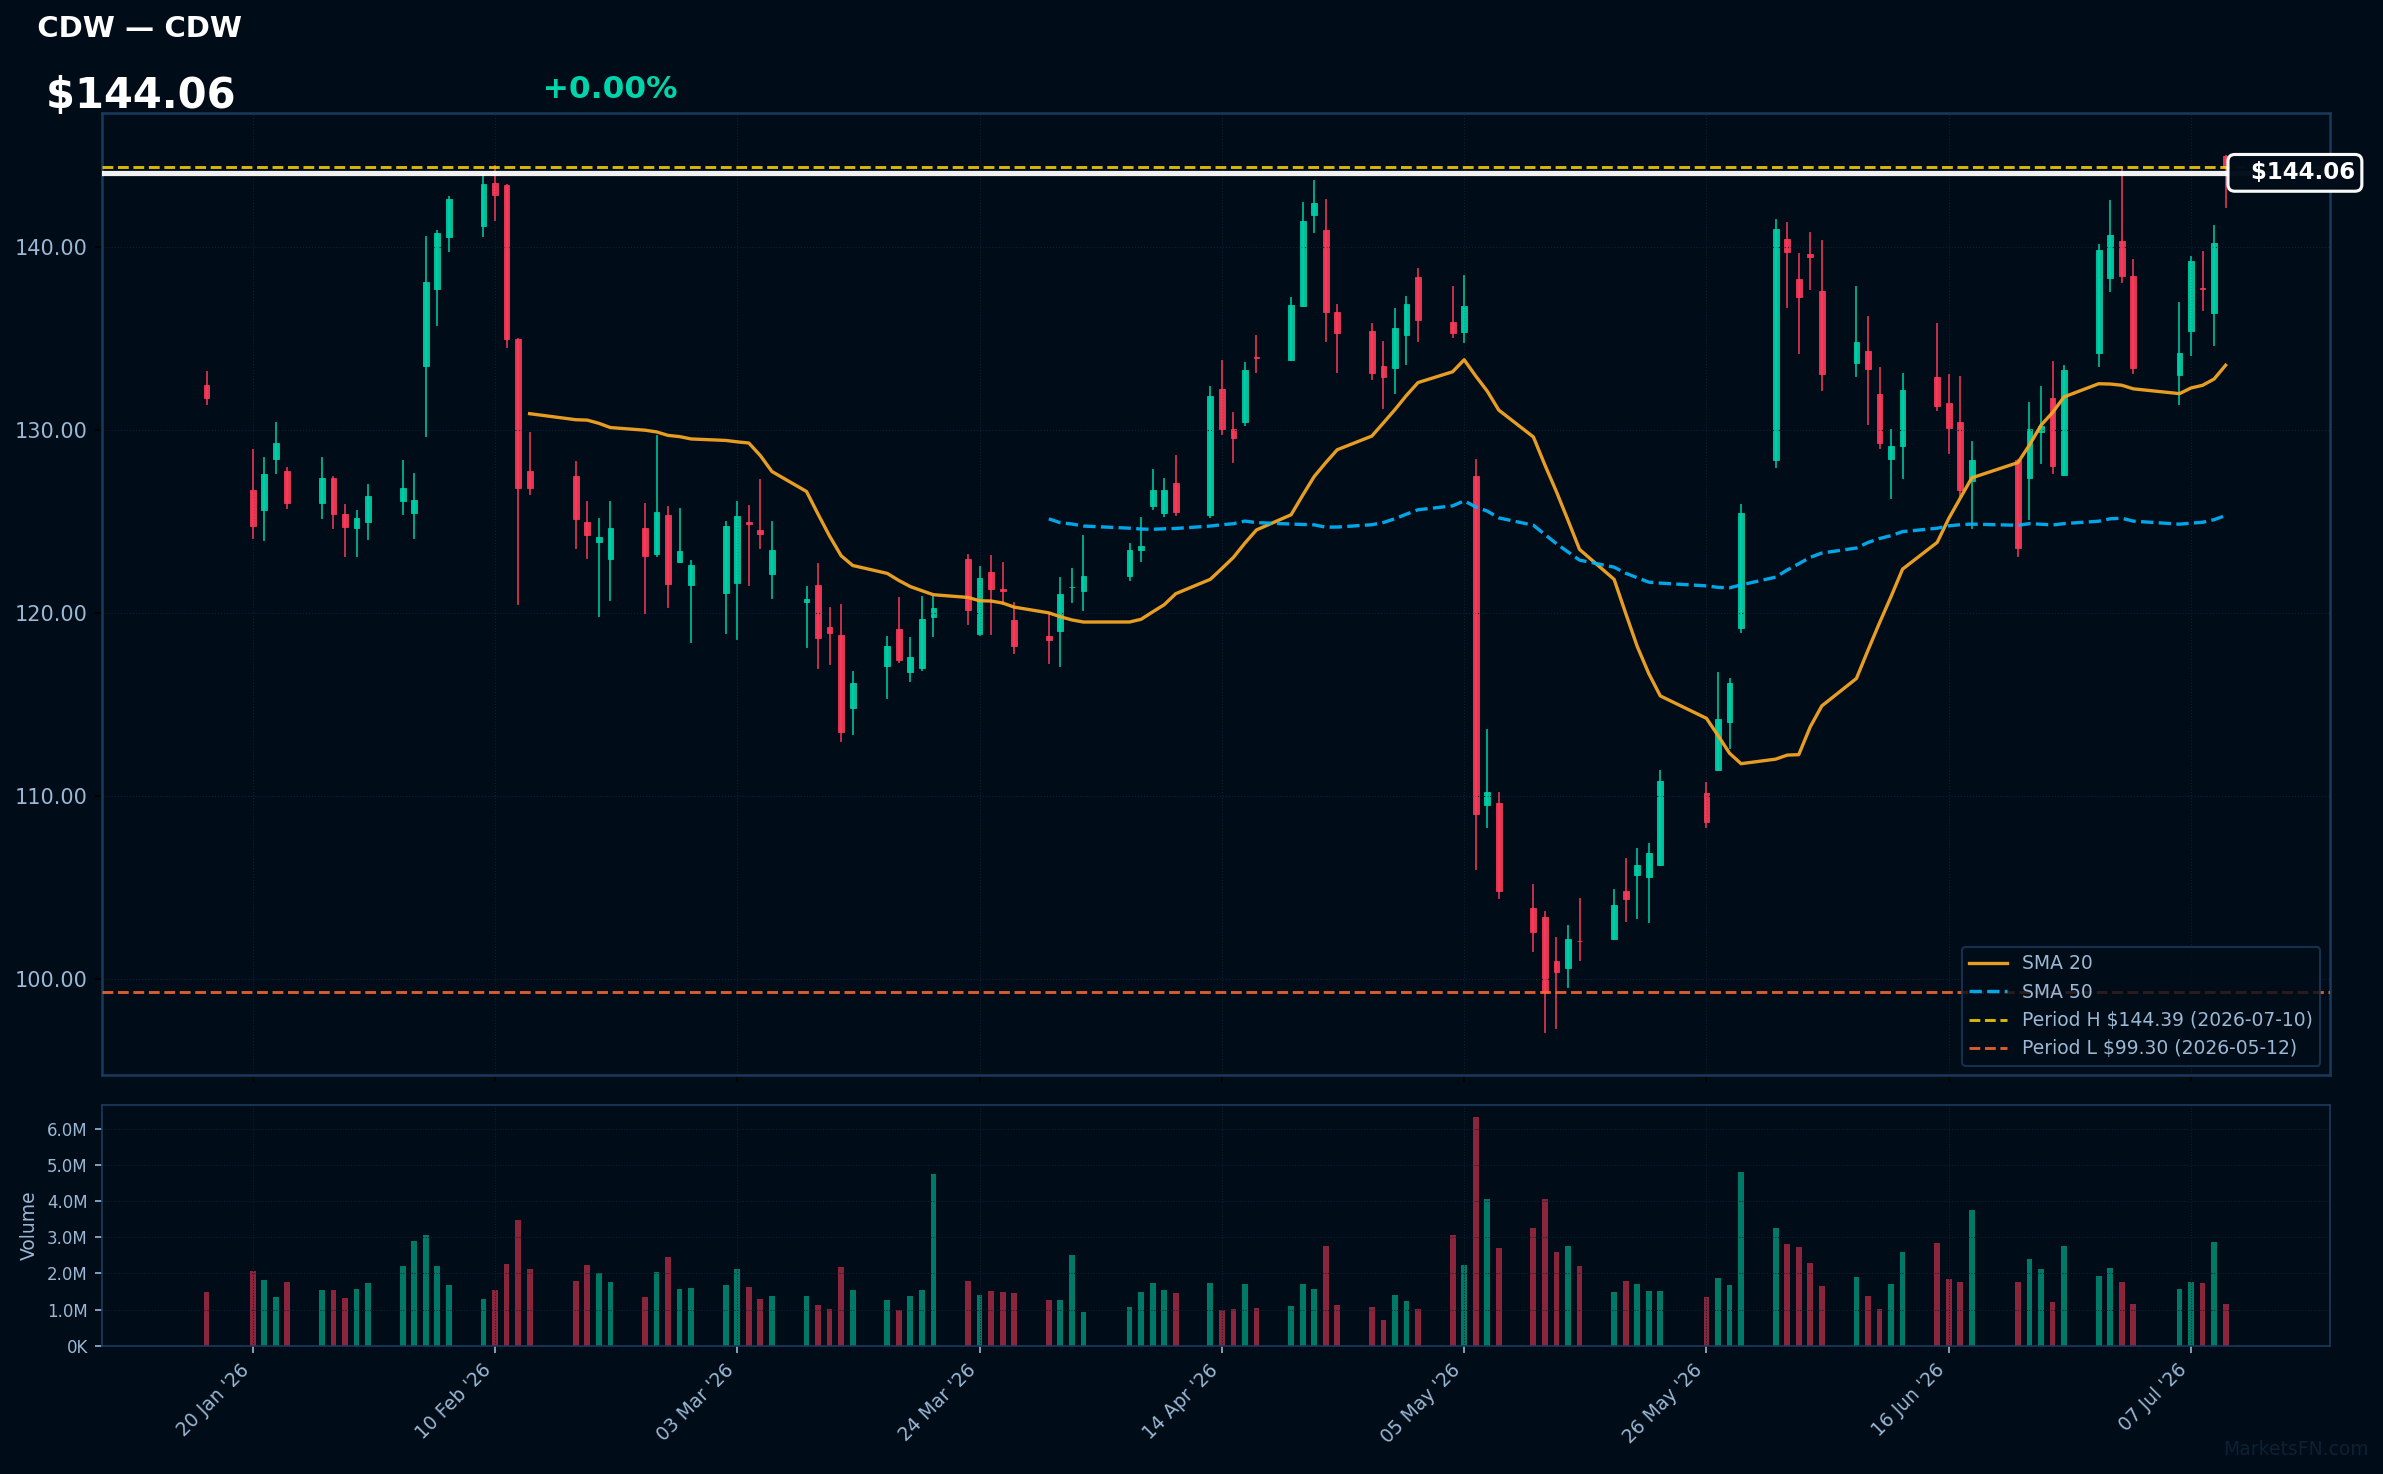
CDW | CDW Corp | Technology | Price Last: $144.39 | % Realized: +8.43% | RSI: 63.5 | % above MA200: +7.6% | Trend: Above MA20, MA50, MA200
CDW Corp is a technology solutions provider offering a range of products and services including hardware, software, and cloud solutions to various customers. Investors should care as the company's performance reflects demand for technology infrastructure and services.
CDW Corp's RSI(14) is 63.5, indicating rising momentum. The stock is above MA20, MA50, and MA200, showing a strong uptrend. With the stock at its 2026 YTD high, a potential breakout is near, supported by an 8.4% 2026 YTD return.
Related headlines
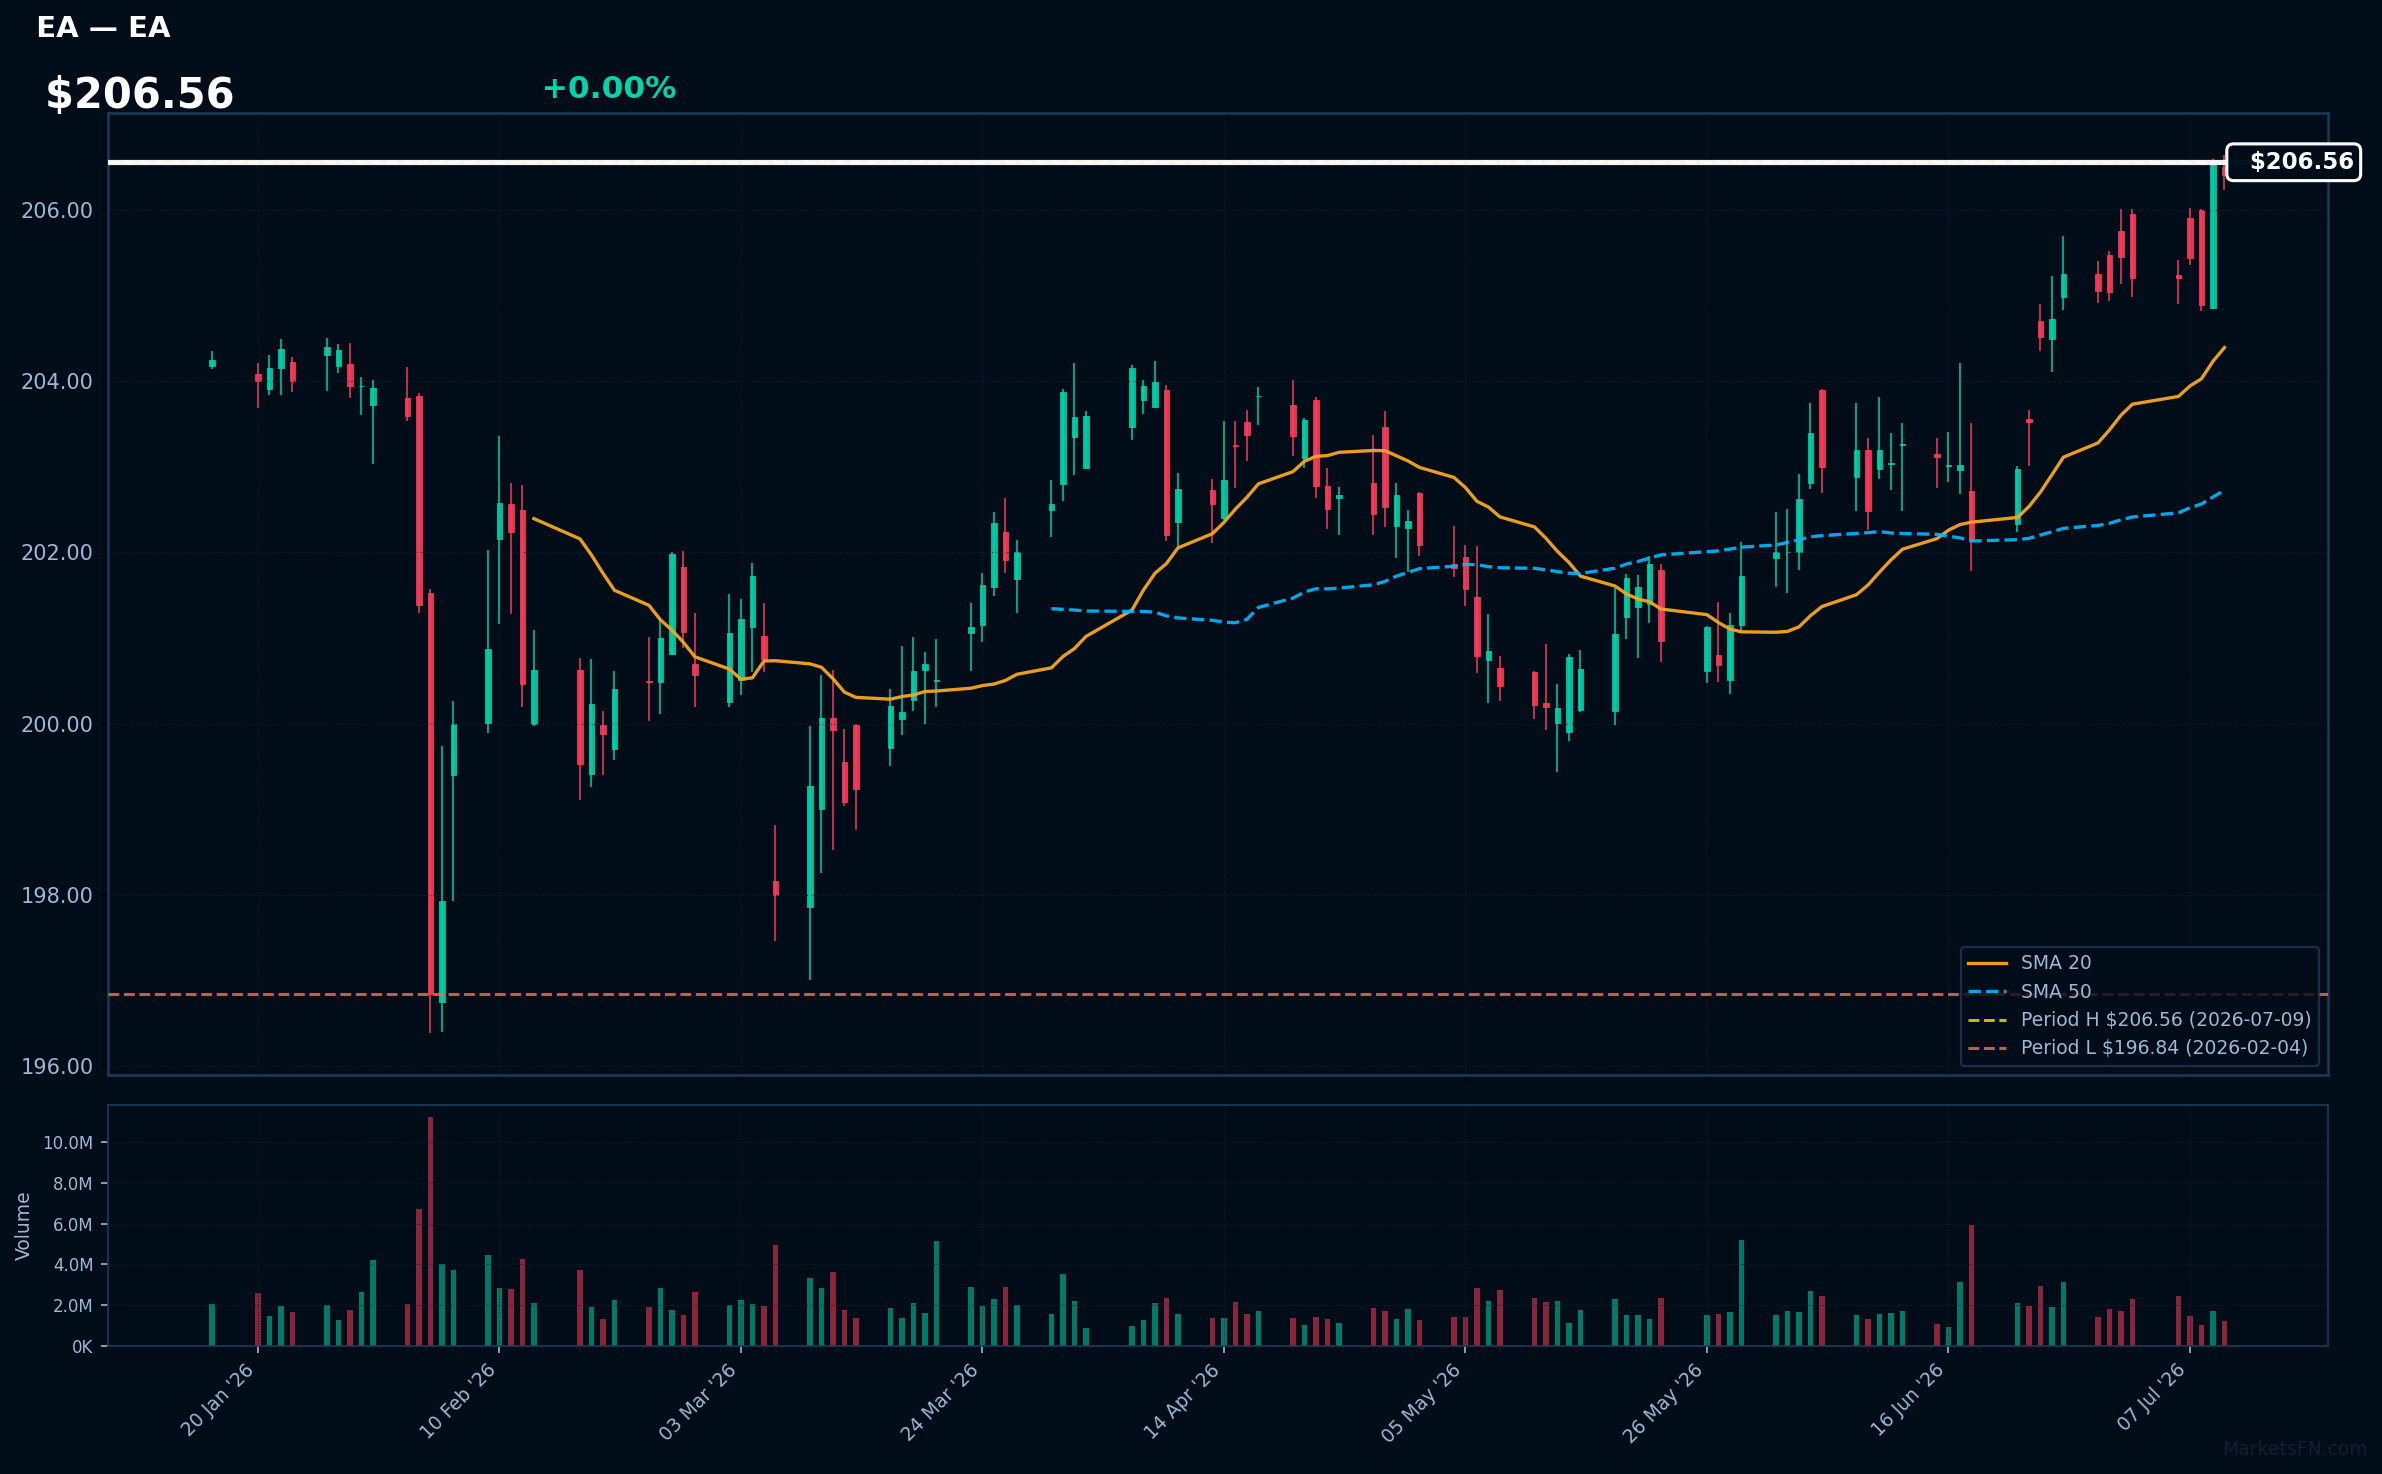
EA | Electronic Arts, Inc | Communication Services | Price Last: $206.41 | % Realized: +0.98% | RSI: 70.2 | % above MA200: +2.3% | Trend: Above MA20, MA50, MA200
Electronic Arts, Inc (EA) is a leading interactive entertainment software company that develops and publishes games such as FIFA, Madden NFL, and The Sims. Investors should care about its performance in the gaming market and its ability to innovate and release successful titles.
EA's current technical situation indicates strong momentum: RSI(14) is 70.2, indicating overbought conditions, and the stock is in a sustained uptrend with price > MA20 > MA50 > MA200. It's 0.1% below its 2026 YTD high, near a potential breakout.
Related headlines
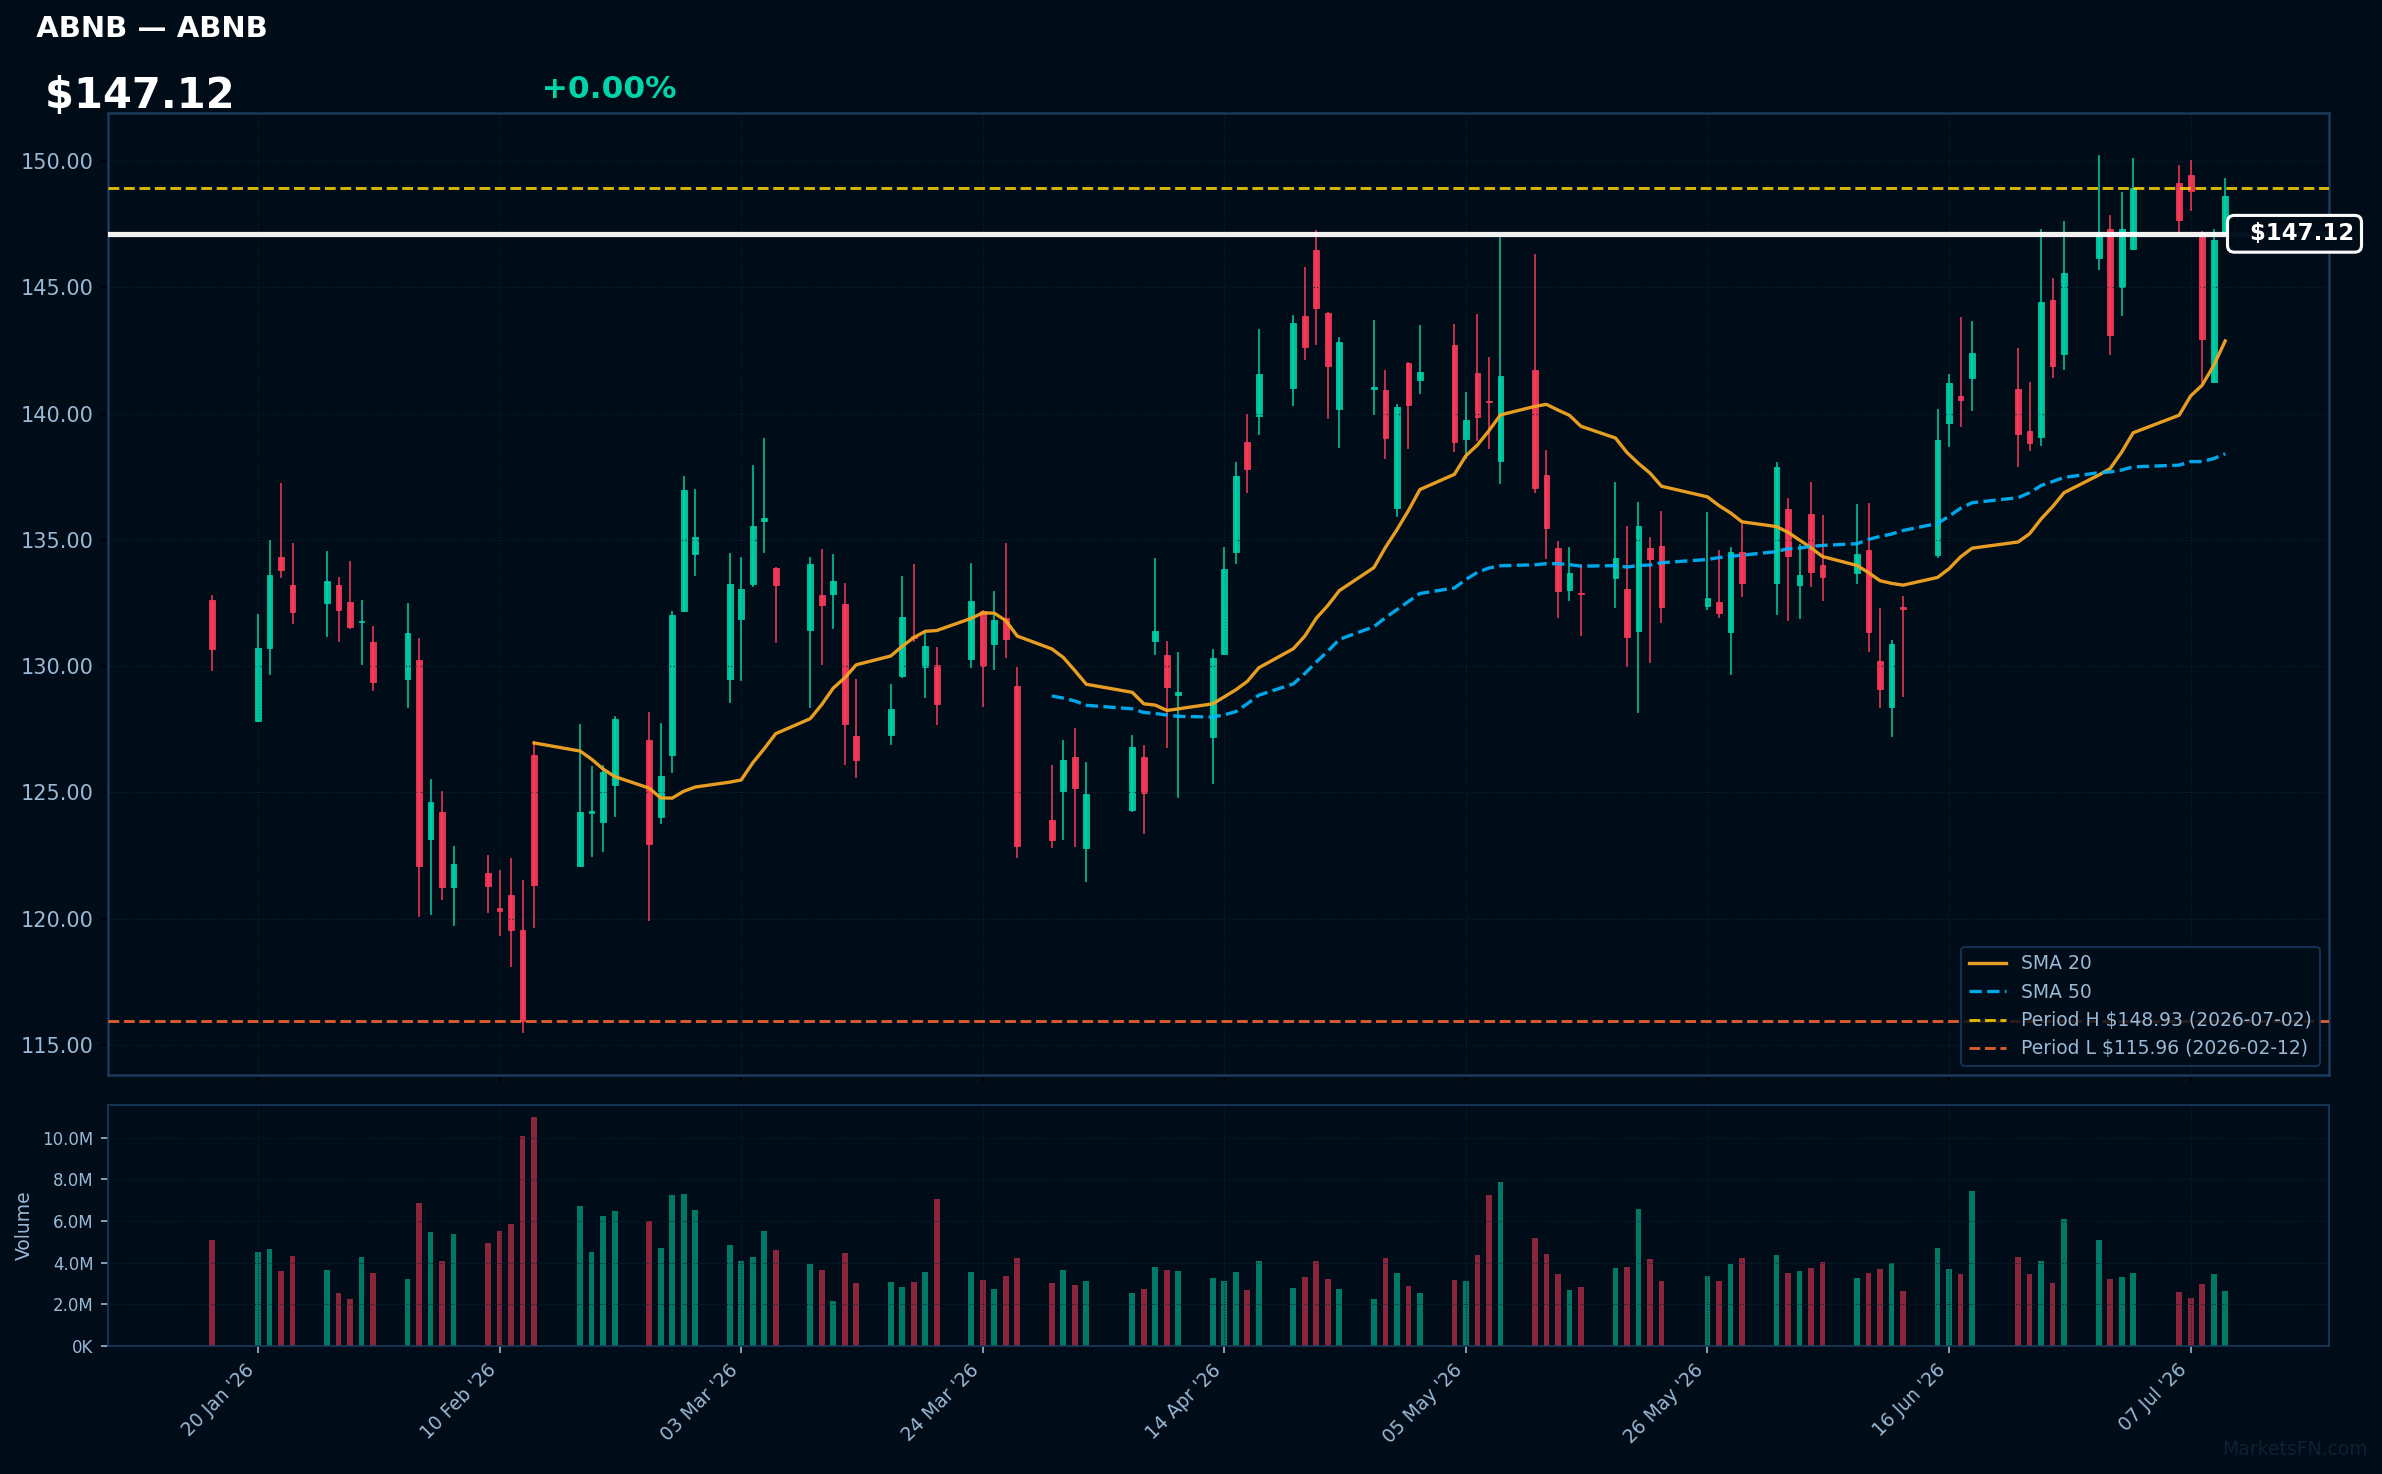
ABNB | Airbnb Inc | Consumer Cyclical | Price Last: $148.62 | % Realized: +11.74% | RSI: 57.1 | % above MA200: +13.7% | Trend: Above MA20, MA50, MA200
Airbnb Inc operates a platform connecting travelers with local hosts offering unique accommodations, enabling experiences beyond traditional hotels; investors should care as it disrupts the hospitality industry with a scalable, asset-light model.
Airbnb shows a bullish MA alignment with price > MA20 > MA50 > MA200, RSI(14) at 57.1, and is 0.2% below its 2026 YTD high, indicating sustained uptrend and potential breakout momentum.
Related headlines
- Airbnb Buys Manhattan Office Despite NYC Rental Crackdown
- Airbnb to Announce Second Quarter 2026 Results
- The government wants its websites to be as shiny as Silicon Valley's. An Airbnb founder is helping.
- Airbnb offered $750 to Americans to open up their homes during the World Cupmostly women took it up and now theyre earning thousands
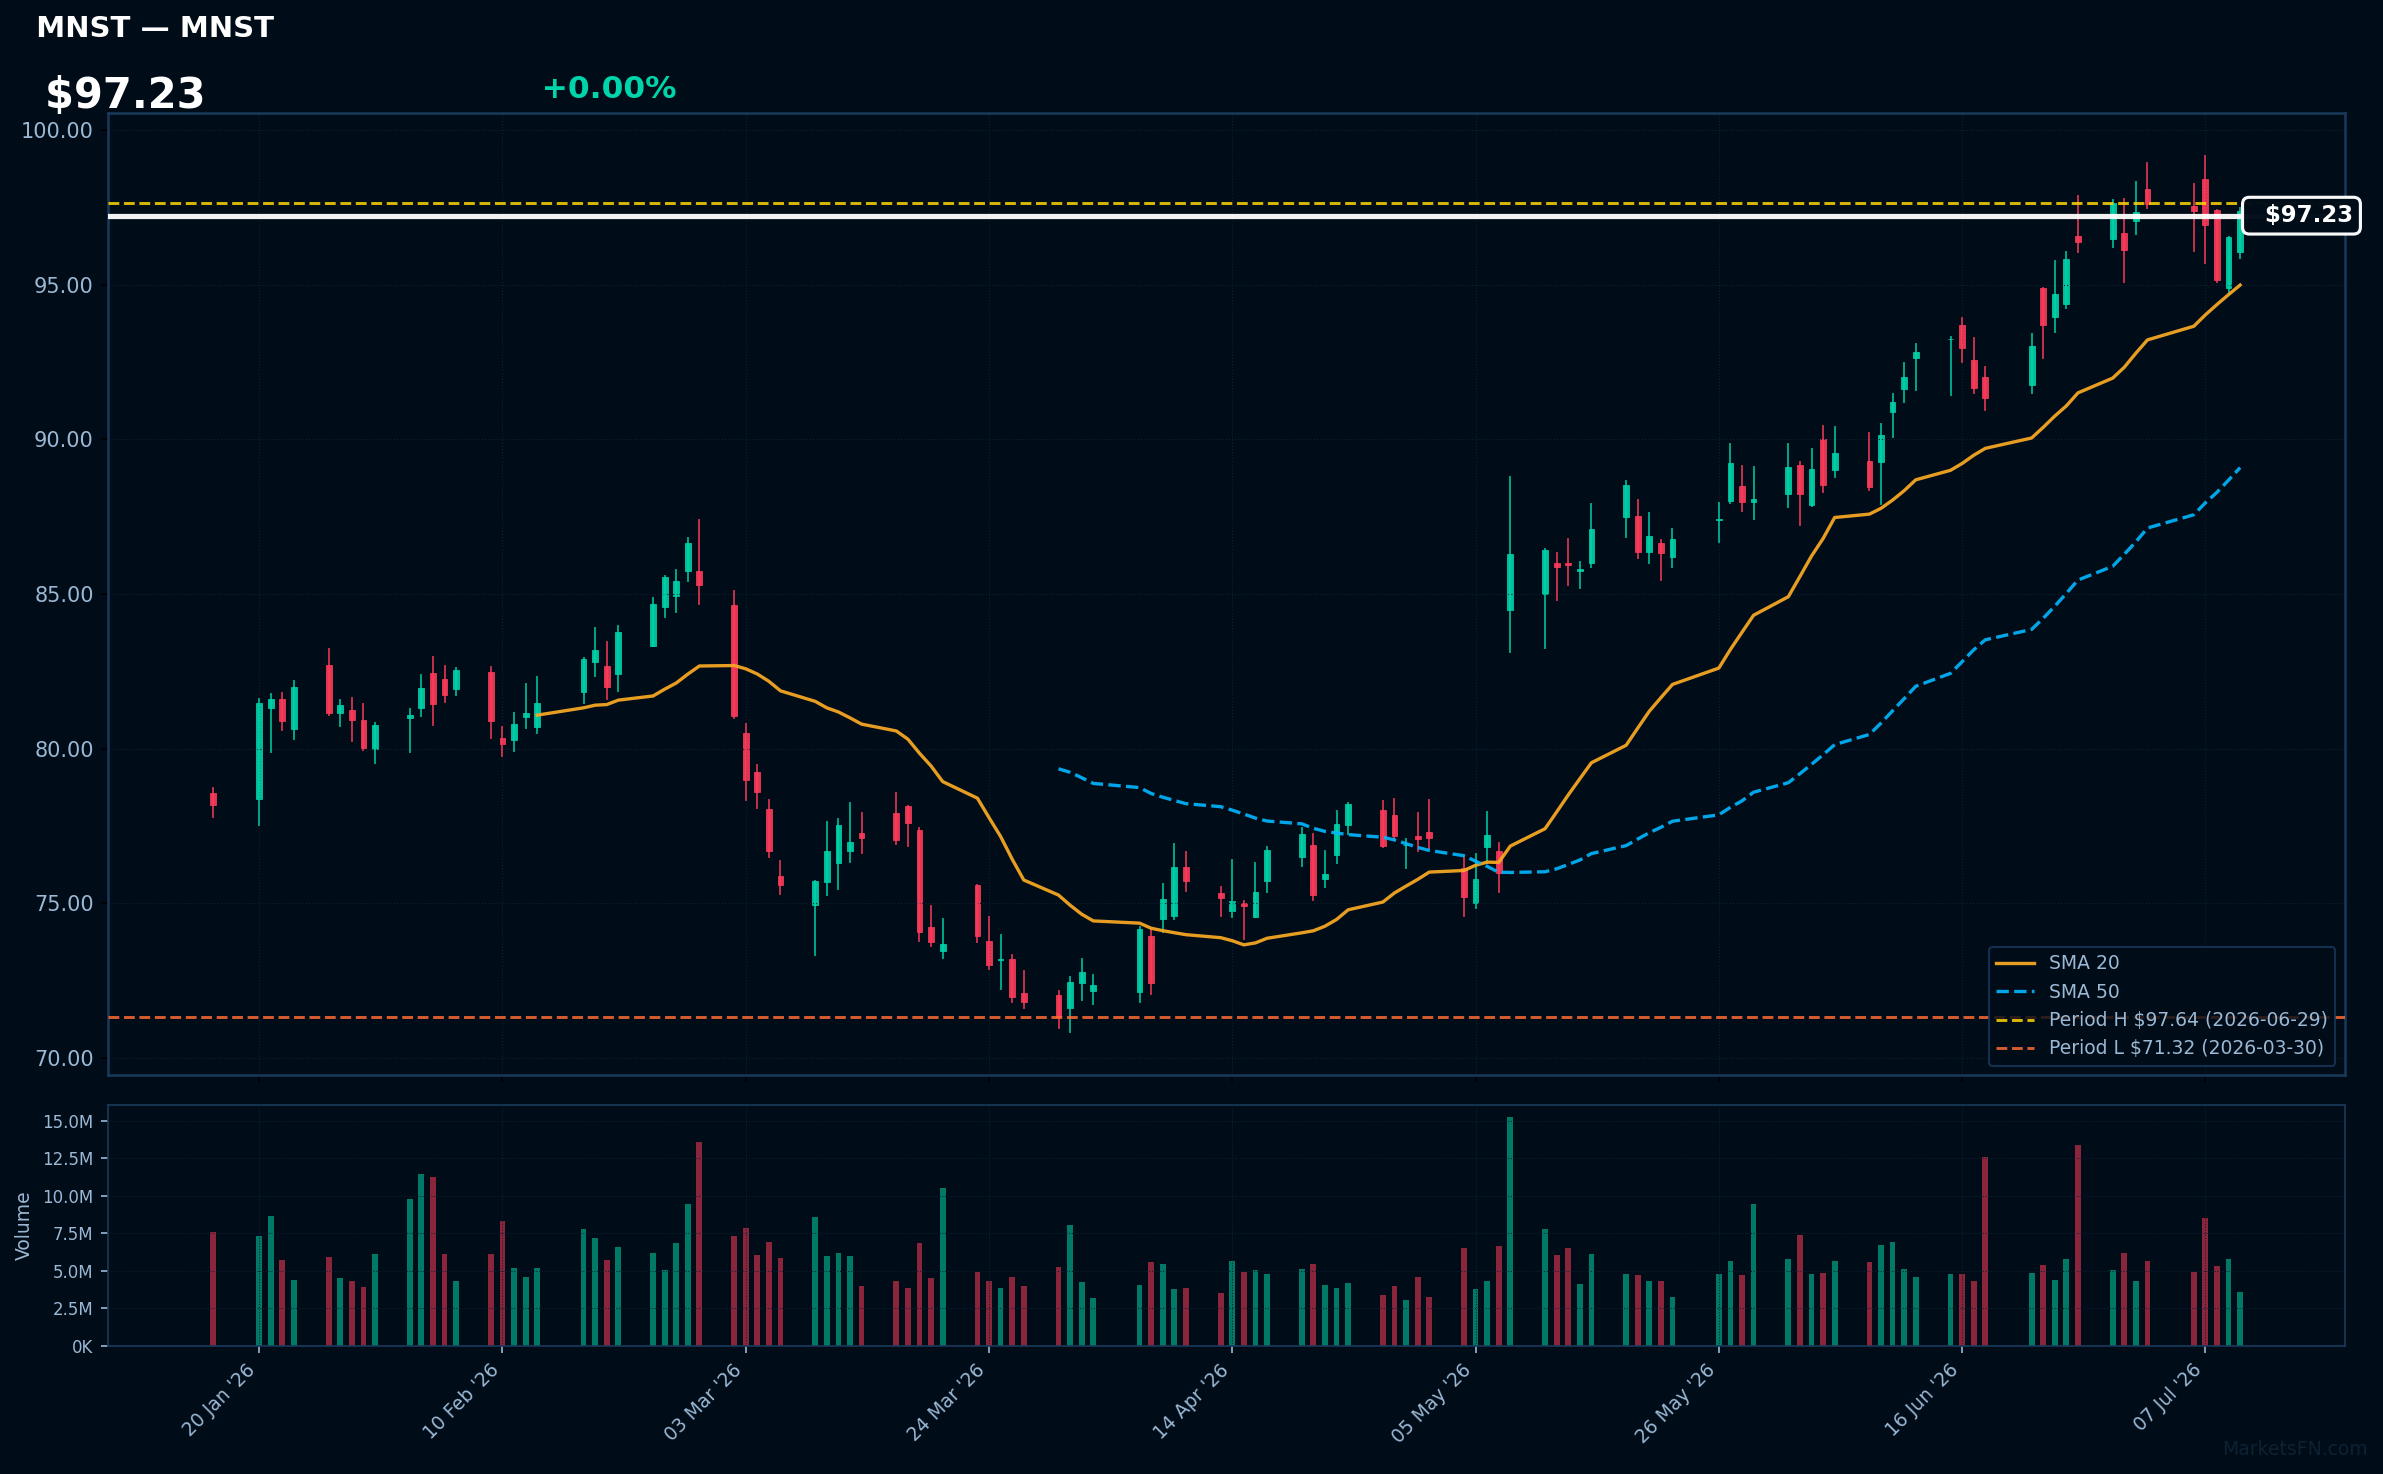
MNST | Monster Beverage Corp | Consumer Defensive | Price Last: $97.39 | % Realized: +27.88% | RSI: 64.6 | % above MA200: +24.0% | Trend: Above MA20, MA50, MA200
Monster Beverage Corp is a leading energy drink manufacturer with popular brands like Monster Energy. Investors should care about its strong market presence and growth potential in the energy drink segment.
The stock shows bullish MA alignment with price > MA20 > MA50 > MA200 and RSI(14) at 64.6, indicating sustained uptrend and momentum. It's 0.3% below its 2026 YTD high, near a potential breakout.
Related headlines
- Monster Beverage Declares Two-for-One Stock Split
- Massive Gap-Up Propels This Monster To Record High. These Clues Point To More Gains Ahead.
- Monster Beverage Announces Participation in dbAccess Global Consumer Conference 2026
- Dow Jones Leader Amazon, AI Stock Quanta, Monster Beverage In Or Near Buy Zones
📉 Nearest to 2026 Low
Sectors represented: Healthcare (1), Industrials (1), Real Estate (1), Consumer Defensive (1), Communication Services (1)
| Ticker | Company | Sector | Price Last | % Realized | 2026 YTD Low Date | RSI | % above MA200 | Trend |
|---|---|---|---|---|---|---|---|---|
| AZN | Astrazeneca plc ADR | Healthcare | $171.61 | -6.30% | 2026-07-10 | 37.2 | -6.9% | Below MA20, MA50, MA200 |
| CPRT | Copart, Inc | Industrials | $27.52 | -27.14% | 2026-07-10 | 37.4 | -25.6% | Below MA20, MA50, MA200 |
| CSGP | Costar Group, Inc | Real Estate | $28.39 | -56.78% | 2026-06-30 | 42.9 | -45.9% | Below MA20, MA50, MA200 |
| PEP | PepsiCo Inc | Consumer Defensive | $137.38 | -3.41% | 2026-06-30 | 44.8 | -8.5% | Below MA20, MA50, MA200 |
| WBD | Warner Bros. Discovery Inc | Communication Services | $26.59 | -6.73% | 2026-07-06 | 51.5 | +2.5% | Above MA200 · Below MA20, MA50 |
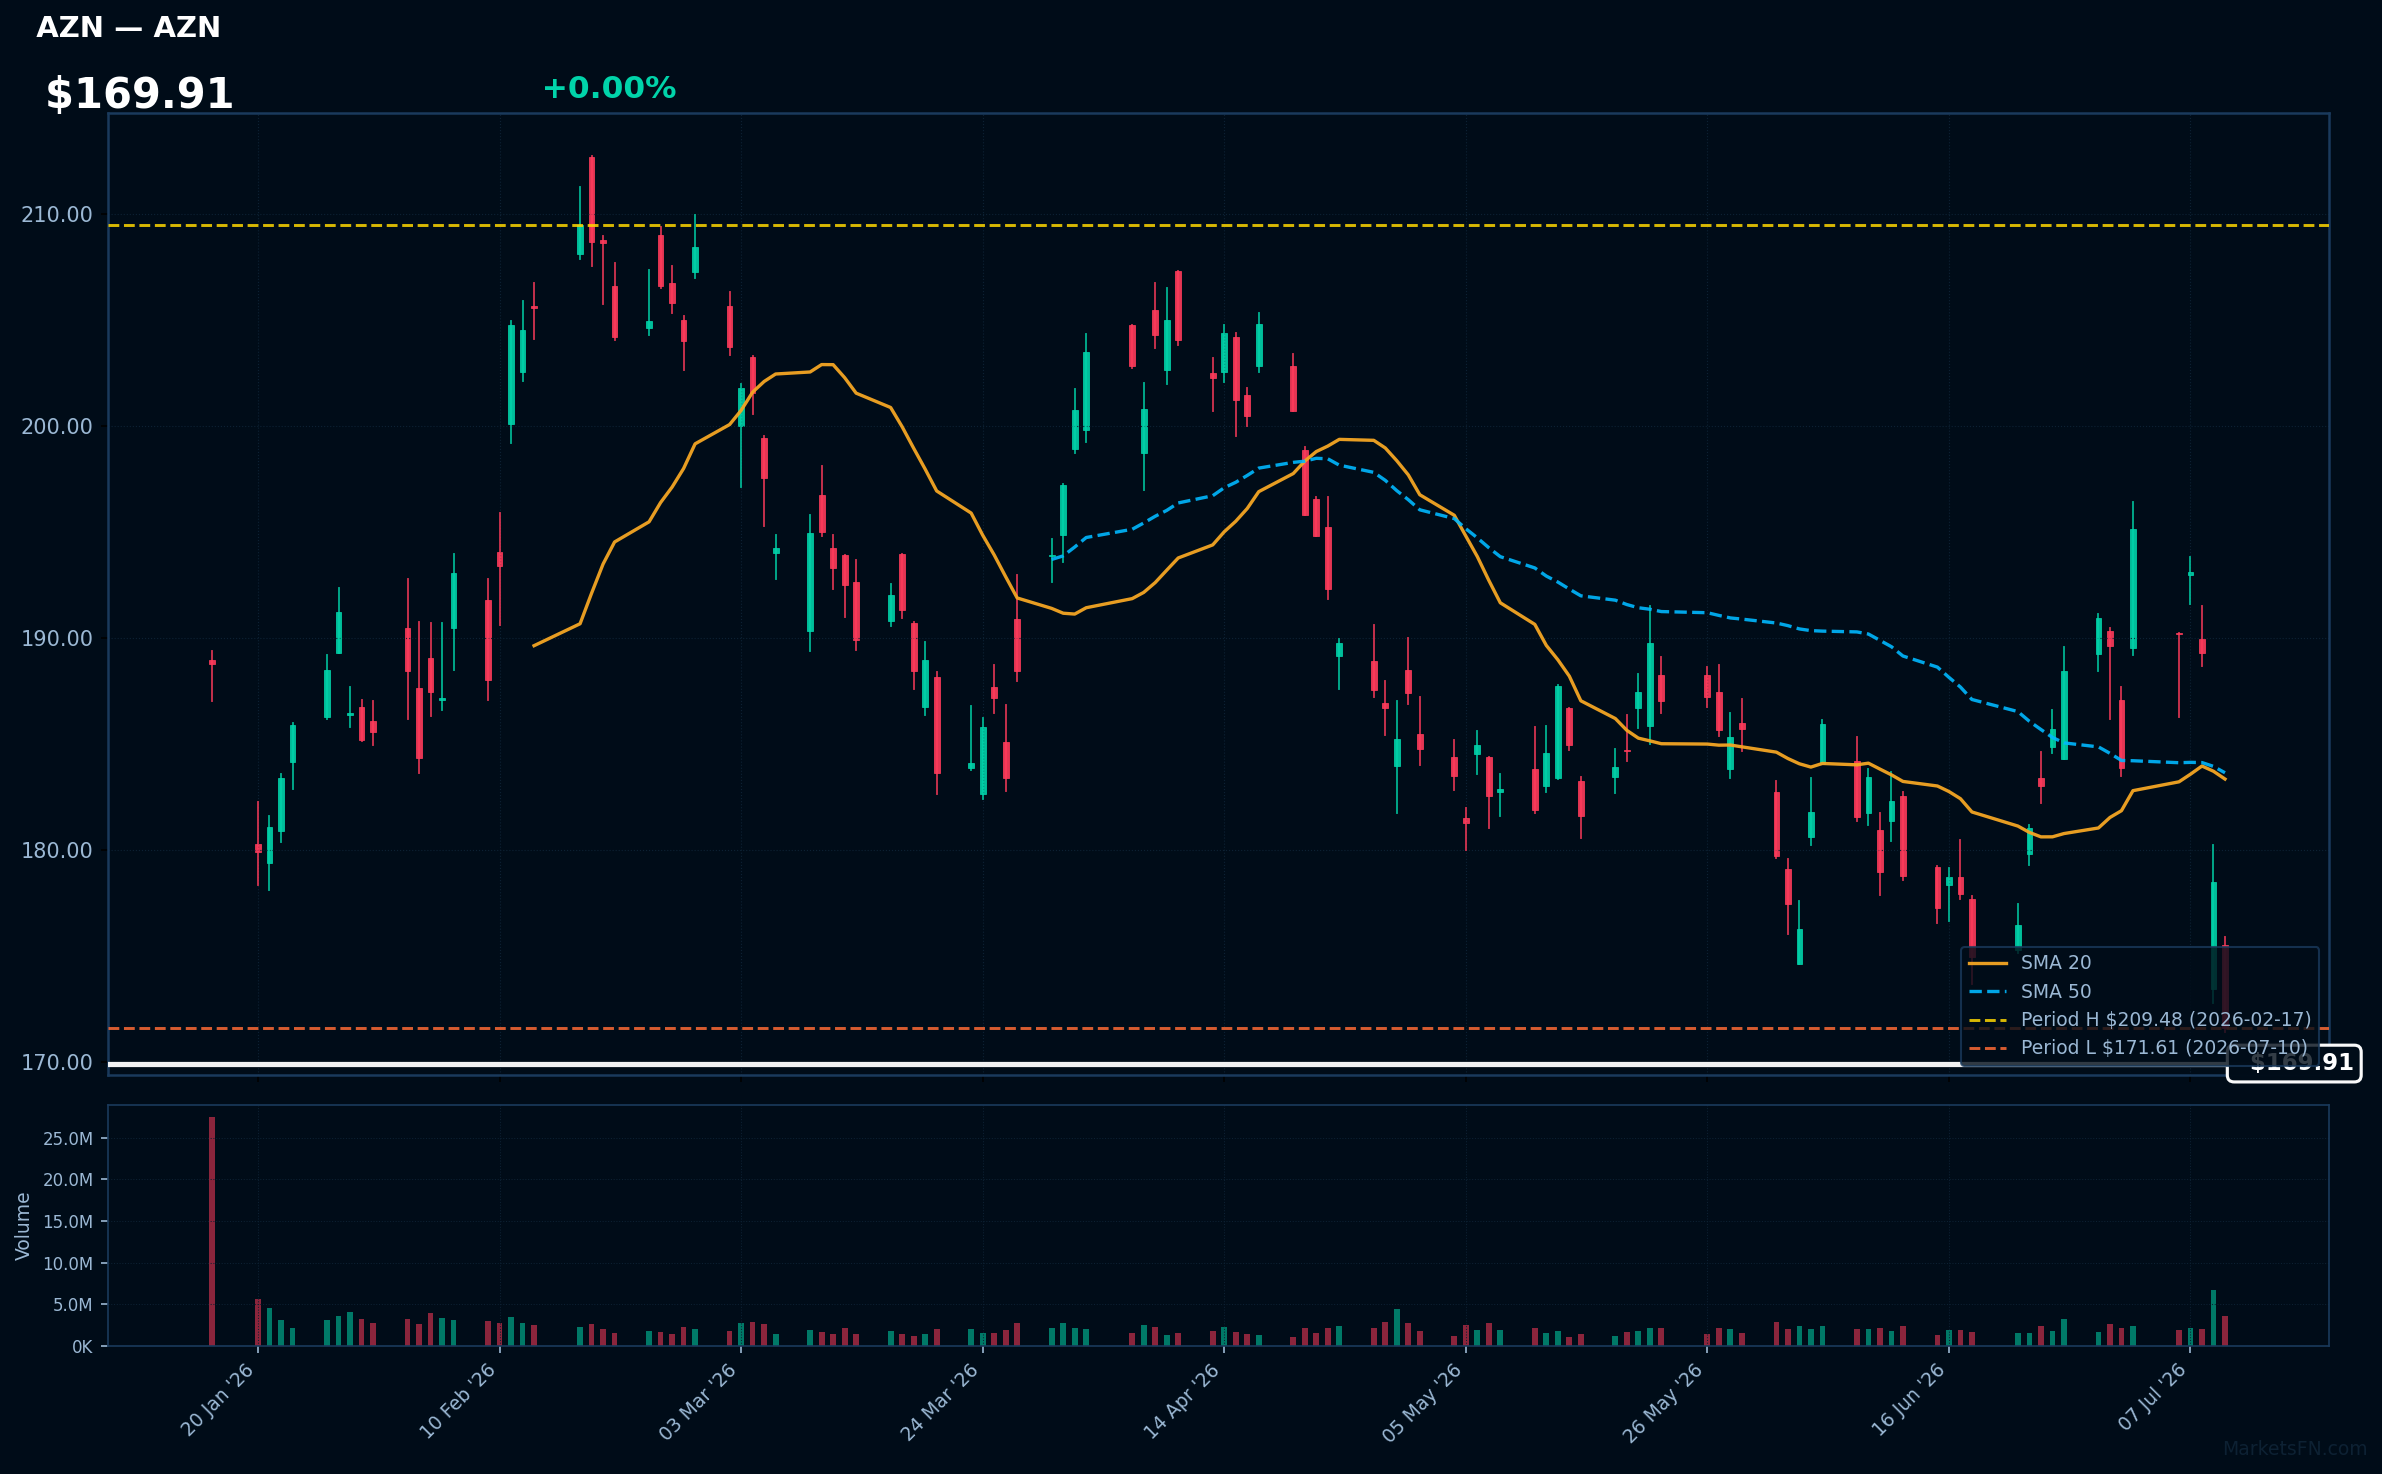
AZN | Astrazeneca plc ADR | Healthcare | Price Last: $171.61 | % Realized: -6.30% | RSI: 37.2 | % above MA200: -6.9% | Trend: Below MA20, MA50, MA200
Astrazeneca plc ADR is a biopharmaceutical company that discovers, develops, and commercializes prescription medicines. Investors should care about its pipeline and product portfolio, particularly for treatments in areas like oncology and cardiovascular diseases, which drive revenue growth.
Astrazeneca plc ADR's technicals indicate a sustained downtrend with price ($169.91) below MA20, MA50, and MA200. The RSI(14) is 37.2, nearing oversold territory. The stock is at its 2026 YTD low, returning -6.3% YTD, signaling a potential warning sign for investors.
Related headlines
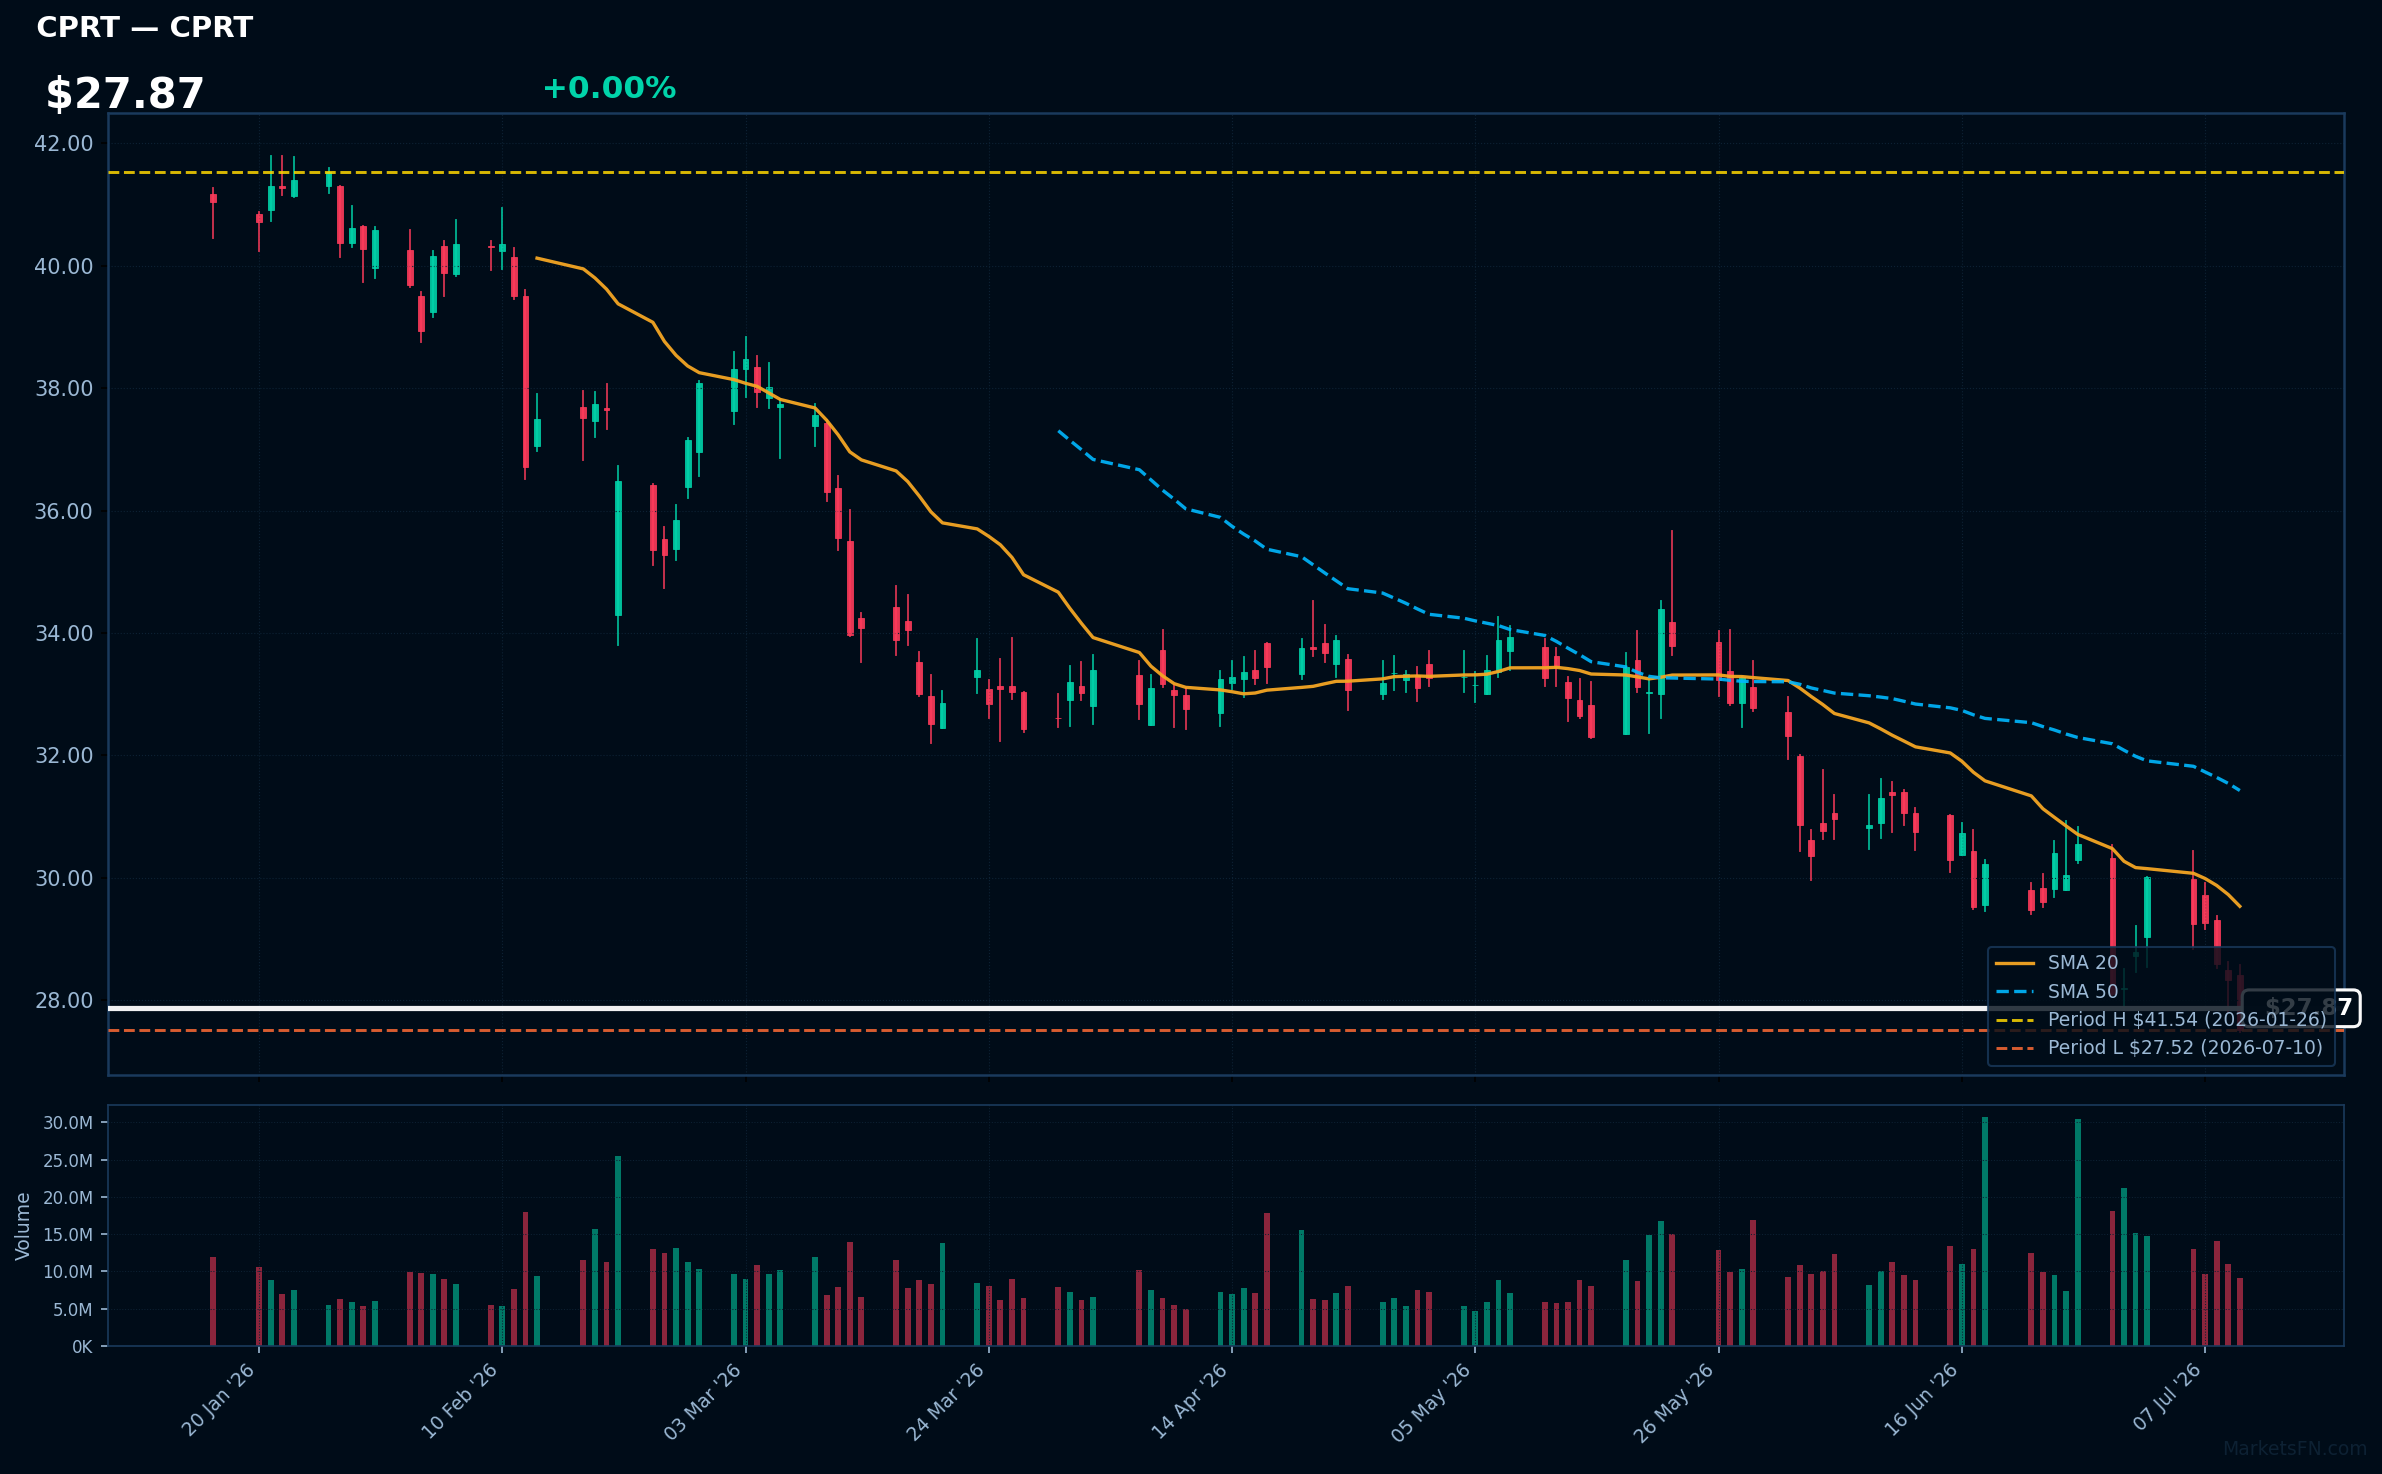
CPRT | Copart, Inc | Industrials | Price Last: $27.52 | % Realized: -27.14% | RSI: 37.4 | % above MA200: -25.6% | Trend: Below MA20, MA50, MA200
Copart, Inc (CPRT) operates an online vehicle auction platform and provides related services, allowing insurance companies and other sellers to sell damaged or used vehicles to buyers worldwide. Investors care due to its market dominance and growth potential.
Copart's technical situation is bearish, with an RSI(14) of 37.4 indicating weakening momentum. The sustained downtrend is evident as price ($27.87) < MA20 < MA50 < MA200, and it's testing major support at its 2026 YTD low.
Related headlines
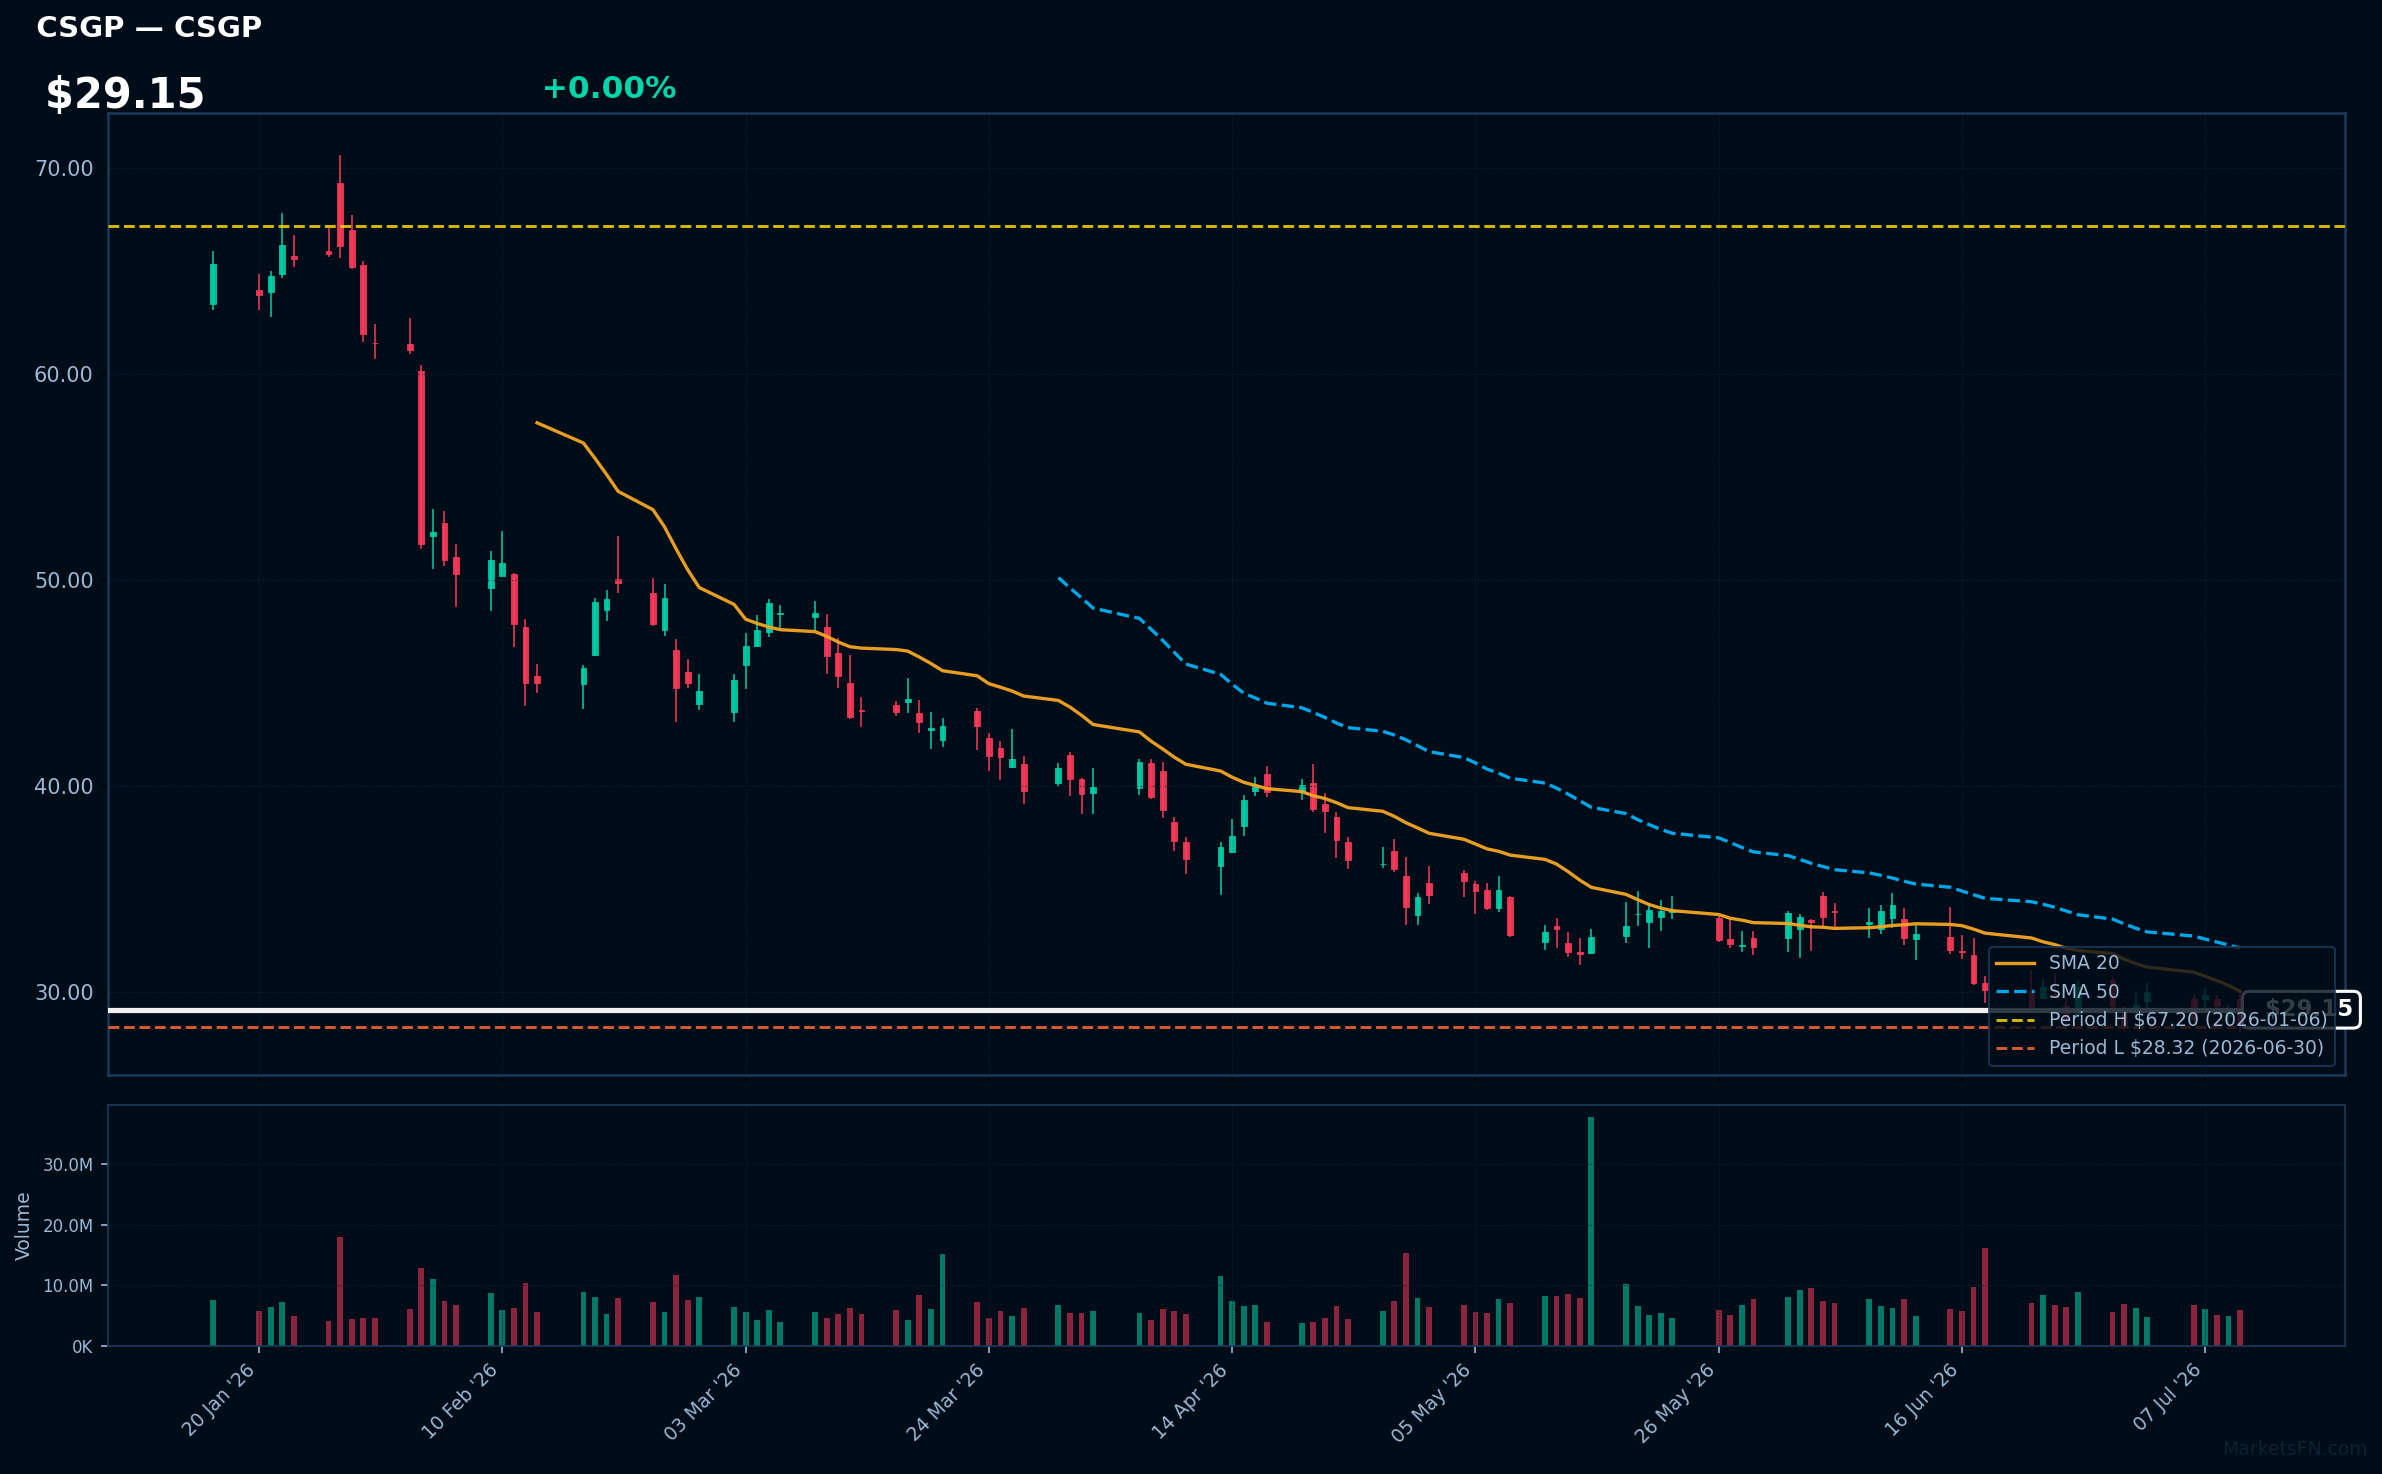
CSGP | Costar Group, Inc | Real Estate | Price Last: $28.39 | % Realized: -56.78% | RSI: 42.9 | % above MA200: -45.9% | Trend: Below MA20, MA50, MA200
Costar Group, Inc provides commercial real estate information, analytics, and marketing services. Investors should care because its data and platform influence property market dynamics, making it a key player in the $1.4 trillion US commercial real estate market.
CSGP is testing major support at its 2026 YTD low, with RSI(14) at 42.9 indicating neutral momentum. Bearish MA alignment (price < MA20 < MA50 < MA200) and -56.8% 2026 YTD return signal a sustained downtrend, potentially a warning sign.
Related headlines
- CoStar Group Announces Launch of CoStar Platform in France
- CoStar Group to Report Financial Results for Second Quarter on July 28, 2026
- CoStar Group Invests in Wikicasa, Italys Agent-Backed Real Estate Marketplace
- CoStar Group Stockholders Overwhelmingly Reelect Director Nominees and Support Say-on-Pay at Annual Meeting of Stockholders
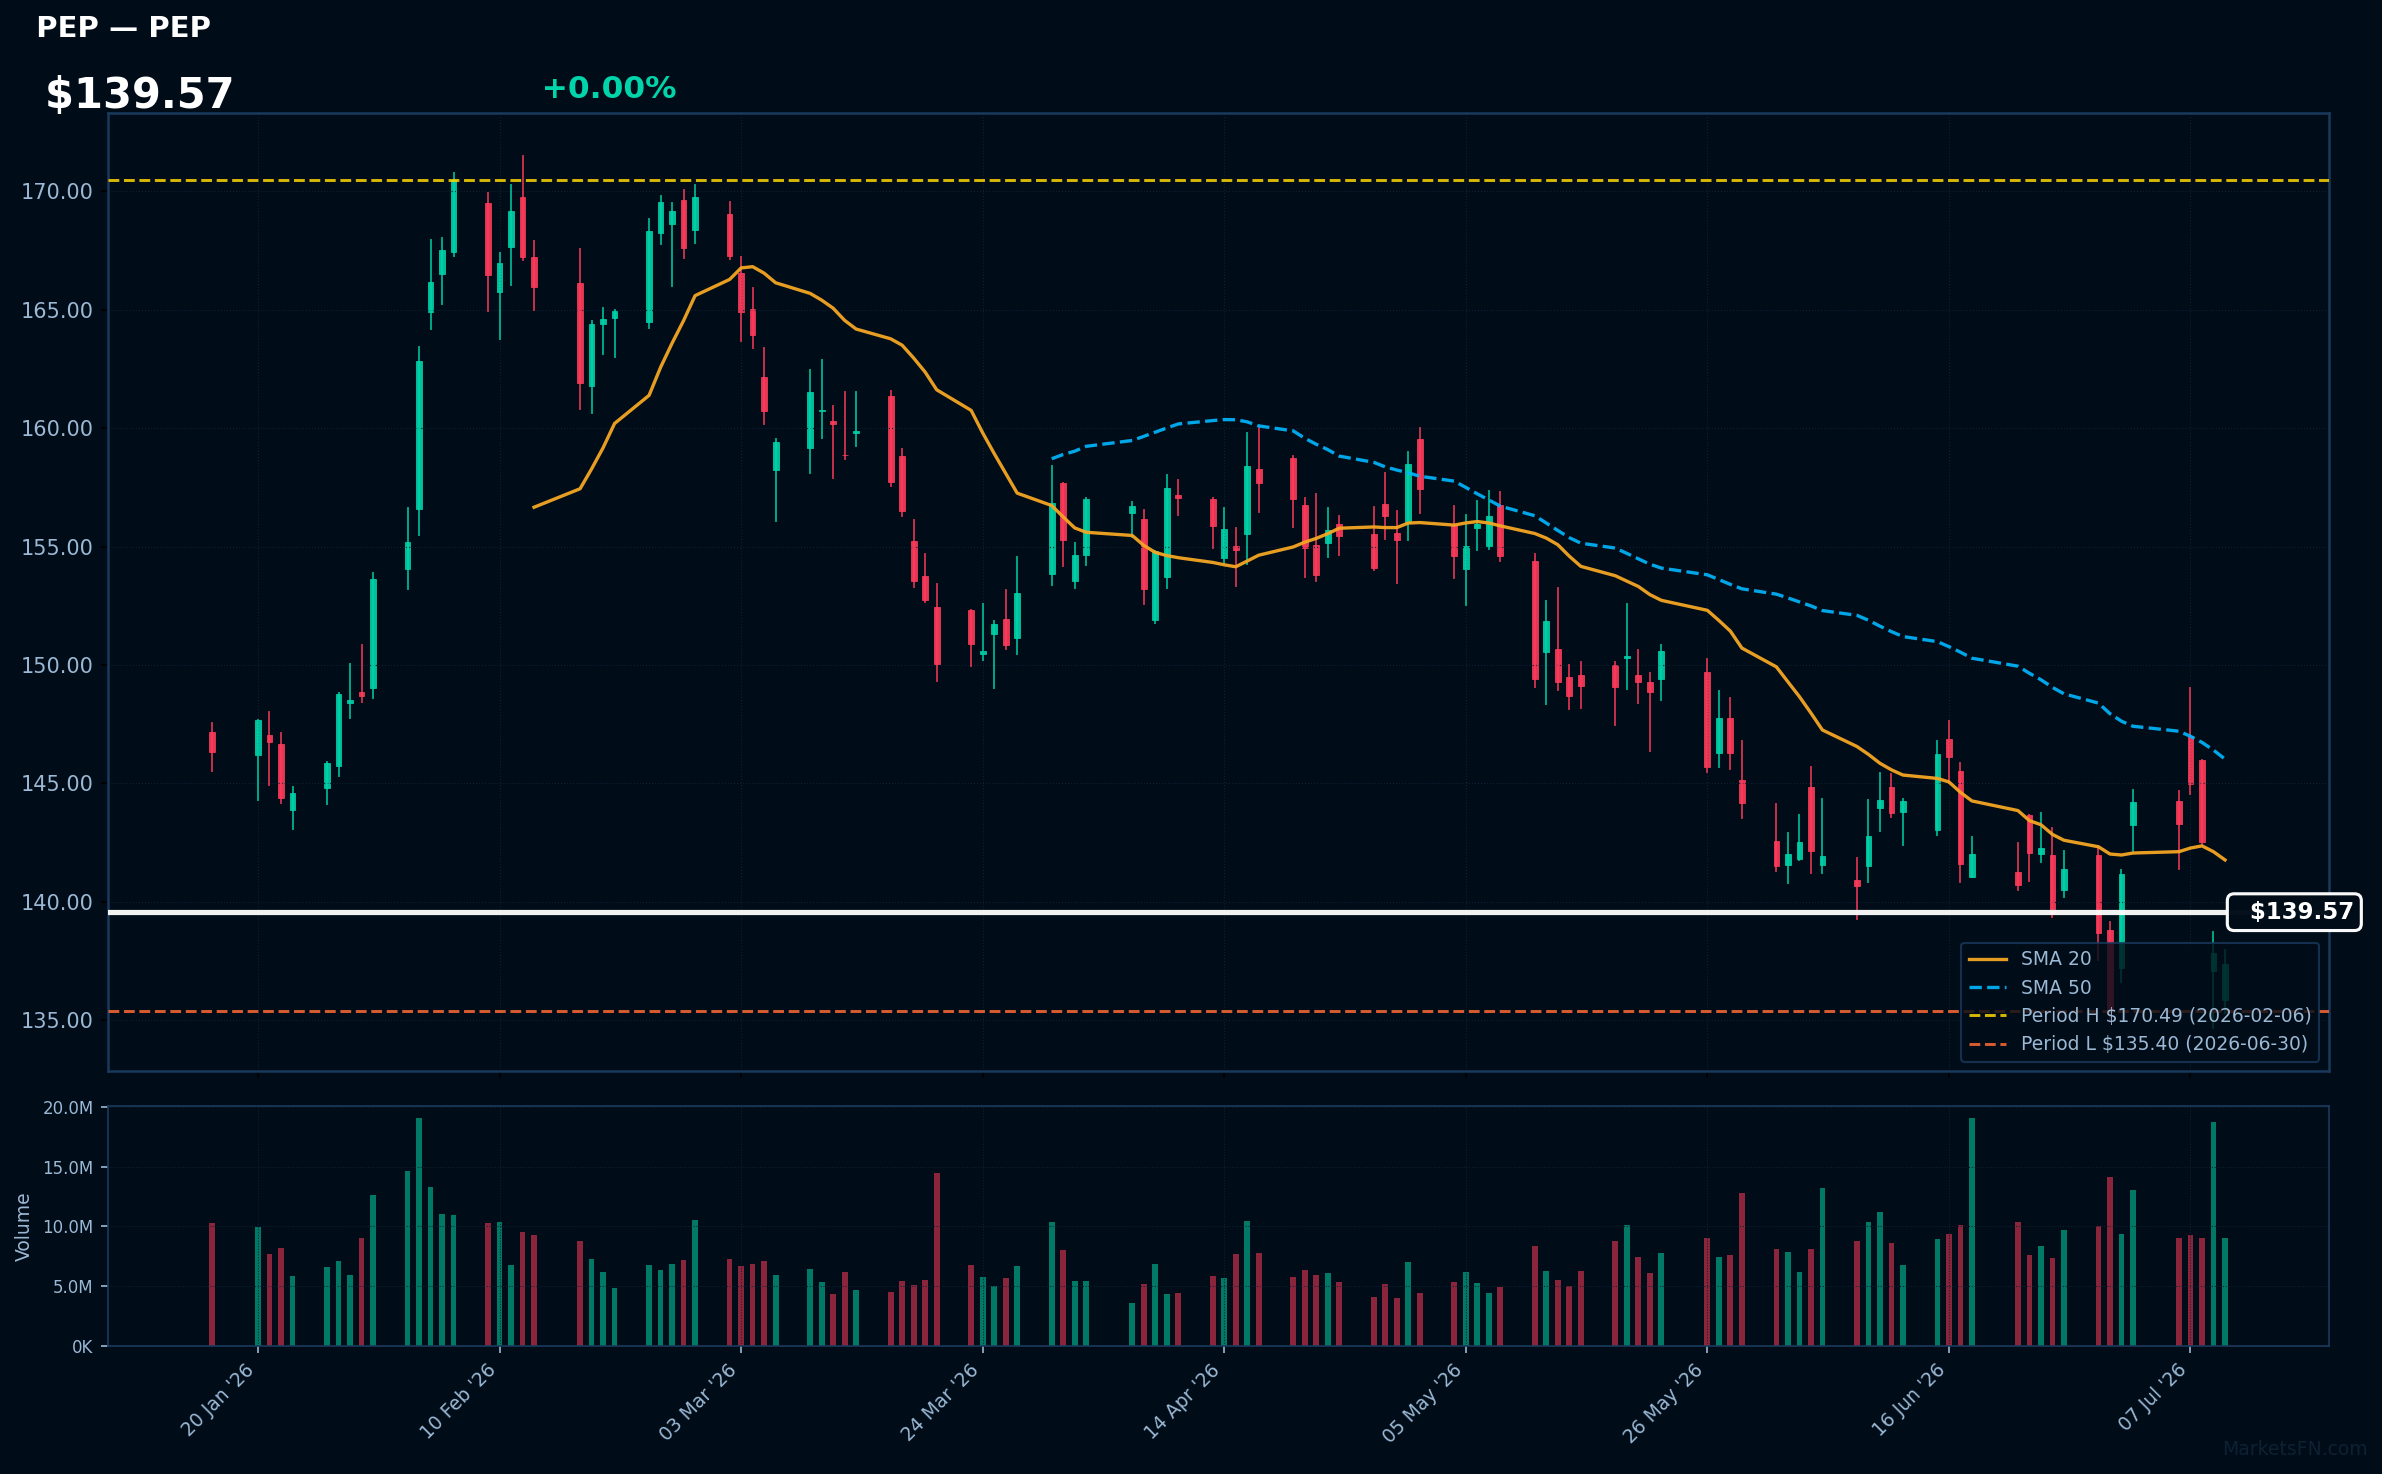
PEP | PepsiCo Inc | Consumer Defensive | Price Last: $137.38 | % Realized: -3.41% | RSI: 44.8 | % above MA200: -8.5% | Trend: Below MA20, MA50, MA200
PepsiCo is a diversified food and beverage company with iconic brands like Pepsi, Lay's, and Gatorade, generating revenue through beverage sales, snack foods, and other categories. Investors care about its stable cash flows and dividend yield.
PepsiCo's technical situation is bearish, with RSI(14) at 44.8, price below MA20, MA50, and MA200, and a -3.4% 2026 YTD return. The stock is 1.5% above its 2026 YTD low, testing major support, indicating a sustained downtrend and potential further decline.
Related headlines
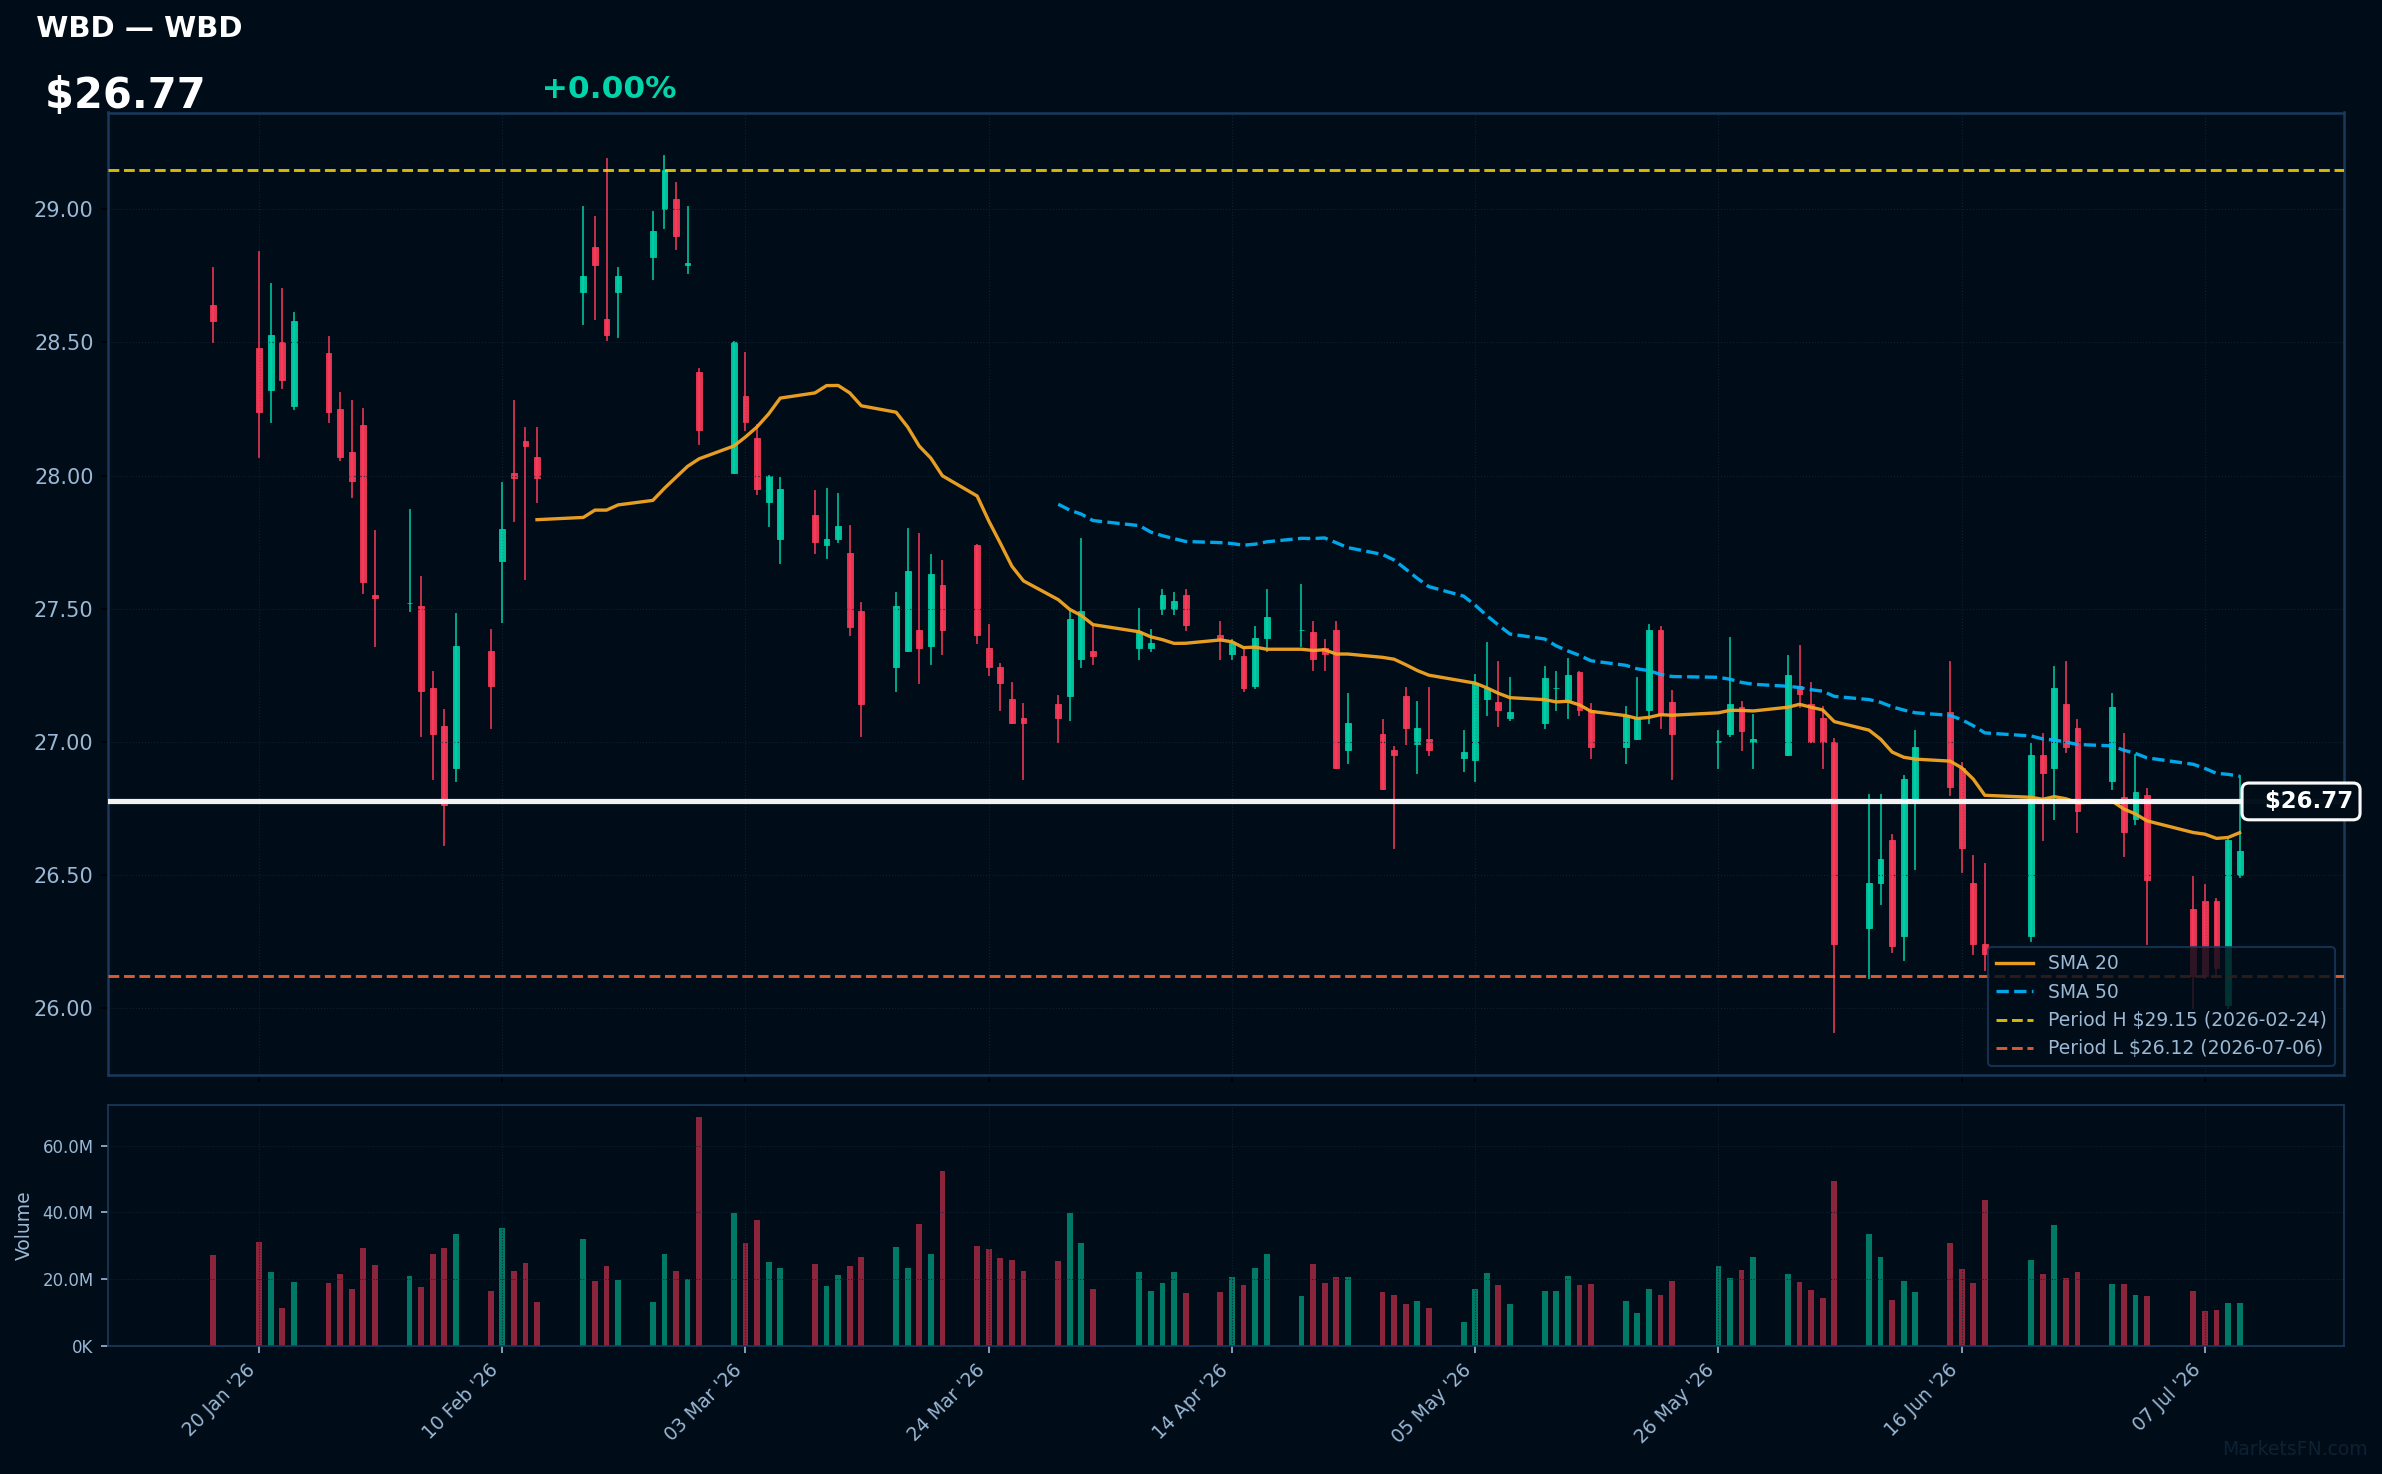
WBD | Warner Bros. Discovery Inc | Communication Services | Price Last: $26.59 | % Realized: -6.73% | RSI: 51.5 | % above MA200: +2.5% | Trend: Above MA200 · Below MA20, MA50
Warner Bros. Discovery Inc is a media conglomerate with a diverse portfolio of entertainment and news assets, including HBO, Warner Bros., and Discovery Channel, making it a significant player in content creation and distribution, which is crucial for investors due to its influence on global media trends.
The stock is testing major support, 1.8% above its 2026 YTD low, with an RSI(14) of 51.5, indicating neutral momentum. Mixed MA signals — above MA20/MA200 but below MA50 — suggest a lack of clear direction, potentially a warning sign for investors.
Related headlines
Market Commentary
The Nasdaq 100 stocks listed are near their 2026 year-to-date (YTD) extremes, with some at their highs and others at their lows. Stocks like CSX, CDW, and EA are at their 2026 highs, indicating strong performance, while AZN and CPRT are at their 2026 lows, suggesting weaker performance.
The technology sector themes and macro conditions driving these moves are not explicitly stated, but the presence of companies like EA and MNST near their highs may indicate a positive outlook for certain tech sub-sectors. Conversely, the presence of AZN and WBD near their lows could be related to challenges in their respective industries or broader market conditions.
Investors and traders should watch the percentage changes from these extremes to gauge the direction of these stocks and the broader Nasdaq 100. Monitoring the performance of these stocks near their YTD extremes can provide insights into sector trends and potential future market movements, with stocks like CSGP and PEP showing slight recoveries from their lows.
Methodology: All 101 Nasdaq 100 constituents screened. Close prices downloaded from 2026-01-01. Period high = highest close since Jan 1 2026; period low = lowest close since Jan 1 2026. Distance = (current price / period extreme − 1) × 100. Technical indicators computed on up to 1 year of daily OHLCV data.
Disclaimer: For informational purposes only. Not investment advice. Past performance is not indicative of future results.

