S&P 500 2026 YTD Highs & Lows Radar: Dell (DELL), McDonald's (MCD) and more
MarketsFN Team

S&P 500 2026 YTD Highs & Lows Radar: Dell (DELL), McDonald's (MCD) and more
Screening all 503 S&P 500 constituents for stocks nearest to their 2026 year-to-date high and their 2026 YTD low. Data as of September 08, 2026. % Realized = total return since Jan 1 2026.
Legend: RSI > 70 = overbought · RSI < 30 = oversold · Green % Realized = positive YTD return · Red = negative.
📈 Nearest to 2026 High
Sectors represented: Energy (2), Technology (1), Communication Services (1), Financial (1)
| Ticker | Company | Sector | Price Last | % Realized | 2026 YTD High Date | RSI | % above MA200 | Trend |
|---|---|---|---|---|---|---|---|---|
| DELL | Dell Technologies Inc | Technology | $524.14 | +310.13% | 2026-09-04 | 63.5 | +105.2% | Above MA20, MA50, MA200 |
| MPC | Marathon Petroleum Corp | Energy | $388.90 | +135.50% | 2026-09-04 | 80.2 | +60.3% | Above MA20, MA50, MA200 |
| VLO | Valero Energy Corp | Energy | $370.72 | +124.26% | 2026-09-04 | 78.1 | +54.1% | Above MA20, MA50, MA200 |
| EA | Electronic Arts, Inc | Communication Services | $209.70 | +0.38% | 2026-08-04 | — | — | — |
| STT | State Street Corp | Financial | $194.26 | +50.51% | 2026-09-04 | 59.0 | +30.0% | Above MA20, MA50, MA200 |
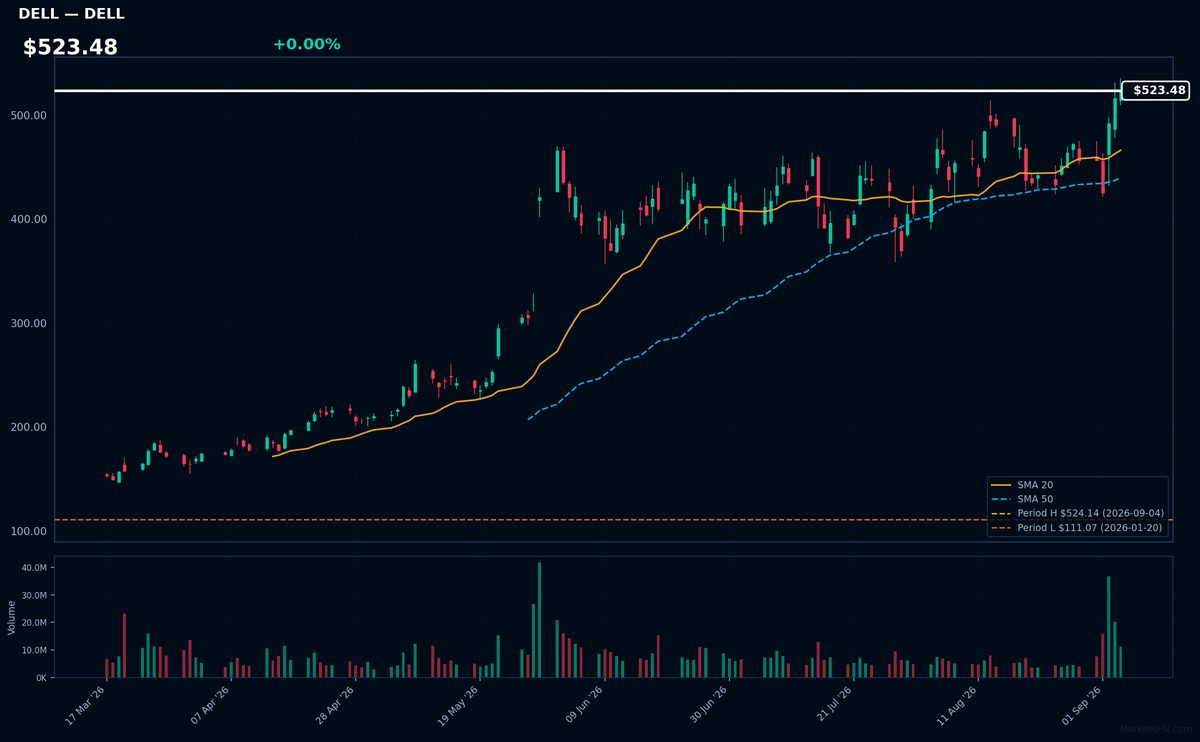
DELL | Dell Technologies Inc | Technology | Price Last: $524.14 | % Realized: +310.13% | RSI: 63.5 | % above MA200: +105.2% | Trend: Above MA20, MA50, MA200
Dell Technologies Inc is a technology company that provides a range of products and services, but specific details about its business operations are not provided in the data; investors should care based on its technical performance.
Dell's current technical situation indicates momentum with an RSI(14) of 63.5 and a bullish MA alignment: price ($523.48) > MA20 > MA50 > MA200, suggesting a sustained uptrend with the stock near its 2026 YTD high.
Related headlines
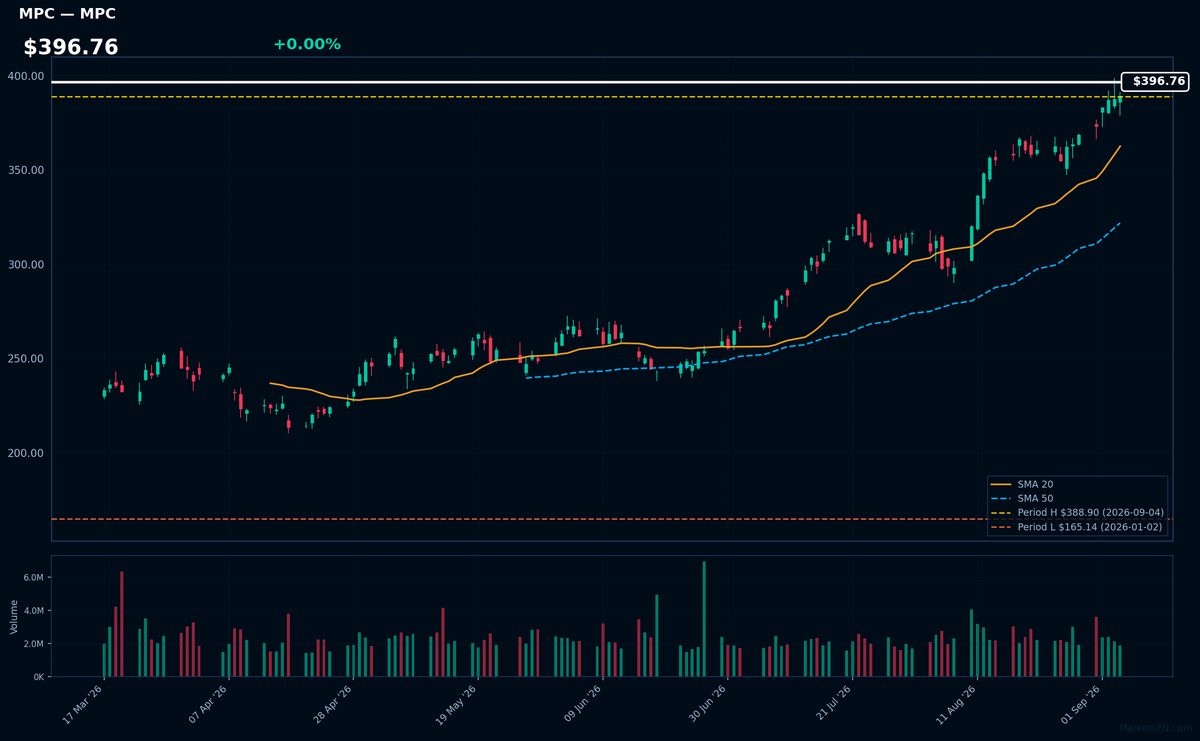
MPC | Marathon Petroleum Corp | Energy | Price Last: $388.90 | % Realized: +135.50% | RSI: 80.2 | % above MA200: +60.3% | Trend: Above MA20, MA50, MA200
Marathon Petroleum Corp is an energy company that refines, markets, and transports petroleum products. Investors should care about its refining capacity, logistics network, and market share, as these drive revenue and profitability in the energy sector.
MPC's RSI(14) is 80.2, indicating overbought conditions. The MA alignment (price > MA20 > MA50 > MA200) suggests a sustained uptrend. With the stock 0.0% below its 2026 YTD high, it may be nearing a breakout level, signaling potential momentum continuation.
Related headlines
- Bull of the Day: Marathon Petroleum (MPC)
- Marathon Petroleum Named a Top 100 Internship Program for the Third Consecutive Year
- PSX, MPC Reportedly Weighed A Giant Merger What Sank The $180B Deal Between Phillips 66 And Marathon Petroleum
- MPC, PSX Stocks Hit All-Time Highs Whats Driving The Rally In These Energy Stocks?
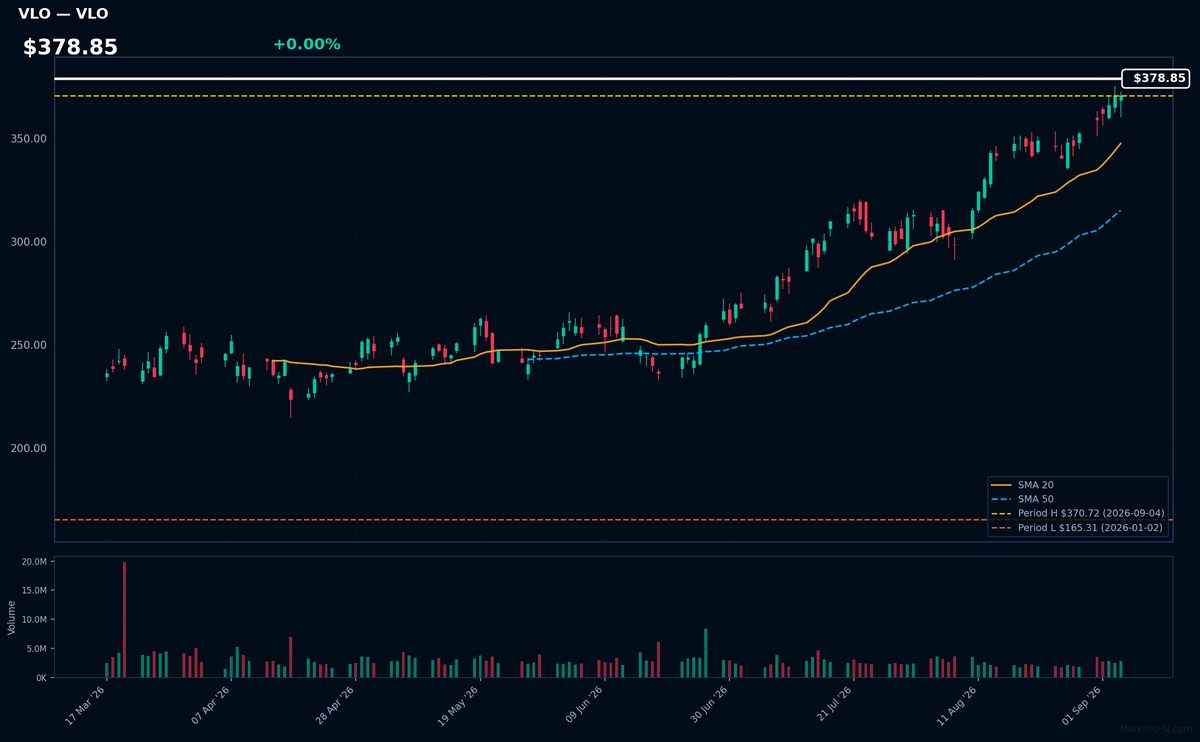
VLO | Valero Energy Corp | Energy | Price Last: $370.72 | % Realized: +124.26% | RSI: 78.1 | % above MA200: +54.1% | Trend: Above MA20, MA50, MA200
Valero Energy Corp is a refining company that operates a significant number of refineries, producing fuels such as gasoline and diesel. Investors should care because its refining operations are crucial to the global energy supply chain, and its performance is closely tied to energy prices.
Valero Energy Corp's current technical situation indicates strong momentum, with an RSI(14) of 78.1 and a bullish MA alignment (price > MA20 > MA50 > MA200). The stock is near its 2026 YTD high, up 124.3% YTD, suggesting a potential breakout.
Related headlines
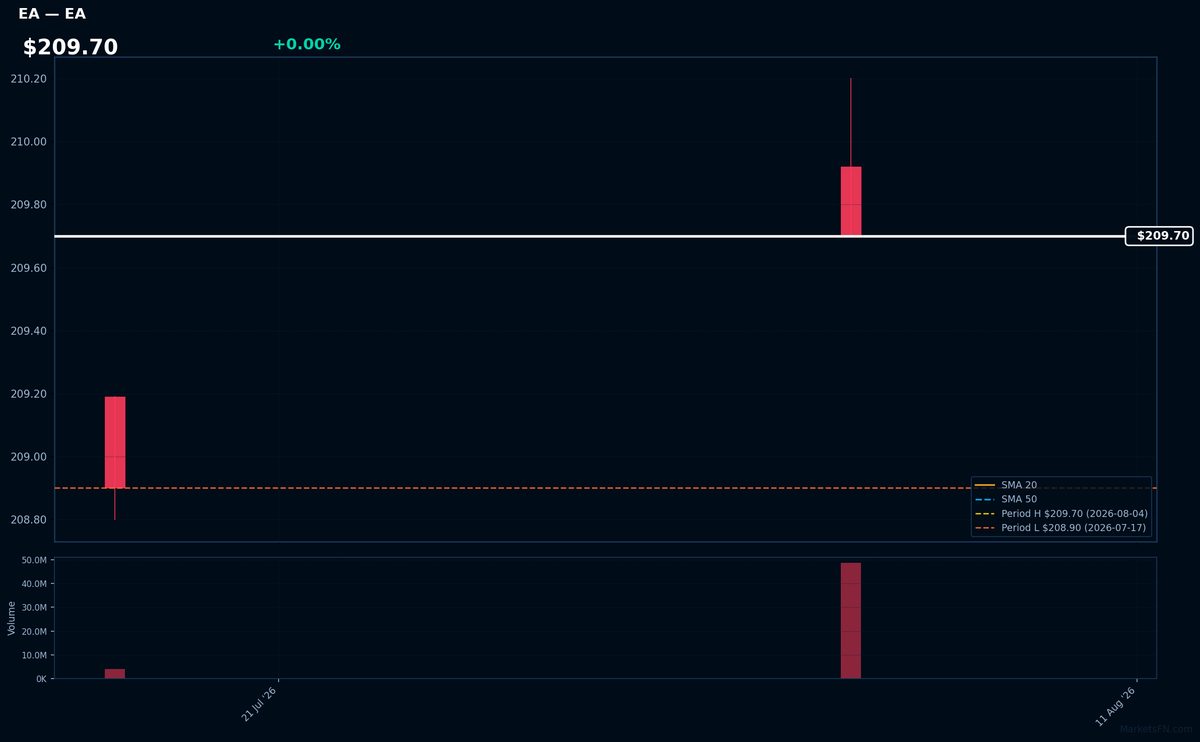
EA | Electronic Arts, Inc | Communication Services | Price Last: $209.70 | % Realized: +0.38% | RSI: — | % above MA200: — | Trend: —
Electronic Arts, Inc (EA) is a leading interactive entertainment software company. Investors should care because EA is a major player in the gaming industry, with popular franchises like FIFA and Madden NFL, generating significant revenue.
The stock is near a potential breakout level, 0.0% below its 2026 YTD high, with a 0.4% return over the 2026 YTD period. However, RSI and MA data are incomplete, so momentum and trend alignment cannot be assessed.
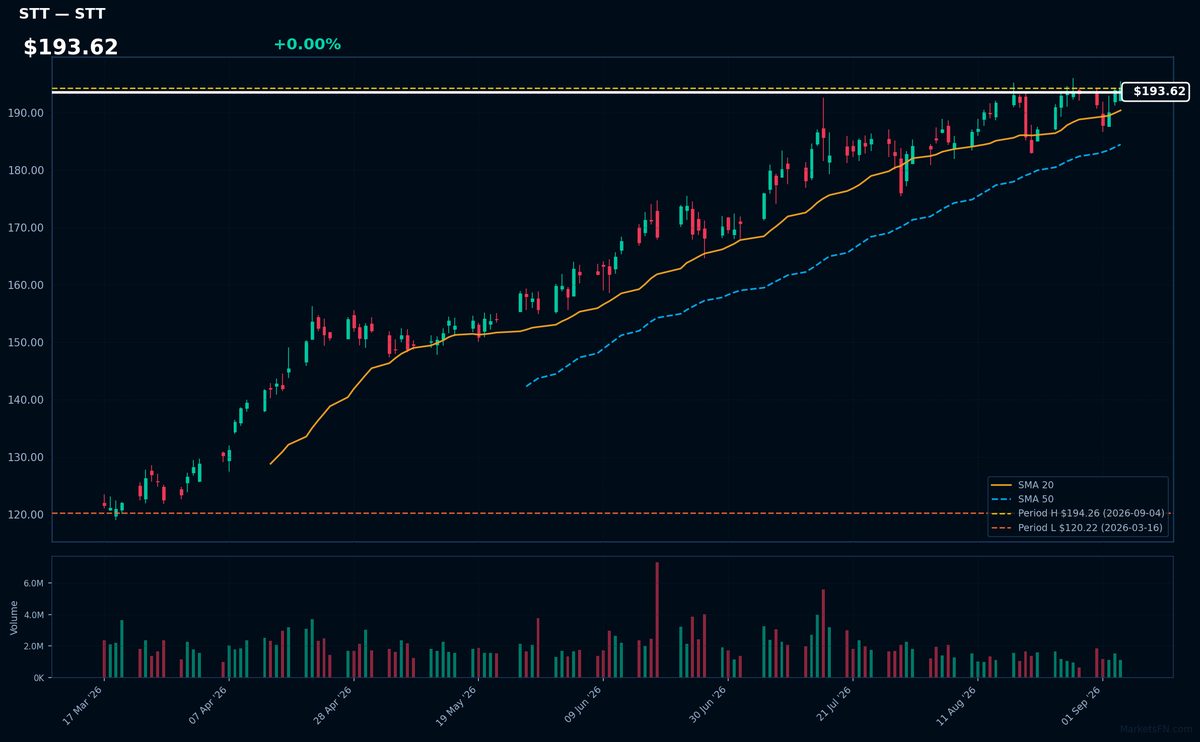
STT | State Street Corp | Financial | Price Last: $194.26 | % Realized: +50.51% | RSI: 59.0 | % above MA200: +30.0% | Trend: Above MA20, MA50, MA200
State Street Corp is a financial services company providing custody, research, and trading services to institutional investors. Investors should care because its performance reflects the health of the global asset management industry.
State Street Corp's technicals indicate sustained uptrend with price at $193.62, RSI(14) at 59.0, and MA alignment: price > MA20 > MA50 > MA200. Near its 2026 YTD high, it's 0.0% below, suggesting potential breakout momentum.
Related headlines
📉 Nearest to 2026 Low
Sectors represented: Industrials (2), Consumer Cyclical (1), Real Estate (1), Consumer Defensive (1)
| Ticker | Company | Sector | Price Last | % Realized | 2026 YTD Low Date | RSI | % above MA200 | Trend |
|---|---|---|---|---|---|---|---|---|
| MCD | McDonald's Corp | Consumer Cyclical | $255.69 | -15.69% | 2026-09-04 | 33.8 | -13.5% | Below MA20, MA50, MA200 |
| LHX | L3Harris Technologies Inc | Industrials | $256.45 | -15.77% | 2026-09-04 | 31.0 | -18.3% | Below MA20, MA50, MA200 |
| VICI | VICI Properties Inc | Real Estate | $25.42 | -9.70% | 2026-09-04 | 38.3 | -8.7% | Below MA20, MA50, MA200 |
| XYL | Xylem Inc | Industrials | $105.69 | -22.92% | 2026-09-04 | 34.3 | -14.8% | Below MA20, MA50, MA200 |
| STZ | Constellation Brands Inc | Consumer Defensive | $128.18 | -9.20% | 2026-09-04 | 43.6 | -11.7% | Below MA20, MA50, MA200 |
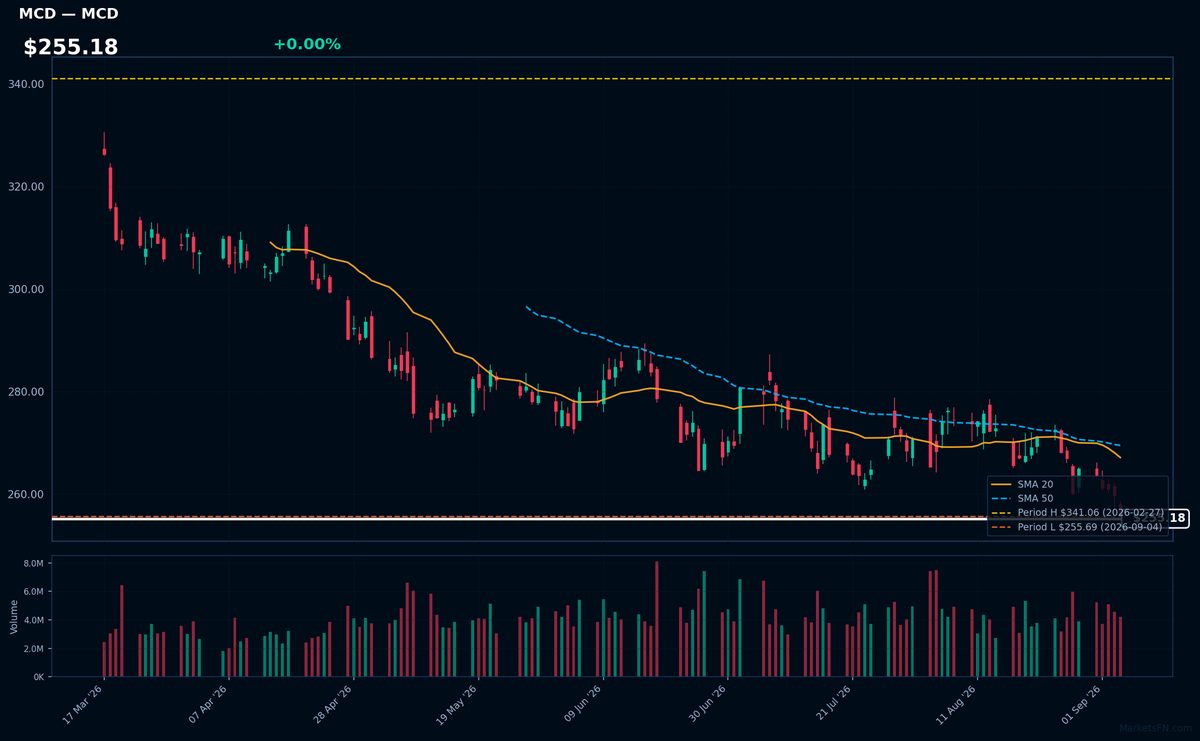
MCD | McDonald's Corp | Consumer Cyclical | Price Last: $255.69 | % Realized: -15.69% | RSI: 33.8 | % above MA200: -13.5% | Trend: Below MA20, MA50, MA200
McDonald's Corp operates quick-service restaurants, serving burgers, fries, and beverages globally. Investors should care about its brand strength, global footprint, and operational efficiency, as these factors influence revenue growth and profitability.
McDonald's Corp is in a sustained downtrend with price ($255.18) below MA20, MA50, and MA200. The RSI(14) is 33.8, near oversold territory, and the stock is testing major support at its 2026 YTD low, indicating a potential warning sign.
Related headlines
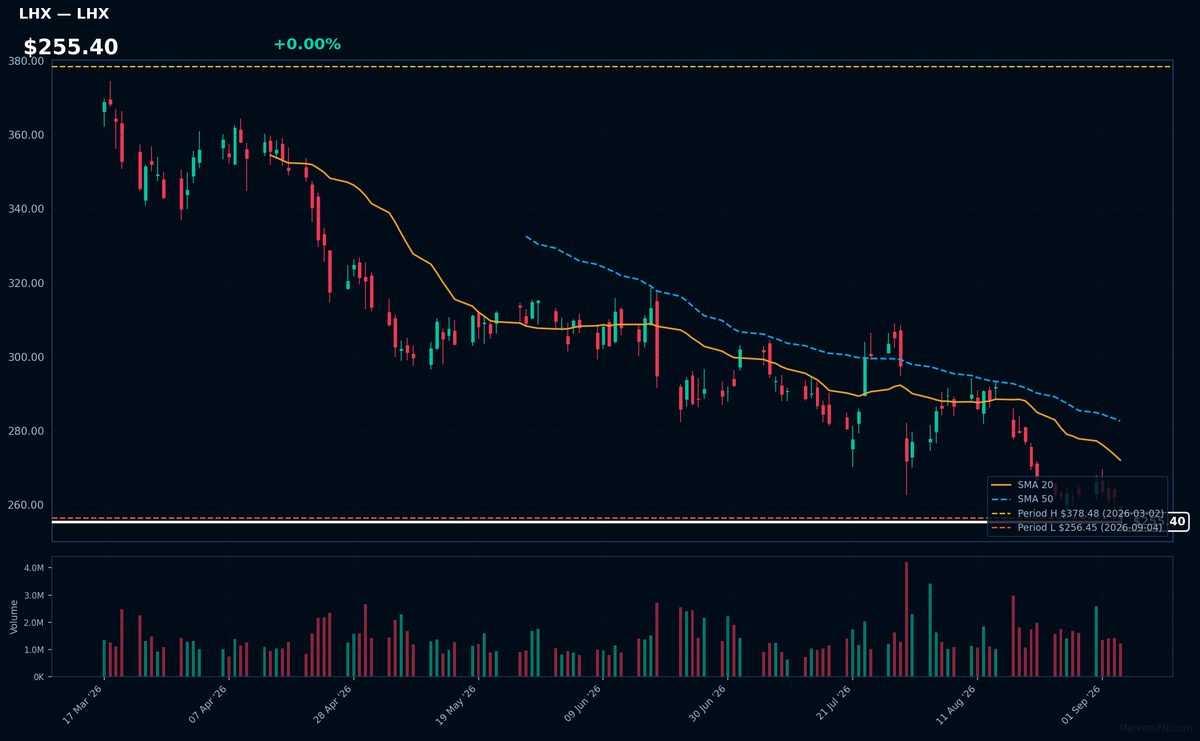
LHX | L3Harris Technologies Inc | Industrials | Price Last: $256.45 | % Realized: -15.77% | RSI: 31.0 | % above MA200: -18.3% | Trend: Below MA20, MA50, MA200
L3Harris Technologies Inc is a defense technology company providing advanced defense and commercial technologies. Investors should care due to its significant role in the defense industry, with potential impacts from government spending and technological advancements.
L3Harris is in a sustained downtrend with price ($255.40) below MA20, MA50, and MA200. The RSI(14) is 31.0, near oversold territory, and the stock is at its 2026 YTD low, indicating a potential warning sign.
Related headlines
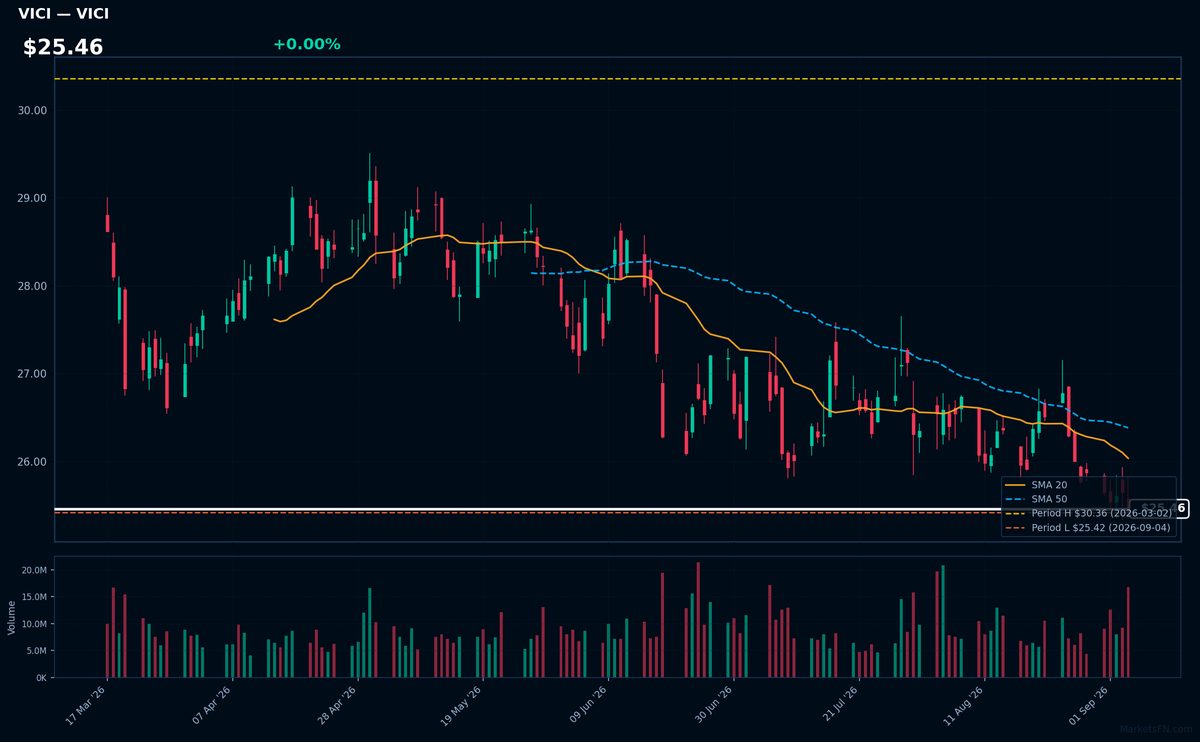
VICI | VICI Properties Inc | Real Estate | Price Last: $25.42 | % Realized: -9.70% | RSI: 38.3 | % above MA200: -8.7% | Trend: Below MA20, MA50, MA200
VICI Properties Inc is a real estate investment trust (REIT) that owns and acquires entertainment, hospitality, and gaming properties. Investors should care because its performance is tied to the recovery and growth of these industries.
VICI is testing major support with its price 0.0% above its 2026 YTD low. The RSI(14) is 38.3, and the MA alignment is bearish (price < MA20 < MA50 < MA200), indicating a sustained downtrend and potential further decline.
Related headlines
- VICI Properties Inc. to Appoint John M. Sullivan as Independent Director
- VICI Properties Inc. Increases Regular Quarterly Dividend
- VICI Properties Announces Closing of $1.75 Billion Senior Unsecured Notes Offering
- VICI Properties Announces Pricing of Public Offering of $1.75 Billion of Senior Unsecured Notes
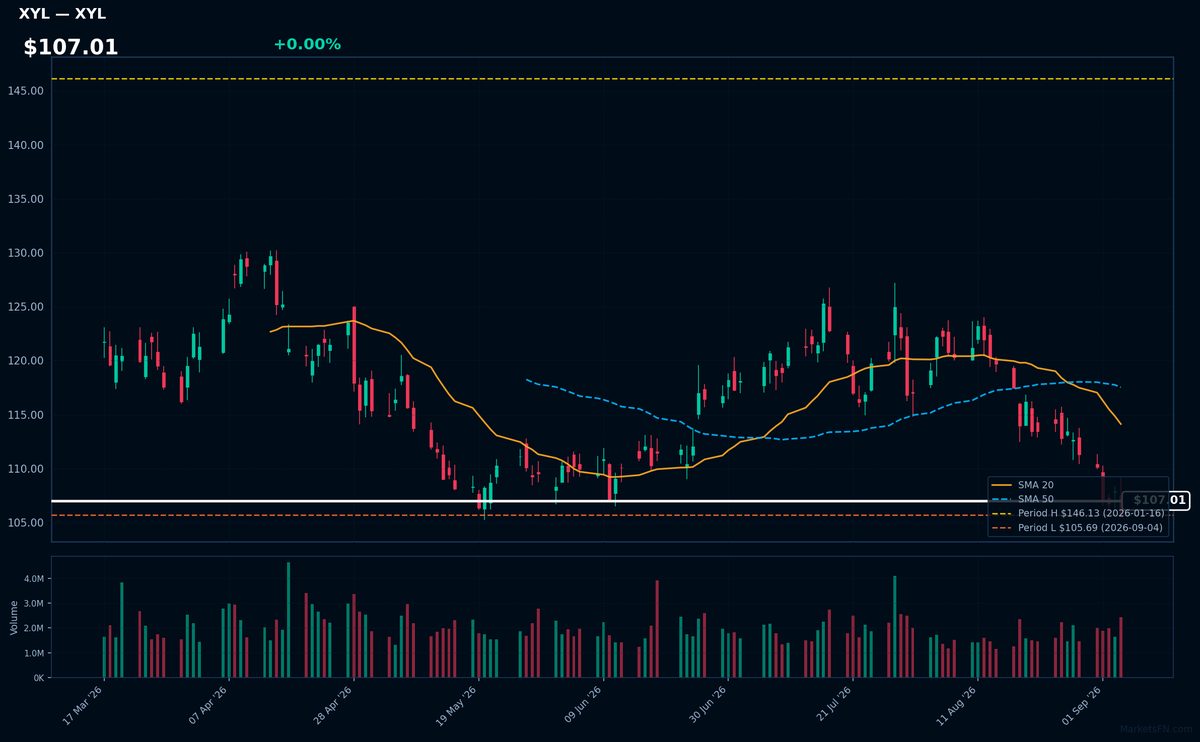
XYL | Xylem Inc | Industrials | Price Last: $105.69 | % Realized: -22.92% | RSI: 34.3 | % above MA200: -14.8% | Trend: Below MA20, MA50, MA200
Xylem Inc (XYL) provides water technology solutions, including pumps, valves, and treatment systems, helping industries and municipalities manage water resources efficiently. Investors should care as the company's products address critical global water challenges, driving growth potential.
XYL's technical situation is bearish, with an RSI(14) of 34.3 indicating oversold conditions and a sustained downtrend as price ($107.01) remains below MA20, MA50, and MA200. The stock is testing major support at its 2026 YTD low.
Related headlines
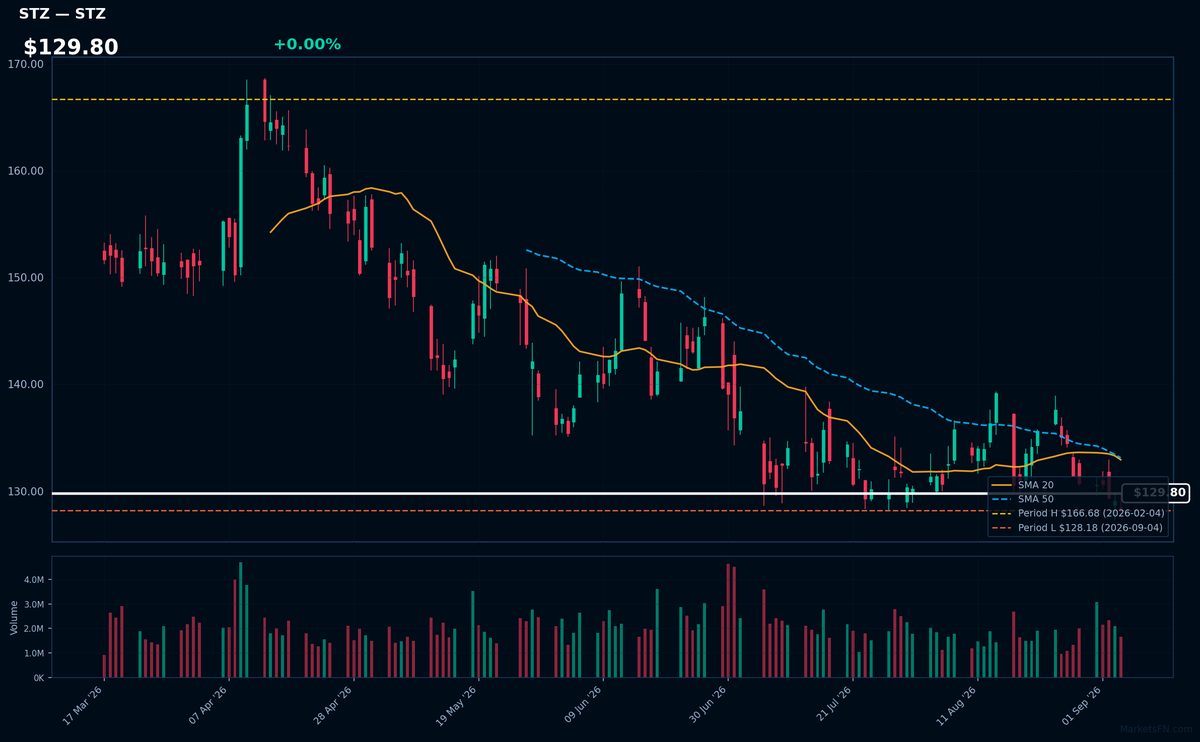
STZ | Constellation Brands Inc | Consumer Defensive | Price Last: $128.18 | % Realized: -9.20% | RSI: 43.6 | % above MA200: -11.7% | Trend: Below MA20, MA50, MA200
Constellation Brands Inc is a leading beverage alcohol company owning popular beer brands like Corona and Modelo, and wine brands such as Robert Mondavi and Kim Crawford, making it a significant player in the global alcoholic beverages market.
The stock is in a sustained downtrend with price ($129.80) below MA20, MA50, and MA200. RSI(14) is 43.6, nearing oversold territory. Testing major support at its 2026 YTD low, the -9.2% YTD return indicates bearish momentum.
Related headlines
- Beer giant Constellation Brands invests $100M in US farm profitability
- Constellation Brands to Present at the 2026 Barclays Global Consumer Conference on September 8, 2026
- Constellation Brands Announces $100 Million Investment to Support U.S. Farmers
- Constellation Brands Inc. Cl A stock underperforms Monday when compared to competitors
Market Commentary
The S&P 500 stocks listed are currently trading near their year-to-date (YTD) extremes for 2026. Specifically, DELL, MPC, VLO, EA, and STT are at their YTD highs, while MCD, LHX, VICI, XYL, and STZ are at their YTD lows, with the latter group having moved up by +0.0% from their lows.
The stocks near their YTD highs are from diverse sectors, including technology (DELL, EA), energy (MPC, VLO), and finance (STT), indicating broad-based strength. Conversely, the stocks near their YTD lows are from sectors such as consumer staples (MCD), industrials (LHX, XYL), and consumer discretionary (STZ), with VICI representing real estate. This divergence may reflect varying market conditions and sector-specific themes.
Investors should monitor these stocks for signs of continued trend or reversal. As these equities are at their YTD extremes, a breakout or breakdown could signal broader market direction. Watching sector-specific news and earnings reports for these companies may provide insight into the underlying drivers of their current price levels.
Methodology: All 503 S&P 500 constituents screened. Close prices downloaded from 2026-01-01. Period high = highest close since Jan 1 2026; period low = lowest close since Jan 1 2026. Distance = (current price / period extreme − 1) × 100. Technical indicators computed on up to 1 year of daily OHLCV data.
Disclaimer: For informational purposes only. Not investment advice. Past performance is not indicative of future results.