S&P 500 2026 YTD Highs & Lows Radar: Dell (DELL), TJXmpanies, (TJX) and more
MarketsFN Team

S&P 500 2026 YTD Highs & Lows Radar: Dell (DELL), TJXmpanies, (TJX) and more
Screening all 503 S&P 500 constituents for stocks nearest to their 2026 year-to-date high and their 2026 YTD low. Data as of September 09, 2026. % Realized = total return since Jan 1 2026.
Legend: RSI > 70 = overbought · RSI < 30 = oversold · Green % Realized = positive YTD return · Red = negative.
📈 Nearest to 2026 High
Sectors represented: Energy (4), Technology (1)
| Ticker | Company | Sector | Price Last | % Realized | 2026 YTD High Date | RSI | % above MA200 | Trend |
|---|---|---|---|---|---|---|---|---|
| DELL | Dell Technologies Inc | Technology | $533.88 | +317.75% | 2026-09-08 | 67.9 | +107.2% | Above MA20, MA50, MA200 |
| MPC | Marathon Petroleum Corp | Energy | $397.77 | +140.87% | 2026-09-08 | 79.5 | +63.2% | Above MA20, MA50, MA200 |
| PSX | Phillips 66 | Energy | $259.14 | +98.47% | 2026-09-08 | 78.0 | +49.2% | Above MA20, MA50, MA200 |
| VLO | Valero Energy Corp | Energy | $382.85 | +131.60% | 2026-09-08 | 79.7 | +58.4% | Above MA20, MA50, MA200 |
| OKE | Oneok Inc | Energy | $97.51 | +31.17% | 2026-09-08 | 66.7 | +14.4% | Above MA20, MA50, MA200 |
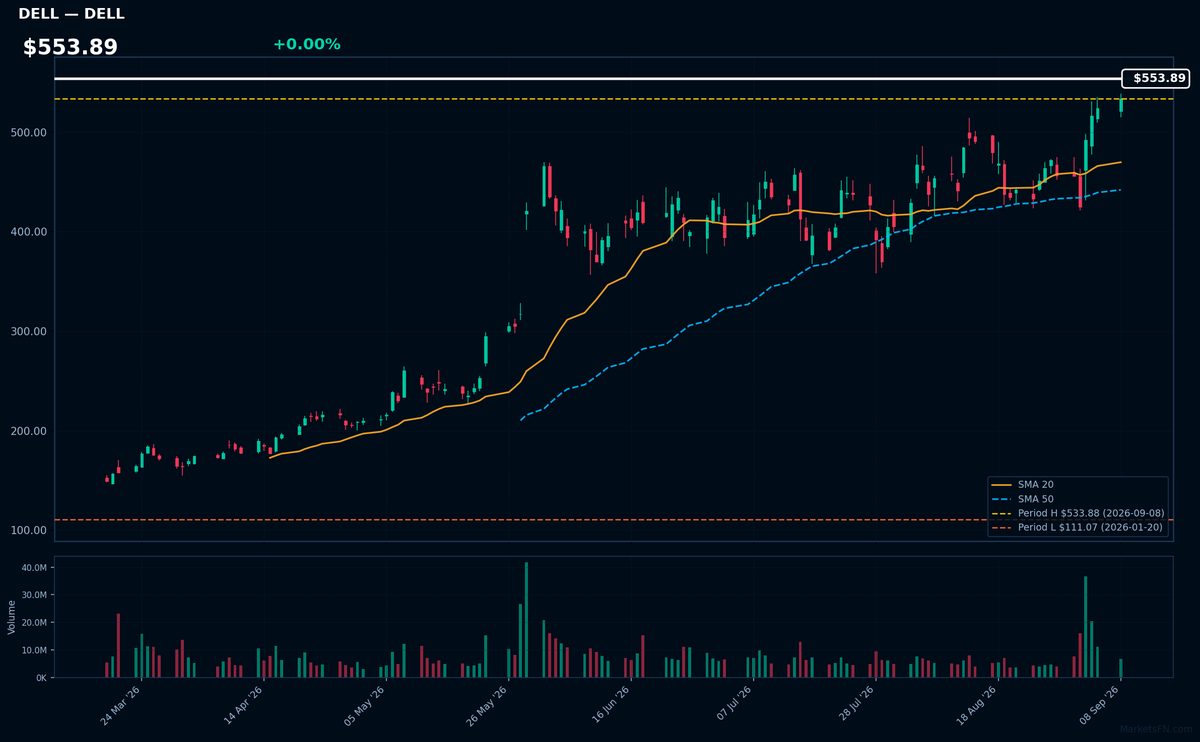
DELL | Dell Technologies Inc | Technology | Price Last: $533.88 | % Realized: +317.75% | RSI: 67.9 | % above MA200: +107.2% | Trend: Above MA20, MA50, MA200
Dell Technologies Inc is a technology company that provides a range of products and services, but specific details about its business operations are not provided in the data; investors should care based on its technical performance.
Dell's current technical situation indicates strong momentum: RSI(14) is 67.9, with a bullish MA alignment (price > MA20 > MA50 > MA200) and a 317.7% 2026 YTD return, near its YTD high.
Related headlines
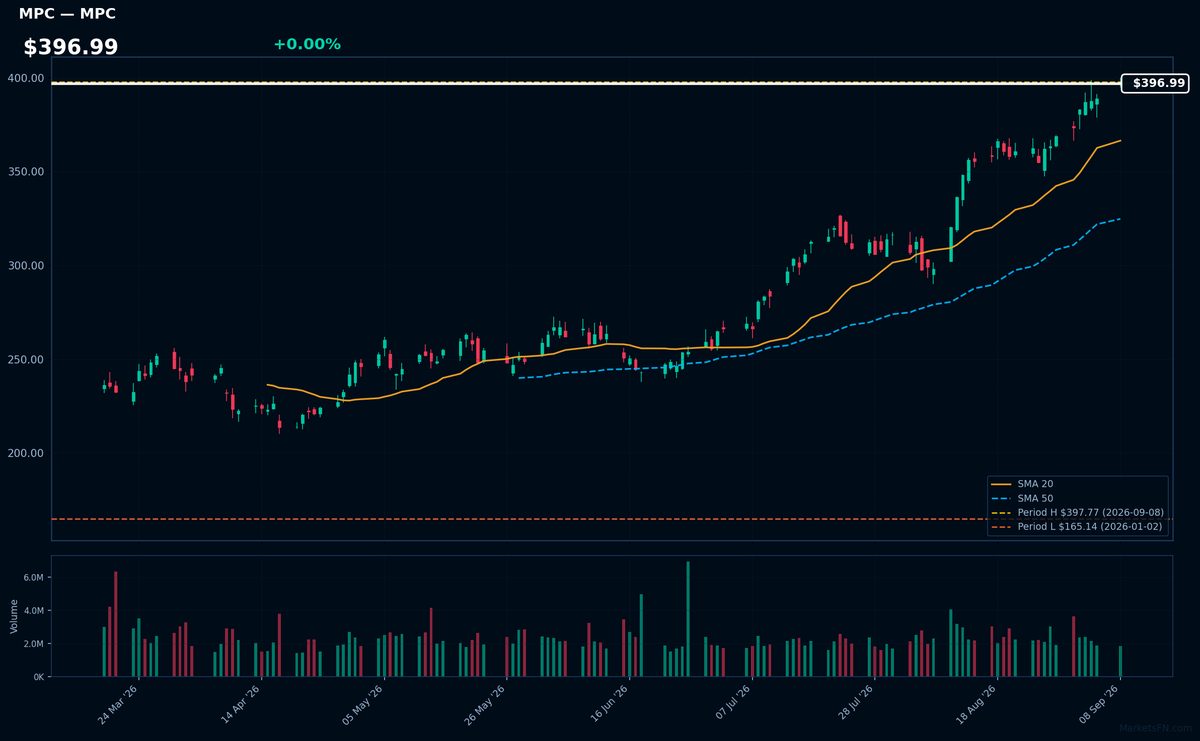
MPC | Marathon Petroleum Corp | Energy | Price Last: $397.77 | % Realized: +140.87% | RSI: 79.5 | % above MA200: +63.2% | Trend: Above MA20, MA50, MA200
Marathon Petroleum Corp is an energy company that refines, markets, and transports petroleum products. Investors should care because its performance is tied to energy demand, refining margins, and supply chain dynamics, making it sensitive to global economic trends and energy price fluctuations.
Marathon Petroleum Corp's RSI(14) is 79.5, indicating overbought conditions. The MA alignment is bullish with price > MA20 > MA50 > MA200, showing a sustained uptrend. The stock is 0.0% below its 2026 YTD high, near a potential breakout level, suggesting momentum.
Related headlines
- Bull of the Day: Marathon Petroleum (MPC)
- Marathon Petroleum Named a Top 100 Internship Program for the Third Consecutive Year
- PSX, MPC Reportedly Weighed A Giant Merger What Sank The $180B Deal Between Phillips 66 And Marathon Petroleum
- MPC, PSX Stocks Hit All-Time Highs Whats Driving The Rally In These Energy Stocks?
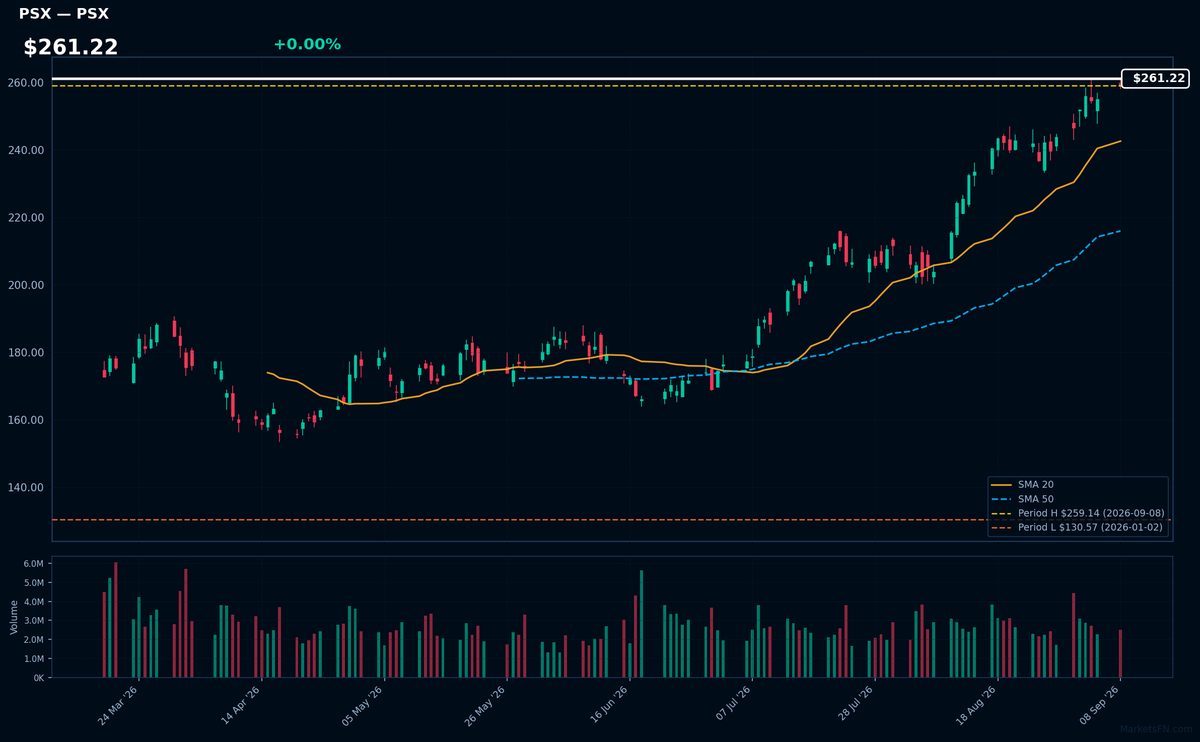
PSX | Phillips 66 | Energy | Price Last: $259.14 | % Realized: +98.47% | RSI: 78.0 | % above MA200: +49.2% | Trend: Above MA20, MA50, MA200
Phillips 66 is a diversified energy company with refining, midstream, and marketing segments. Investors should care about its refining margins, pipeline throughput, and branded fuel sales, which drive revenue and profitability.
Phillips 66's RSI(14) is 78.0, indicating strong momentum. With price > MA20 > MA50 > MA200 and 0.0% below its 2026 YTD high, the stock shows a sustained uptrend and potential breakout, suggesting continued momentum.
Related headlines
- Bill Nygren's Bold Q2 2026 Move: Trimming Phillips 66 for a -1.81% Portfolio Impact
- PSX, MPC Reportedly Weighed A Giant Merger What Sank The $180B Deal Between Phillips 66 And Marathon Petroleum
- Phillips 66 and partners approve $5bn Western Gateway Pipeline
- MPC, PSX Stocks Hit All-Time Highs Whats Driving The Rally In These Energy Stocks?
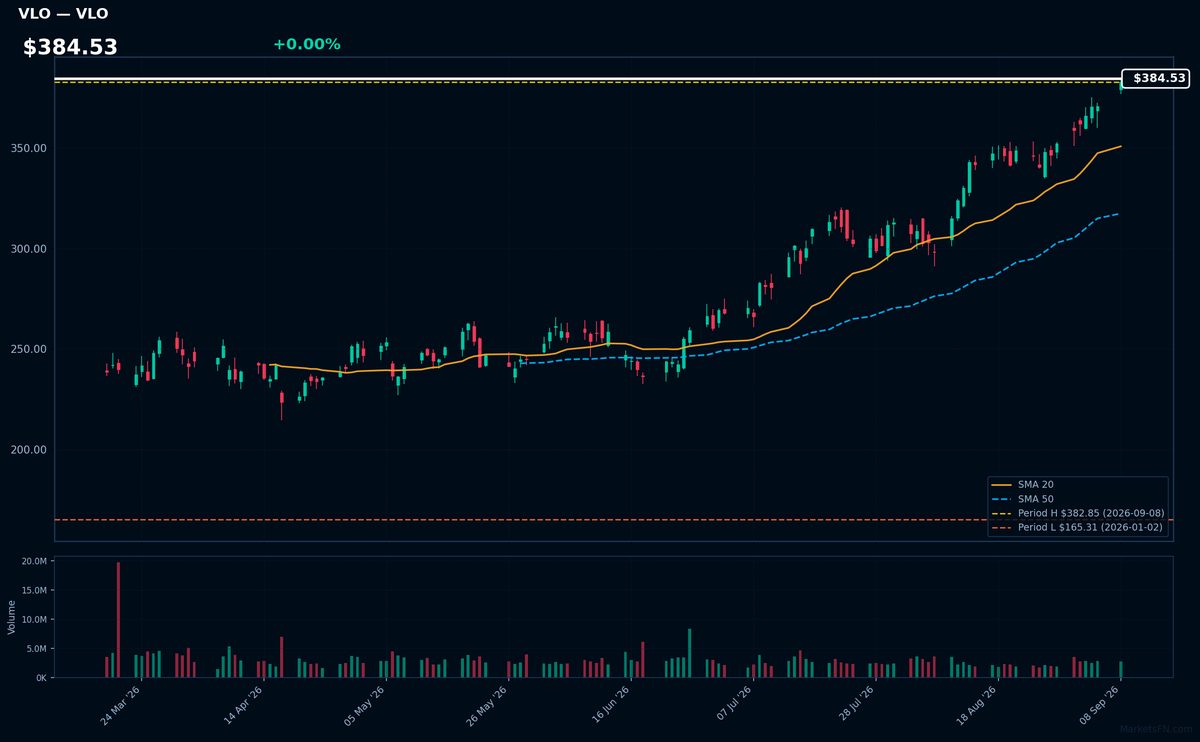
VLO | Valero Energy Corp | Energy | Price Last: $382.85 | % Realized: +131.60% | RSI: 79.7 | % above MA200: +58.4% | Trend: Above MA20, MA50, MA200
Valero Energy Corp (VLO) operates as an independent petroleum refiner and marketer, converting crude oil into gasoline, diesel, and other products. Investors should care about its refining margins and operational efficiency, which drive profitability in a volatile energy market.
Valero Energy Corp's RSI(14) is 79.7, indicating overbought conditions. The MA alignment is bullish with price > MA20 > MA50 > MA200, showing a sustained uptrend. The stock is 0.0% below its 2026 YTD high, nearing a potential breakout.
Related headlines
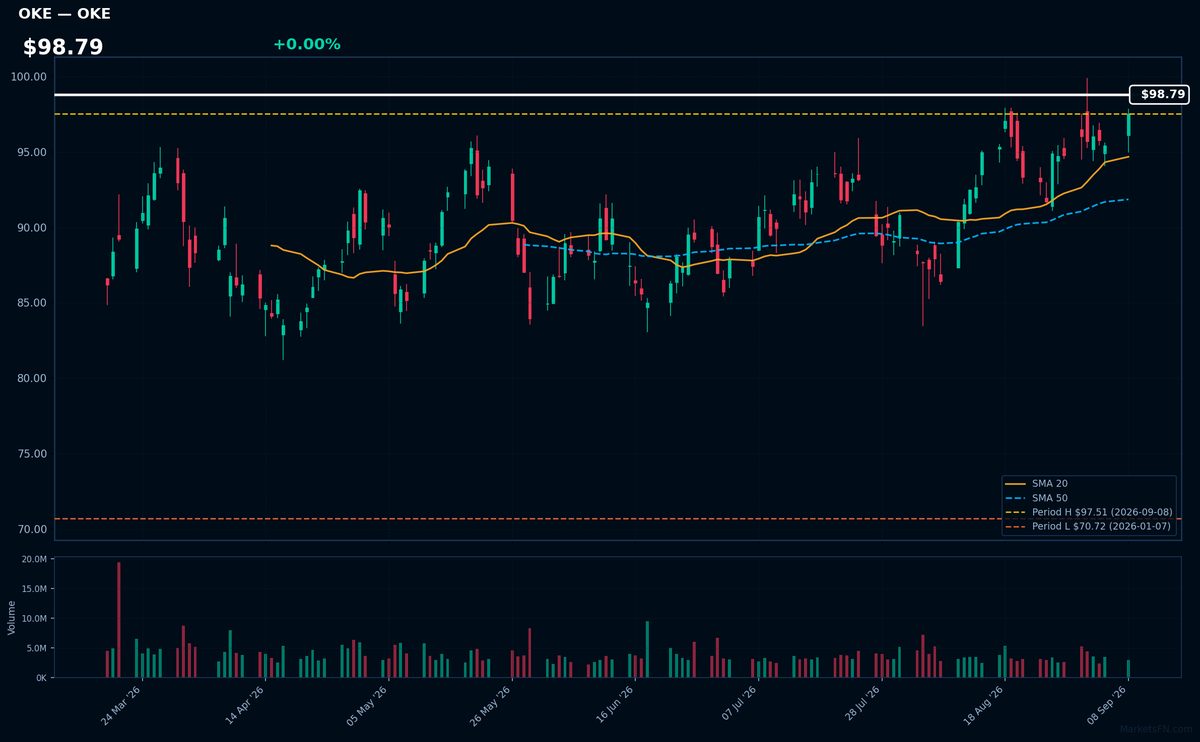
OKE | Oneok Inc | Energy | Price Last: $97.51 | % Realized: +31.17% | RSI: 66.7 | % above MA200: +14.4% | Trend: Above MA20, MA50, MA200
Oneok Inc is a midstream service provider operating in the energy sector, primarily involved in the gathering, processing, and transportation of natural gas and natural gas liquids; investors should care due to its critical infrastructure role and potential for steady cash flows.
Oneok Inc's current technical situation indicates momentum, with an RSI(14) of 66.7 and a bullish MA alignment (price > MA20 > MA50 > MA200), suggesting a sustained uptrend; it's near a potential breakout level, 0.0% below its 2026 YTD high.
Related headlines
📉 Nearest to 2026 Low
Sectors represented: Consumer Cyclical (2), Healthcare (2), Industrials (1)
| Ticker | Company | Sector | Price Last | % Realized | 2026 YTD Low Date | RSI | % above MA200 | Trend |
|---|---|---|---|---|---|---|---|---|
| TJX | TJX Companies, Inc | Consumer Cyclical | $128.92 | -16.44% | 2026-09-08 | 18.1 | -16.6% | Below MA20, MA50, MA200 |
| SYK | Stryker Corp | Healthcare | $276.43 | -20.61% | 2026-09-08 | 24.2 | -18.1% | Below MA20, MA50, MA200 |
| NKE | Nike, Inc | Consumer Cyclical | $38.10 | -39.79% | 2026-09-08 | 35.2 | -25.5% | Below MA20, MA50, MA200 |
| LHX | L3Harris Technologies Inc | Industrials | $255.74 | -16.01% | 2026-09-08 | 33.3 | -18.5% | Below MA20, MA50, MA200 |
| IDXX | Idexx Laboratories, Inc | Healthcare | $520.21 | -22.36% | 2026-09-08 | 35.5 | -14.1% | Below MA20, MA50, MA200 |
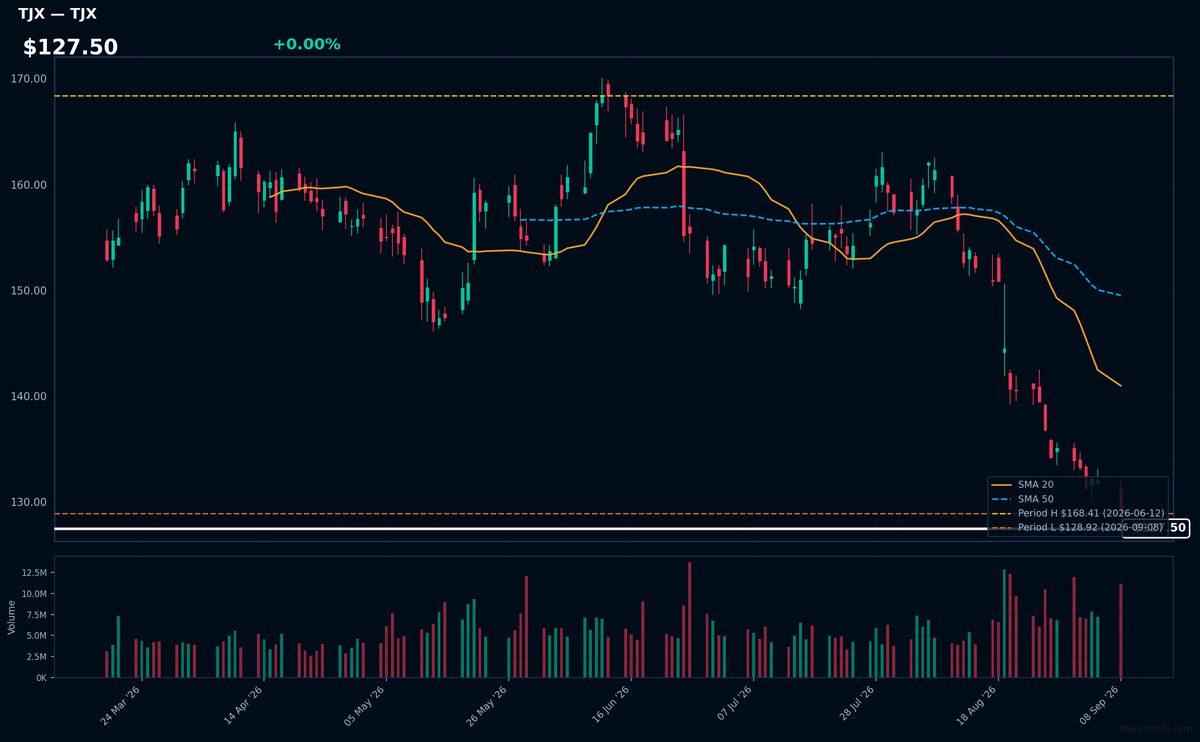
TJX | TJX Companies, Inc | Consumer Cyclical | Price Last: $128.92 | % Realized: -16.44% | RSI: 18.1 | % above MA200: -16.6% | Trend: Below MA20, MA50, MA200
TJX Companies, Inc operates as an off-price retailer, selling brand-name clothing, home goods, and accessories at discounted prices. Investors should care due to its significant market presence and potential for margin expansion or contraction impacting profitability.
TJX is in a sustained downtrend with price ($127.50) below MA20, MA50, and MA200. The RSI(14) is 18.1, indicating oversold conditions. The stock is testing major support, having fallen -16.4% YTD 2026, and is 0.0% above its YTD low.
Related headlines
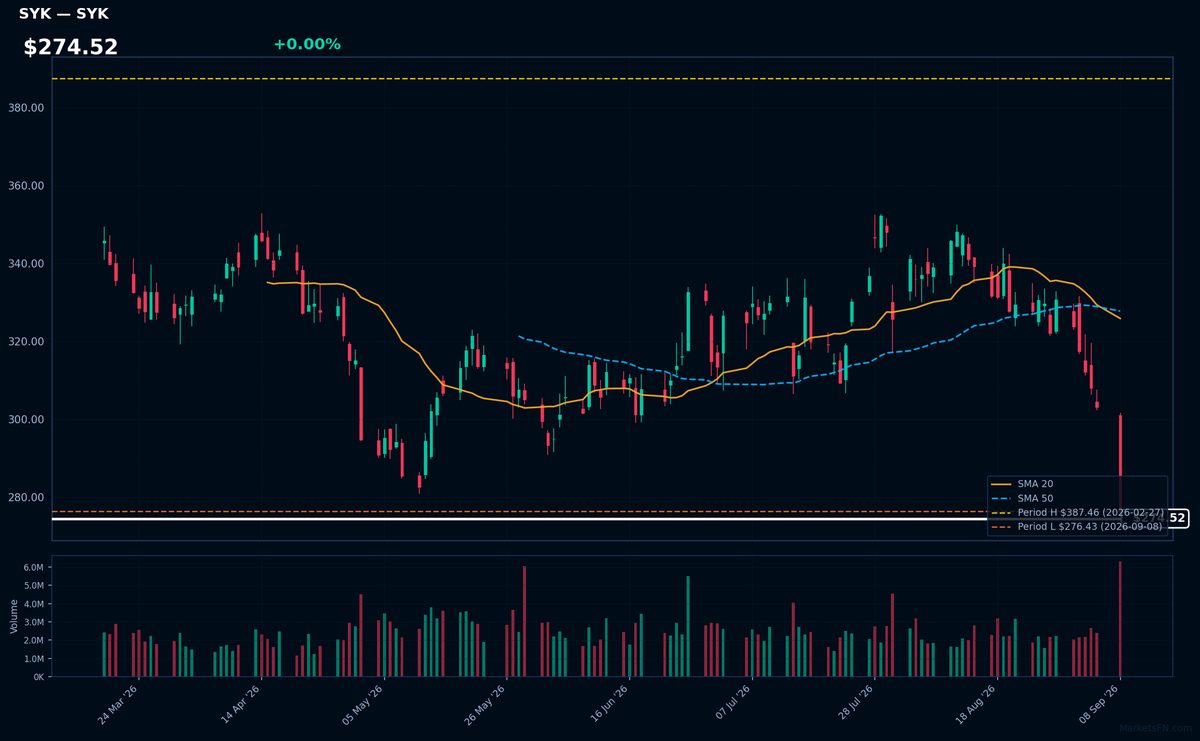
SYK | Stryker Corp | Healthcare | Price Last: $276.43 | % Realized: -20.61% | RSI: 24.2 | % above MA200: -18.1% | Trend: Below MA20, MA50, MA200
Stryker Corp is a medical technology company that designs, manufactures, and markets orthopedic implants, surgical equipment, and neurotechnology products. Investors should care about its innovation in surgical navigation and orthopedic reconstruction, driving growth in the $40+ billion global orthopedic market.
Stryker Corp's technical situation indicates a warning sign with an RSI(14) of 24.2, signaling oversold conditions, and a bearish MA alignment: price ($274.52) < MA20 < MA50 < MA200, showing a sustained downtrend, with the stock testing major support at its 2026 YTD low.
Related headlines
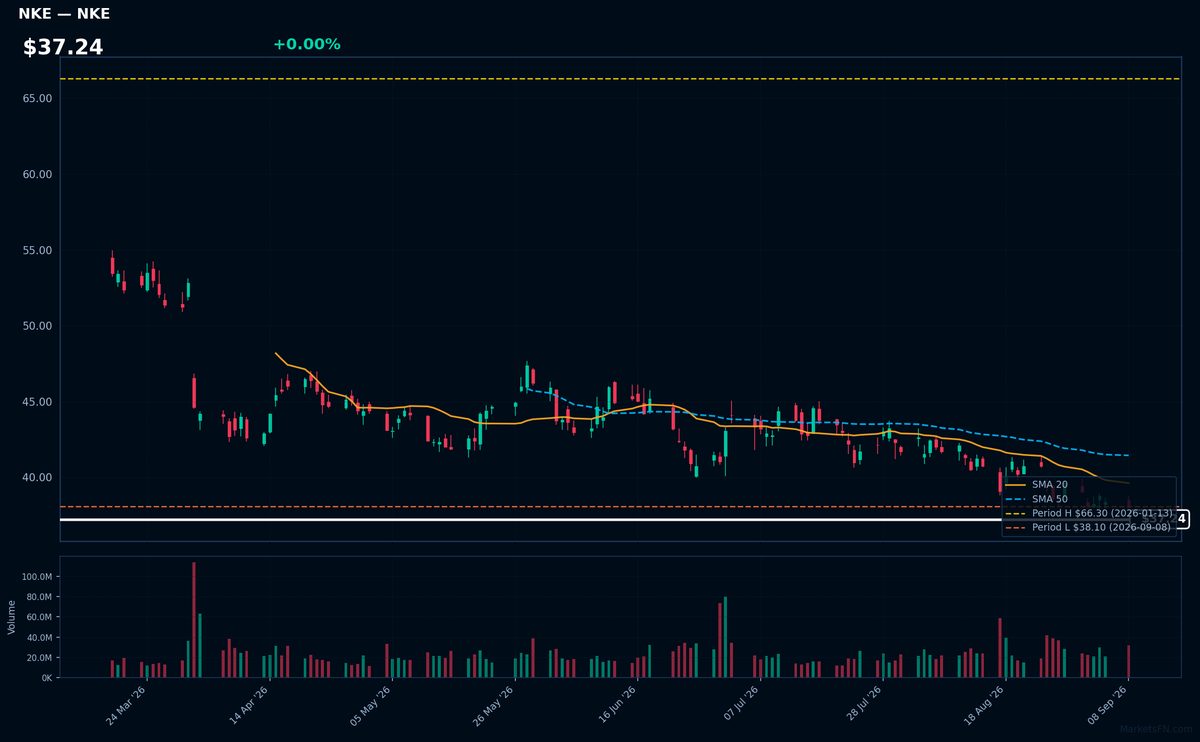
NKE | Nike, Inc | Consumer Cyclical | Price Last: $38.10 | % Realized: -39.79% | RSI: 35.2 | % above MA200: -25.5% | Trend: Below MA20, MA50, MA200
Nike, Inc designs and sells athletic footwear, apparel, and equipment. Investors should care about its brand strength, product innovation, and global distribution network, which drive revenue growth and profitability.
Nike's technicals indicate a sustained downtrend with price ($37.24) below MA20, MA50, and MA200. RSI(14) is 35.2, near oversold territory. The stock is testing major support at its 2026 YTD low, having fallen 39.8% YTD.
Related headlines
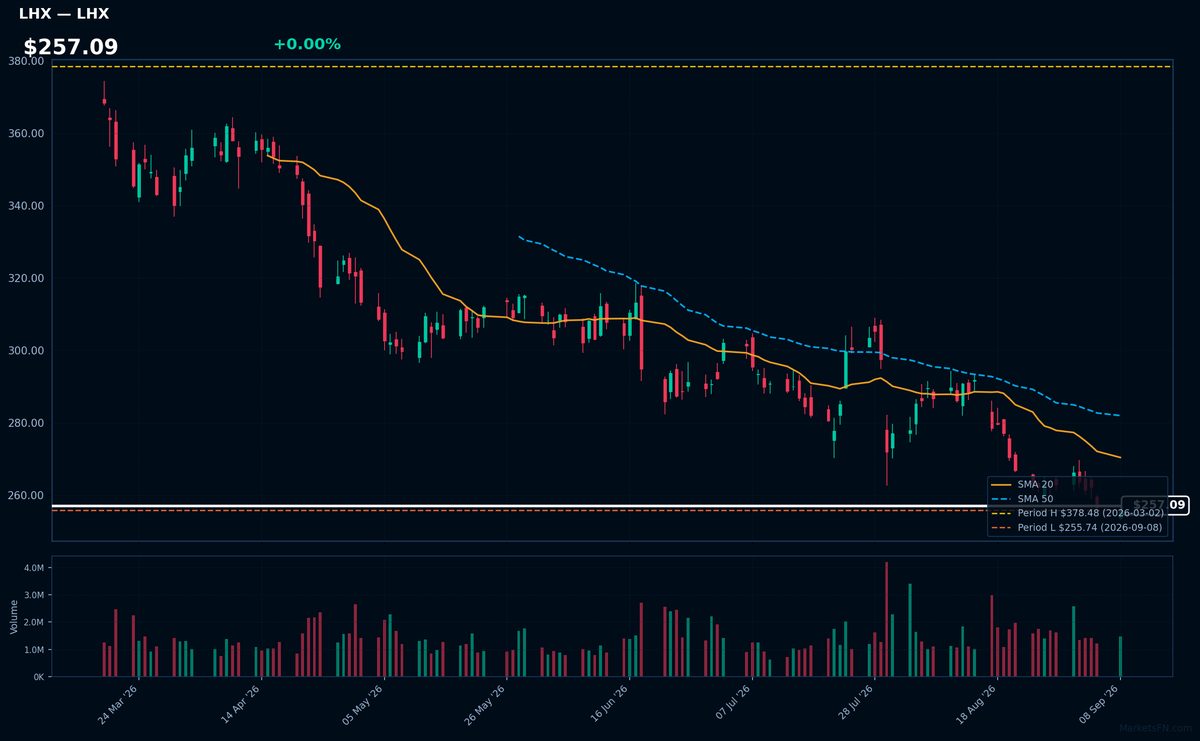
LHX | L3Harris Technologies Inc | Industrials | Price Last: $255.74 | % Realized: -16.01% | RSI: 33.3 | % above MA200: -18.5% | Trend: Below MA20, MA50, MA200
L3Harris Technologies Inc is a defense technology company providing advanced defense and commercial technologies across air, land, sea, space, and cyber domains. Investors should care due to its significant role in the defense industry and potential impact from geopolitical tensions and defense spending.
L3Harris is in a sustained downtrend with price ($257.09) below MA20, MA50, and MA200. The RSI(14) is 33.3, near oversold territory. The stock is testing major support at its 2026 YTD low, having returned -16.0% YTD, indicating a potential warning sign.
Related headlines
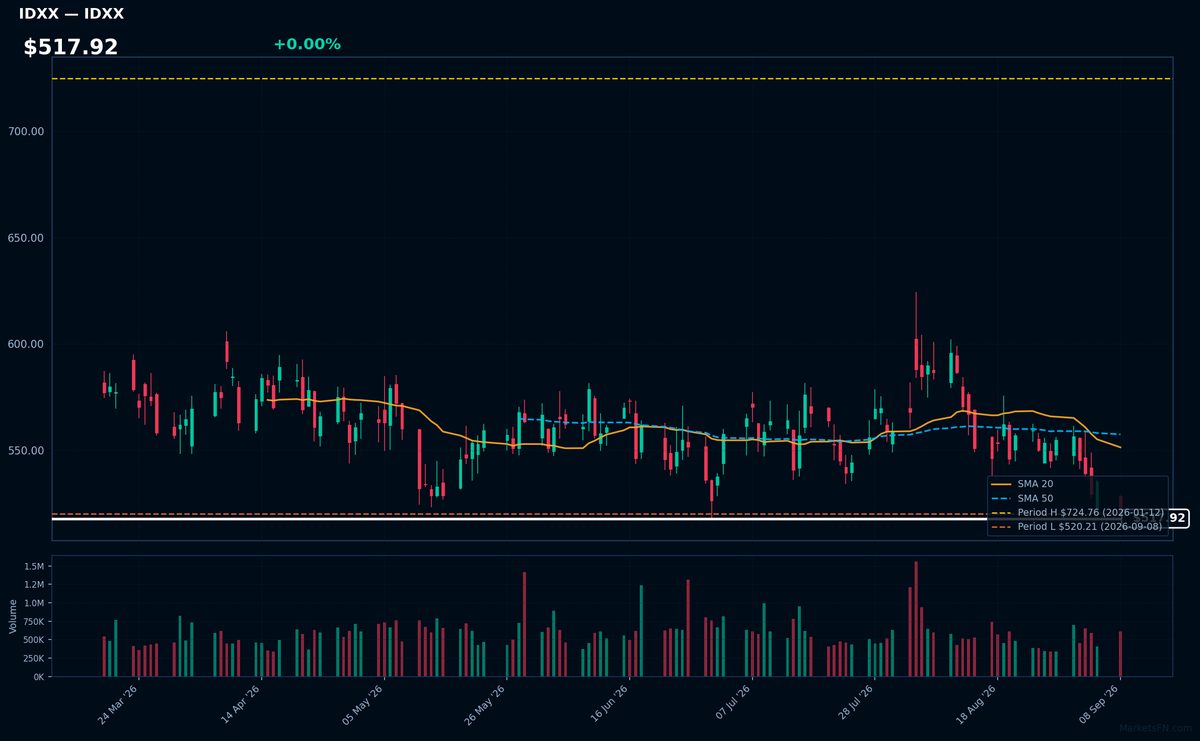
IDXX | Idexx Laboratories, Inc | Healthcare | Price Last: $520.21 | % Realized: -22.36% | RSI: 35.5 | % above MA200: -14.1% | Trend: Below MA20, MA50, MA200
Idexx Laboratories, Inc is a veterinary diagnostics and software company. Investors should care because its innovative products and services, such as companion animal diagnostic tests and veterinary practice management software, drive growth in the pet healthcare industry.
IDXX's technicals indicate a sustained downtrend with price ($517.92) below MA20, MA50, and MA200. The RSI(14) is 35.5, near oversold territory. The stock is testing major support at its 2026 YTD low, having fallen 22.4% YTD, a warning sign for investors.
Related headlines
- IDEXX Laboratories to Participate in Morgan Stanley 24th Annual Global Healthcare Conference
- IDEXX Expands Catalyst Platform into Cardiac Disease with First and Only Dual-Species Point-of-Care NT-proBNP Test
- IDEXX Laboratories, Inc. Q2 2026 Earnings Call Summary
- IDEXX Laboratories Inc (IDXX) (Q2 2026) Earnings Call Highlights: Strong Revenue Growth and ...
Market Commentary
The S&P 500 stocks listed are near their 2026 year-to-date (YTD) extremes, with some at their highs and others at their lows. Specifically, energy sector stocks such as DELL, MPC, PSX, VLO, and OKE are at their 2026 YTD highs, while stocks like TJX, SYK, NKE, LHX, and IDXX are at their 2026 YTD lows.
The stocks at their 2026 YTD highs are predominantly from the energy sector, indicating strong performance in this industry so far this year. In contrast, the stocks at their YTD lows span various sectors, including consumer discretionary (TJX, NKE), healthcare (SYK, IDXX), and industrials (LHX). This divergence may reflect differing market conditions and sector-specific themes.
Investors should monitor these stocks for signs of continued strength or weakness, particularly in the energy sector, which has driven the highs. Watching for any changes in their proximity to these extremes and understanding the underlying drivers will be crucial for making informed investment decisions.
Methodology: All 503 S&P 500 constituents screened. Close prices downloaded from 2026-01-01. Period high = highest close since Jan 1 2026; period low = lowest close since Jan 1 2026. Distance = (current price / period extreme − 1) × 100. Technical indicators computed on up to 1 year of daily OHLCV data.
Disclaimer: For informational purposes only. Not investment advice. Past performance is not indicative of future results.


