S&P 500 2026 YTD Highs & Lows Radar: Johnson & Johnson (JNJ), McDonald's (MCD) and more
MarketsFN Team

S&P 500 2026 YTD Highs & Lows Radar: Johnson & Johnson (JNJ), McDonald's (MCD) and more
Screening all 503 S&P 500 constituents for stocks nearest to their 2026 year-to-date high and their 2026 YTD low. Data as of September 04, 2026. % Realized = total return since Jan 1 2026.
Legend: RSI > 70 = overbought · RSI < 30 = oversold · Green % Realized = positive YTD return · Red = negative.
📈 Nearest to 2026 High
Sectors represented: Healthcare (4), Technology (1)
| Ticker | Company | Sector | Price Last | % Realized | 2026 YTD High Date | RSI | % above MA200 | Trend |
|---|---|---|---|---|---|---|---|---|
| JNJ | Johnson & Johnson | Healthcare | $278.43 | +34.28% | 2026-09-03 | 63.6 | +18.1% | Above MA20, MA50, MA200 |
| AMGN | AMGEN Inc | Healthcare | $444.12 | +35.55% | 2026-09-03 | 63.4 | +23.9% | Above MA20, MA50, MA200 |
| VRTX | Vertex Pharmaceuticals, Inc | Healthcare | $557.96 | +23.41% | 2026-09-03 | 63.4 | +19.7% | Above MA20, MA50, MA200 |
| BMY | Bristol-Myers Squibb Co | Healthcare | $68.09 | +27.37% | 2026-09-03 | 60.0 | +17.1% | Above MA20, MA50, MA200 |
| DELL | Dell Technologies Inc | Technology | $516.39 | +304.06% | 2026-09-03 | 63.1 | +103.8% | Above MA20, MA50, MA200 |
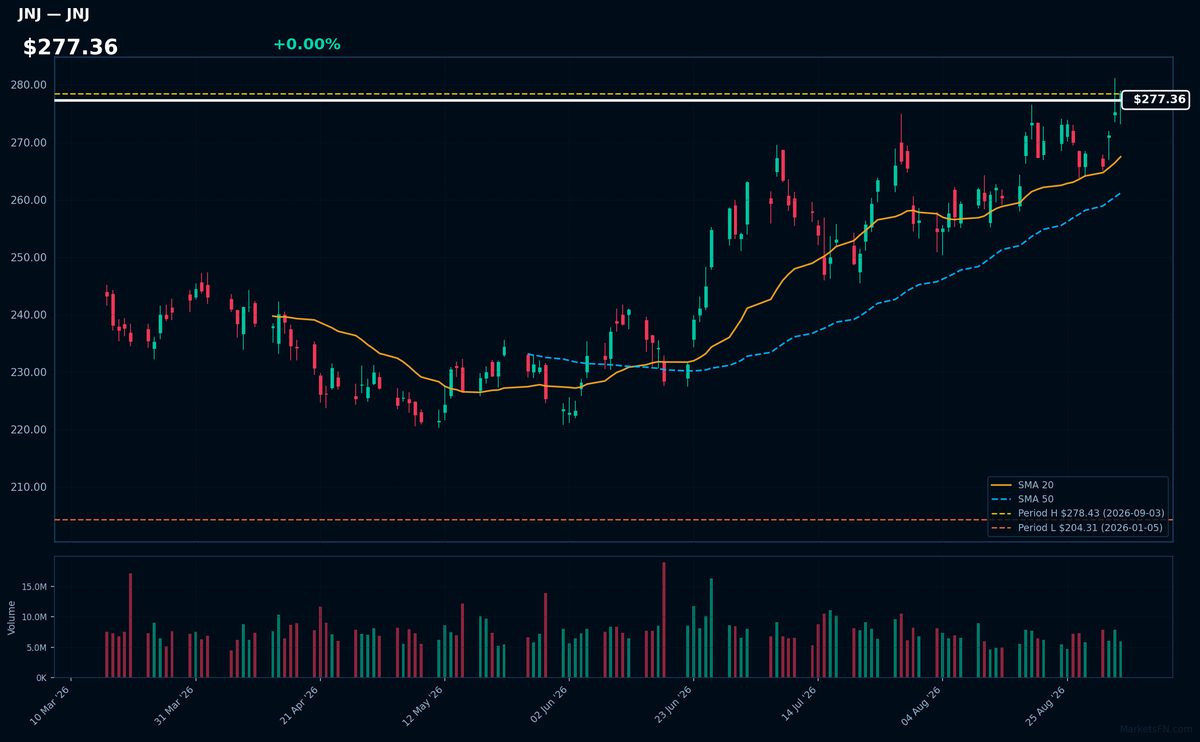
JNJ | Johnson & Johnson | Healthcare | Price Last: $278.43 | % Realized: +34.28% | RSI: 63.6 | % above MA200: +18.1% | Trend: Above MA20, MA50, MA200
Johnson & Johnson is a diversified healthcare company with significant pharmaceutical, medical devices, and consumer products segments. Investors should care about its broad portfolio and innovation pipeline, particularly in areas like oncology and immunology.
JNJ's technicals indicate sustained uptrend with price at $277.36, RSI(14) at 63.6, and bullish MA alignment (price > MA20 > MA50 > MA200). It's near its 2026 YTD high, up 34.3% YTD, suggesting momentum.
Related headlines
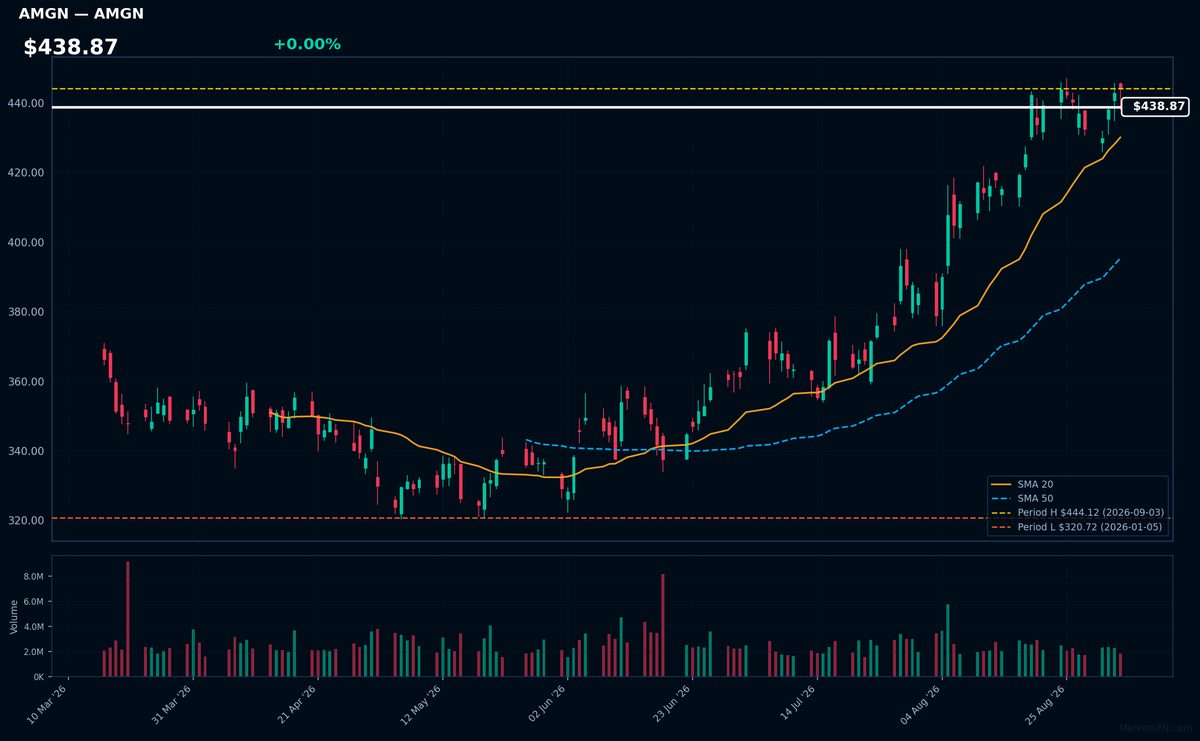
AMGN | AMGEN Inc | Healthcare | Price Last: $444.12 | % Realized: +35.55% | RSI: 63.4 | % above MA200: +23.9% | Trend: Above MA20, MA50, MA200
AMGEN Inc is a biotechnology company that develops and markets human therapeutics, focusing on serious illnesses such as cancer, cardiovascular disease, and osteoporosis. Investors should care about its innovative treatments and potential market leadership in therapeutic areas.
AMGEN Inc shows bullish technicals with RSI(14) at 63.4, indicating rising momentum. The MA alignment is bullish as price ($438.87) > MA20 > MA50 > MA200, and it's 0.0% below its 2026 YTD high, suggesting a potential breakout.
Related headlines
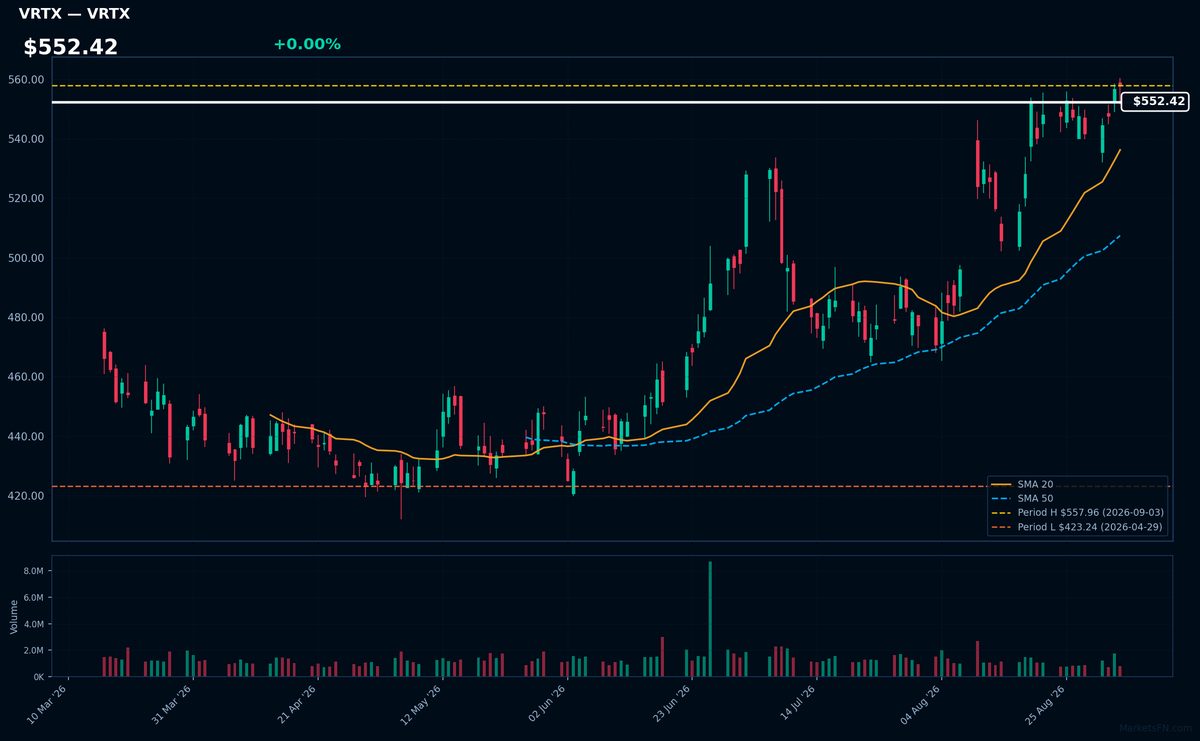
VRTX | Vertex Pharmaceuticals, Inc | Healthcare | Price Last: $557.96 | % Realized: +23.41% | RSI: 63.4 | % above MA200: +19.7% | Trend: Above MA20, MA50, MA200
Vertex Pharmaceuticals, Inc is a biotechnology company that develops and commercializes treatments for cystic fibrosis and other serious diseases. Investors should care because its cystic fibrosis treatments, such as Trikafta, have shown significant market success and revenue growth.
The stock exhibits bullish technicals with RSI(14) at 63.4, indicating rising momentum. The MA alignment is bullish (price > MA20 > MA50 > MA200), and the stock is 0.0% below its 2026 YTD high, suggesting potential for further breakout.
Related headlines
- Vertex Completes $10 Billion Crinetics Acquisition, Adding Rare Endocrine Growth Platform
- Vertex Completes Acquisition of Crinetics Pharmaceuticals and Announces Expansion of Executive Leadership Team
- Vertex to Participate in Upcoming September Investor Conferences
- Vertex Stock Jumps 5.9% as Rival Cystic Fibrosis Drug Fails
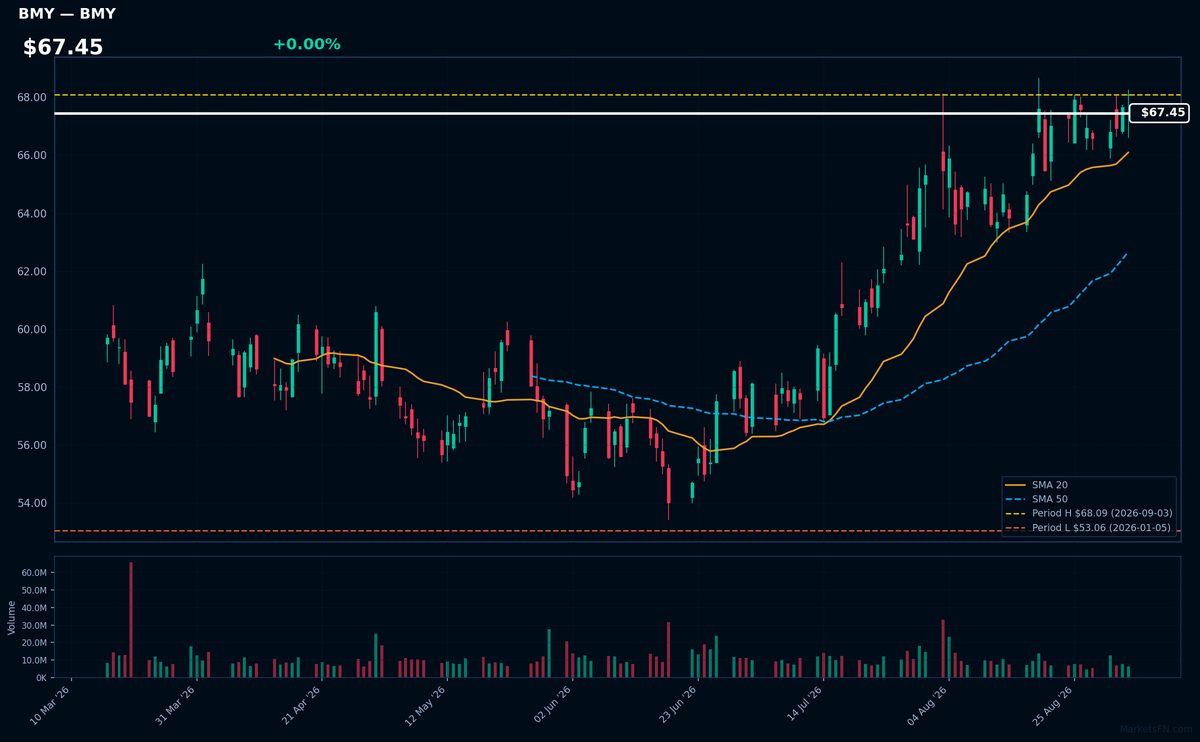
BMY | Bristol-Myers Squibb Co | Healthcare | Price Last: $68.09 | % Realized: +27.37% | RSI: 60.0 | % above MA200: +17.1% | Trend: Above MA20, MA50, MA200
Bristol-Myers Squibb Co is a biopharmaceutical company that develops and markets drugs for various therapeutic areas, including oncology and immunology. Investors should care about its pipeline and approvals, such as its checkpoint inhibitors and CAR-T therapies, which drive revenue growth.
The stock exhibits bullish technicals with RSI(14) at 60.0 and a sustained uptrend as price > MA20 > MA50 > MA200. It's near its 2026 YTD high, 0.0% below, indicating potential breakout level, with 27.4% 2026 YTD return, signaling momentum.
Related headlines
- Why Did AMZN, SNOW, BMY Stocks Surge To 52-Week Highs Today?
- MRNA, LNTH, BMY, CAPR, RARE Stocks In Focus These FDA Decisions Could Shape August Trading
- Bristol-Myers Squibb and AstraZeneca said to discuss megamerger - can it happen?
- AstraZeneca tie-up talks with Bristol-Myers Squibb are moving stocks. Analysts are puzzled.
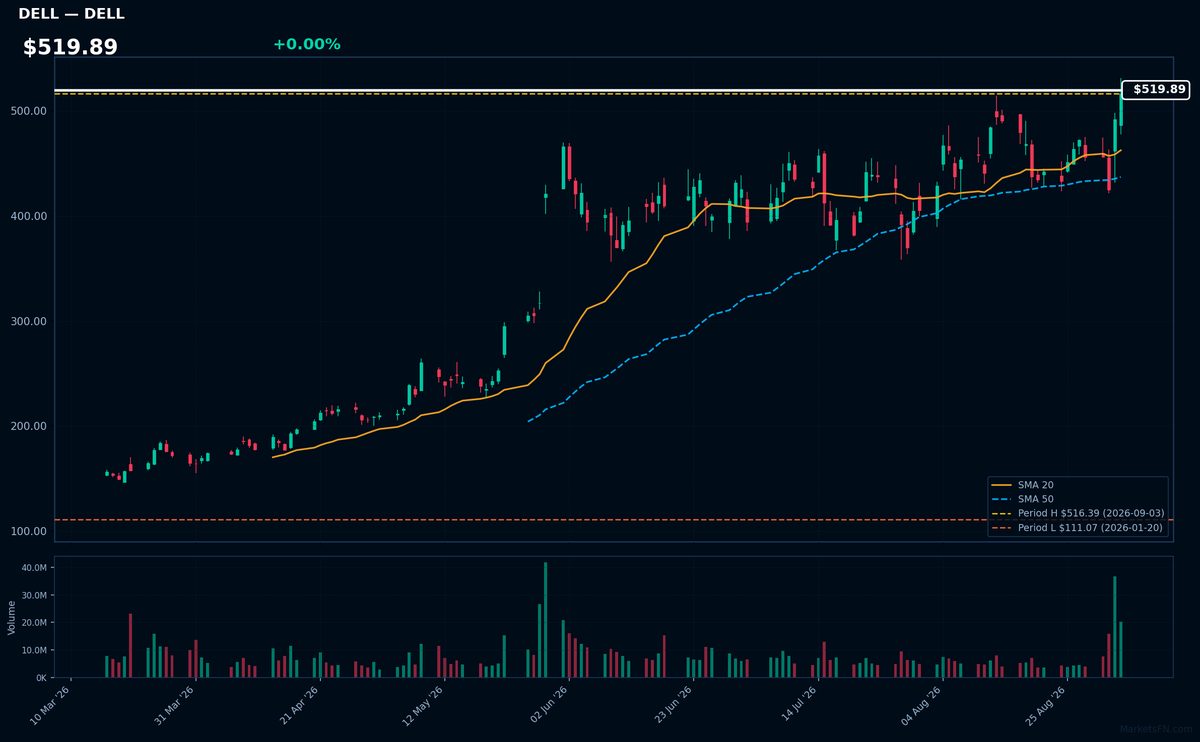
DELL | Dell Technologies Inc | Technology | Price Last: $516.39 | % Realized: +304.06% | RSI: 63.1 | % above MA200: +103.8% | Trend: Above MA20, MA50, MA200
Dell Technologies Inc is a technology company that provides a range of products and services, but specific details about its business operations are not provided in the data; investors should care based on its technical performance.
Dell's current technical situation indicates strong momentum: RSI(14) is 63.1, with a bullish MA alignment (price > MA20 > MA50 > MA200) and a 304.1% 2026 YTD return, near its YTD high.
Related headlines
📉 Nearest to 2026 Low
Sectors represented: Consumer Cyclical (2), Consumer Defensive (2), Real Estate (1)
| Ticker | Company | Sector | Price Last | % Realized | 2026 YTD Low Date | RSI | % above MA200 | Trend |
|---|---|---|---|---|---|---|---|---|
| MCD | McDonald's Corp | Consumer Cyclical | $259.63 | -14.39% | 2026-09-03 | 35.6 | -12.3% | Below MA20, MA50, MA200 |
| ROL | Rollins, Inc | Consumer Cyclical | $35.71 | -39.48% | 2026-09-02 | 33.5 | -31.7% | Below MA20, MA50, MA200 |
| STZ | Constellation Brands Inc | Consumer Defensive | $129.09 | -8.56% | 2026-09-03 | 40.6 | -11.1% | Below MA20, MA50, MA200 |
| EQR | Equity Residential Properties Trust | Real Estate | $63.66 | -7.74% | 2026-08-17 | 21.2 | — | — |
| TSN | Tyson Foods, Inc | Consumer Defensive | $51.76 | -10.82% | 2026-09-03 | 26.4 | -14.4% | Below MA20, MA50, MA200 |
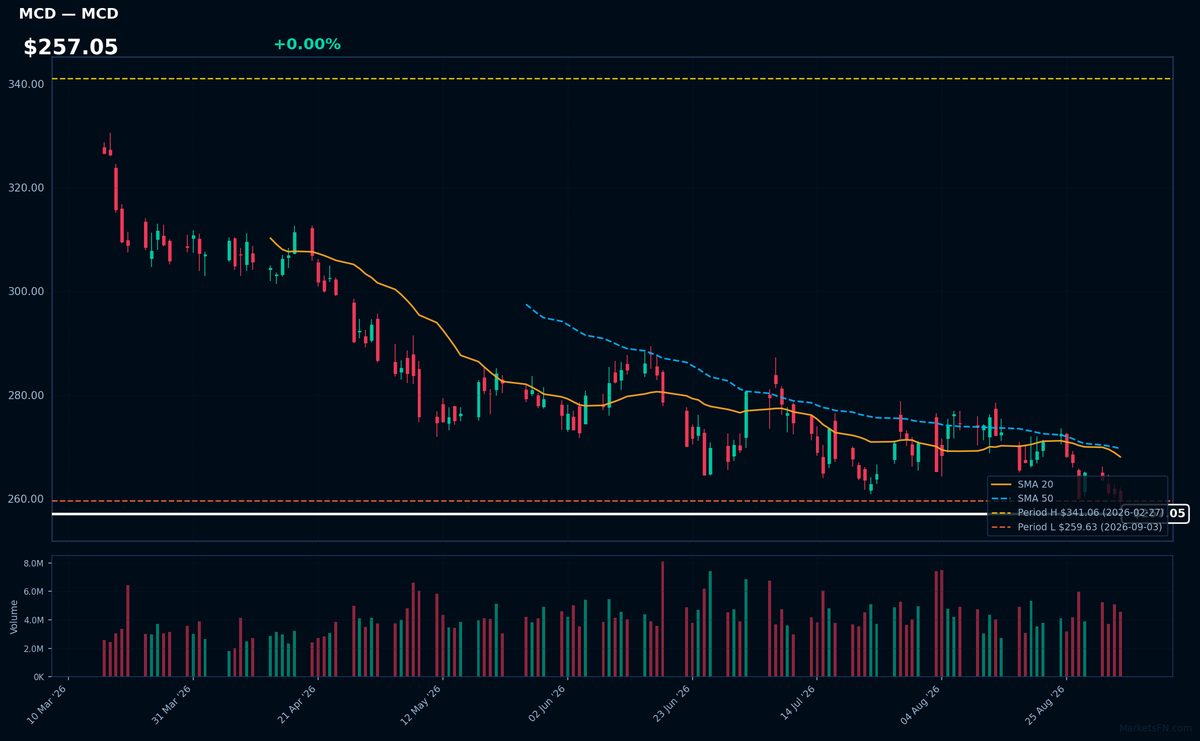
MCD | McDonald's Corp | Consumer Cyclical | Price Last: $259.63 | % Realized: -14.39% | RSI: 35.6 | % above MA200: -12.3% | Trend: Below MA20, MA50, MA200
McDonald's Corp operates and franchises quick-service restaurants, serving burgers, fries, and beverages globally. Investors should care about its same-store sales growth, margin expansion, and franchise model execution, which drive revenue and profitability.
McDonald's Corp is in a sustained downtrend with price ($257.05) below MA20, MA50, and MA200. RSI(14) is 35.6, near oversold territory. The stock is testing major support at its 2026 YTD low, down 14.4% YTD, indicating potential further downside risk.
Related headlines
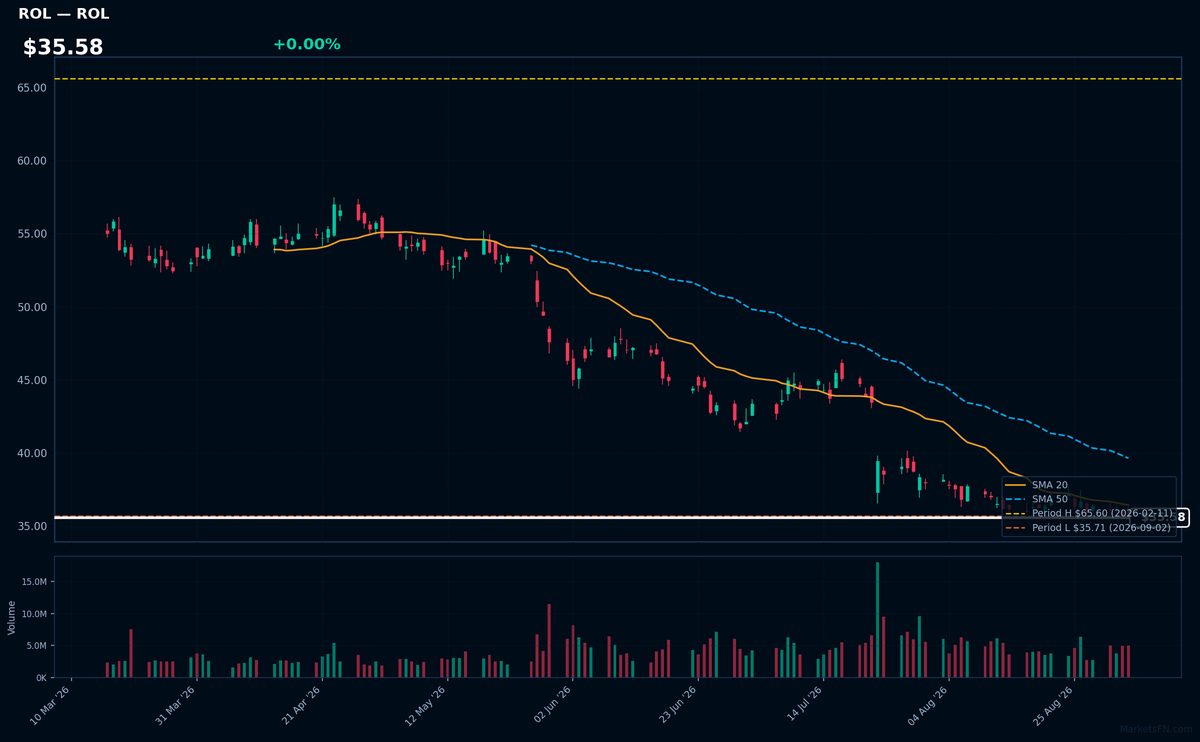
ROL | Rollins, Inc | Consumer Cyclical | Price Last: $35.71 | % Realized: -39.48% | RSI: 33.5 | % above MA200: -31.7% | Trend: Below MA20, MA50, MA200
Rollins, Inc provides pest control services through its Orkin, Terminix, and other brands, generating revenue through recurring service contracts and one-time treatments; investors should care about its steady cash flows and market share in a relatively stable industry.
Rollins, Inc is testing major support at its 2026 YTD low with an RSI(14) of 33.5, indicating oversold conditions, and a bearish MA alignment (price < MA20 < MA50 < MA200), suggesting a sustained downtrend; the -39.5% 2026 YTD return reinforces this warning sign.
Related headlines
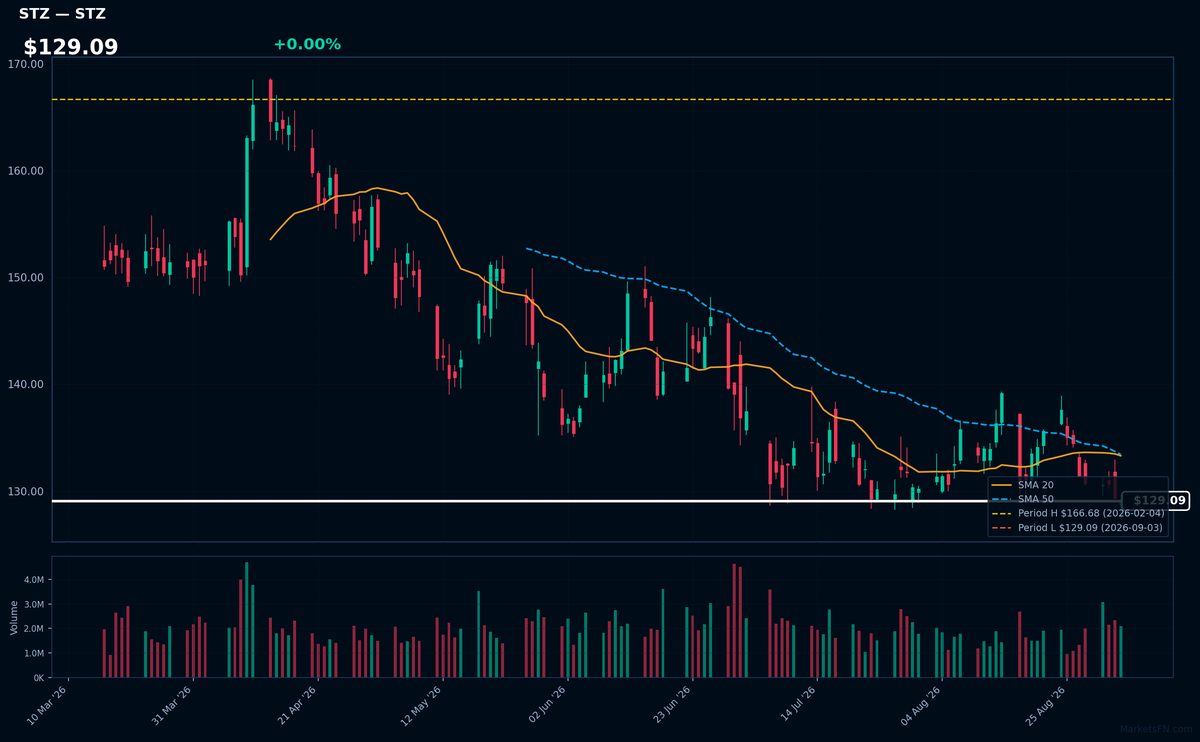
STZ | Constellation Brands Inc | Consumer Defensive | Price Last: $129.09 | % Realized: -8.56% | RSI: 40.6 | % above MA200: -11.1% | Trend: Below MA20, MA50, MA200
Constellation Brands Inc is a leading beverage alcohol company owning prominent beer brands like Corona and Modelo, and wine brands such as Robert Mondavi and Kim Crawford, making it a significant player in the global alcoholic beverages market.
The stock is in a sustained downtrend with price ($129.09) below MA20, MA50, and MA200. RSI(14) is 40.6, nearing oversold territory, and is 0.0% above its 2026 YTD low, indicating a potential support test, a warning sign for investors.
Related headlines
- Beer giant Constellation Brands invests $100M in US farm profitability
- Constellation Brands to Present at the 2026 Barclays Global Consumer Conference on September 8, 2026
- Constellation Brands Announces $100 Million Investment to Support U.S. Farmers
- Constellation Brands Inc. Cl A stock underperforms Monday when compared to competitors
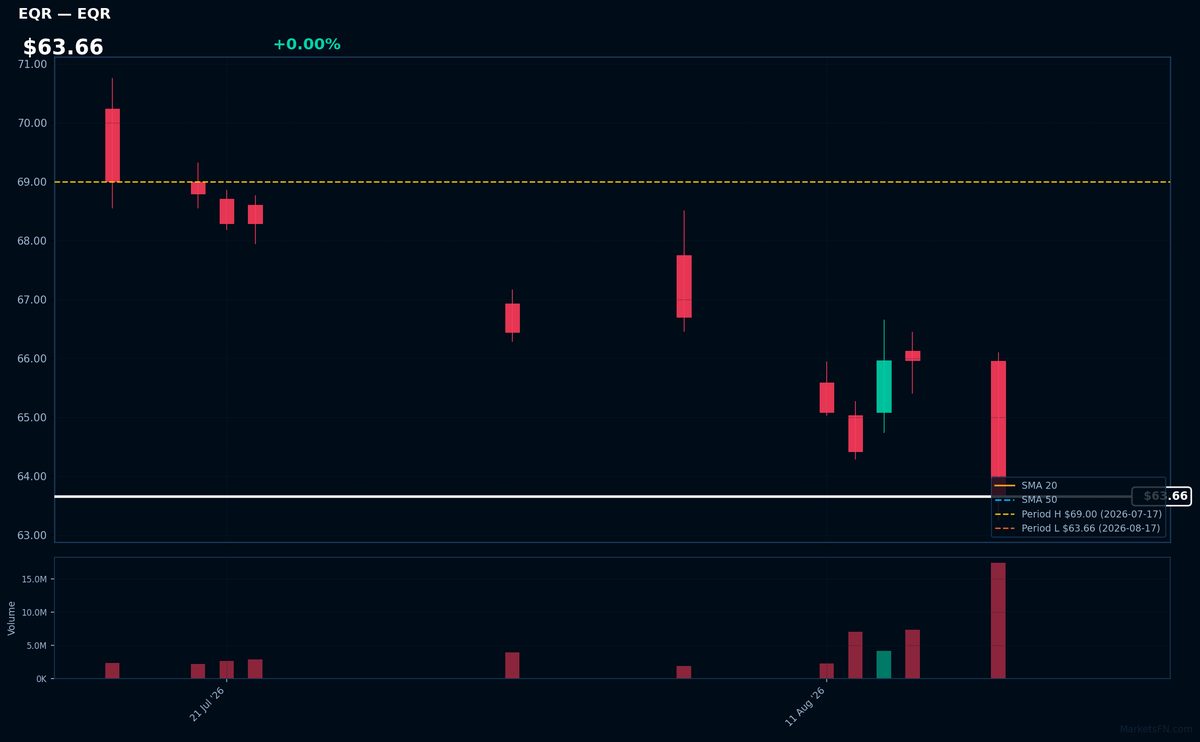
EQR | Equity Residential Properties Trust | Real Estate | Price Last: $63.66 | % Realized: -7.74% | RSI: 21.2 | % above MA200: — | Trend: —
Equity Residential Properties Trust is a real estate investment trust that owns and operates apartment properties. Investors should care because its performance reflects demand for rental housing and the overall health of the residential real estate market.
The stock's RSI(14) is 21.2, indicating oversold conditions, and is 0.0% above its 2026 YTD low, testing major support. The 2026 YTD return is -7.7%. This is a warning sign, as the stock is at a critical support level.
Related headlines
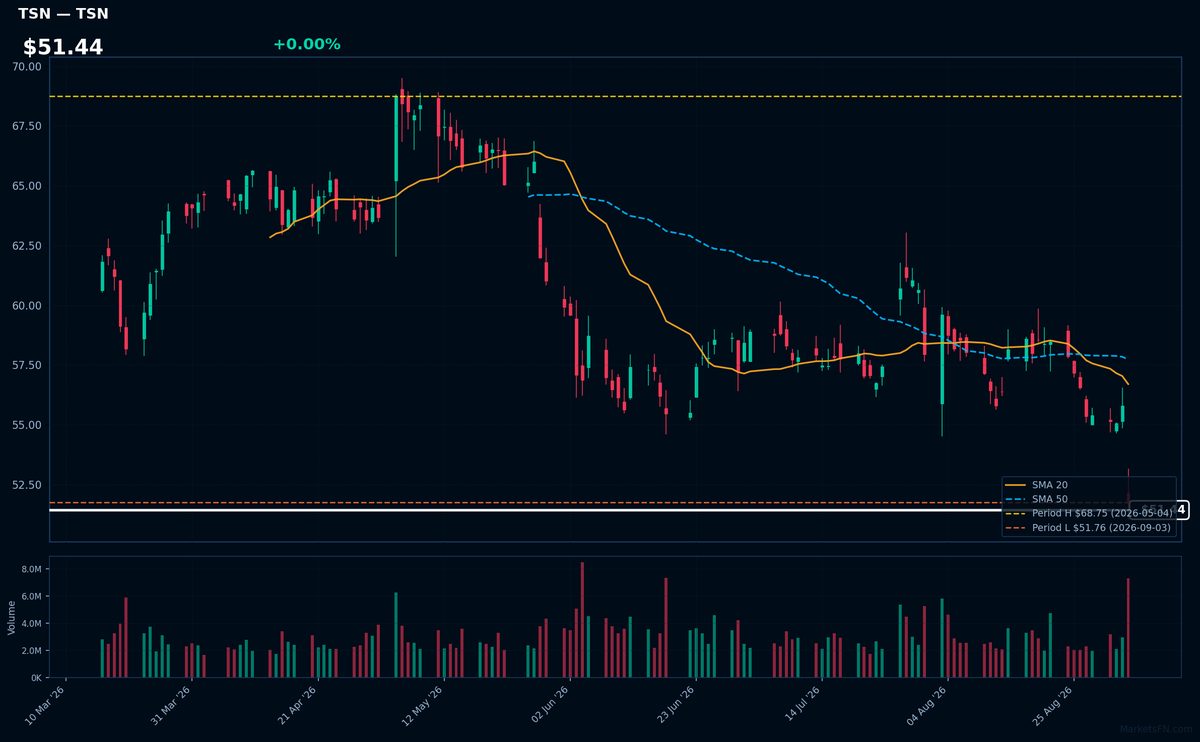
TSN | Tyson Foods, Inc | Consumer Defensive | Price Last: $51.76 | % Realized: -10.82% | RSI: 26.4 | % above MA200: -14.4% | Trend: Below MA20, MA50, MA200
Tyson Foods, Inc is a protein producer with diversified operations in chicken, beef, and pork. Investors should care about its performance as it reflects broader trends in the protein market and consumer demand.
Tyson Foods' current technical situation is bearish, with RSI(14) at 26.4 indicating oversold conditions, and a sustained downtrend as price ($51.44) remains below MA20, MA50, and MA200, testing major support at its 2026 YTD low.
Related headlines
Market Commentary
The S&P 500 stocks listed are currently trading at or very near their year-to-date (YTD) extremes for 2026. For stocks near their 2026 highs, such as JNJ, AMGN, VRTX, BMY, and DELL, this indicates that they have reached their highest price levels since the start of 2026 and have not retreated. Conversely, stocks like MCD, ROL, STZ, EQR, and TSN are at their 2026 lows, having not moved beyond their lowest YTD prices.
The stocks near their 2026 highs are a mix of pharmaceutical and technology companies, potentially indicating strong performance in these sectors. The stocks at their 2026 lows span consumer staples, real estate, and consumer discretionary, which may suggest challenges in these areas. Market conditions and sector themes driving these extremes could be related to earnings performance, industry trends, and
Methodology: All 503 S&P 500 constituents screened. Close prices downloaded from 2026-01-01. Period high = highest close since Jan 1 2026; period low = lowest close since Jan 1 2026. Distance = (current price / period extreme − 1) × 100. Technical indicators computed on up to 1 year of daily OHLCV data.
Disclaimer: For informational purposes only. Not investment advice. Past performance is not indicative of future results.