S&P 500 2026 YTD Highs & Lows Radar: JPMorgan Chase & (JPM), American Tower (AMT) and more
MarketsFN Team

S&P 500 2026 YTD Highs & Lows Radar: JPMorgan Chase & (JPM), American Tower (AMT) and more
Screening all 503 S&P 500 constituents for stocks nearest to their 2026 year-to-date high and their 2026 YTD low. Data as of July 07, 2026. % Realized = total return since Jan 1 2026.
Legend: RSI > 70 = overbought · RSI < 30 = oversold · Green % Realized = positive YTD return · Red = negative.
📈 Nearest to 2026 High
Sectors represented: Financial (2), Industrials (2), Technology (1)
| Ticker | Company | Sector | Price Last | % Realized | 2026 YTD High Date | RSI | % above MA200 | Trend |
|---|---|---|---|---|---|---|---|---|
| JPM | JPMorgan Chase & Co | Financial | $337.72 | +3.76% | 2026-07-06 | 67.4 | +9.4% | Above MA20, MA50, MA200 |
| BAC | Bank Of America Corp | Financial | $59.90 | +7.06% | 2026-07-06 | 76.1 | +13.7% | Above MA20, MA50, MA200 |
| GE | GE Aerospace | Industrials | $378.68 | +18.06% | 2026-07-06 | 68.2 | +22.1% | Above MA20, MA50, MA200 |
| UNP | Union Pacific Corp | Industrials | $282.59 | +21.85% | 2026-07-06 | 67.4 | +15.3% | Above MA20, MA50, MA200 |
| PANW | Palo Alto Networks Inc | Technology | $357.53 | +99.33% | 2026-07-06 | 75.9 | +76.1% | Above MA20, MA50, MA200 |
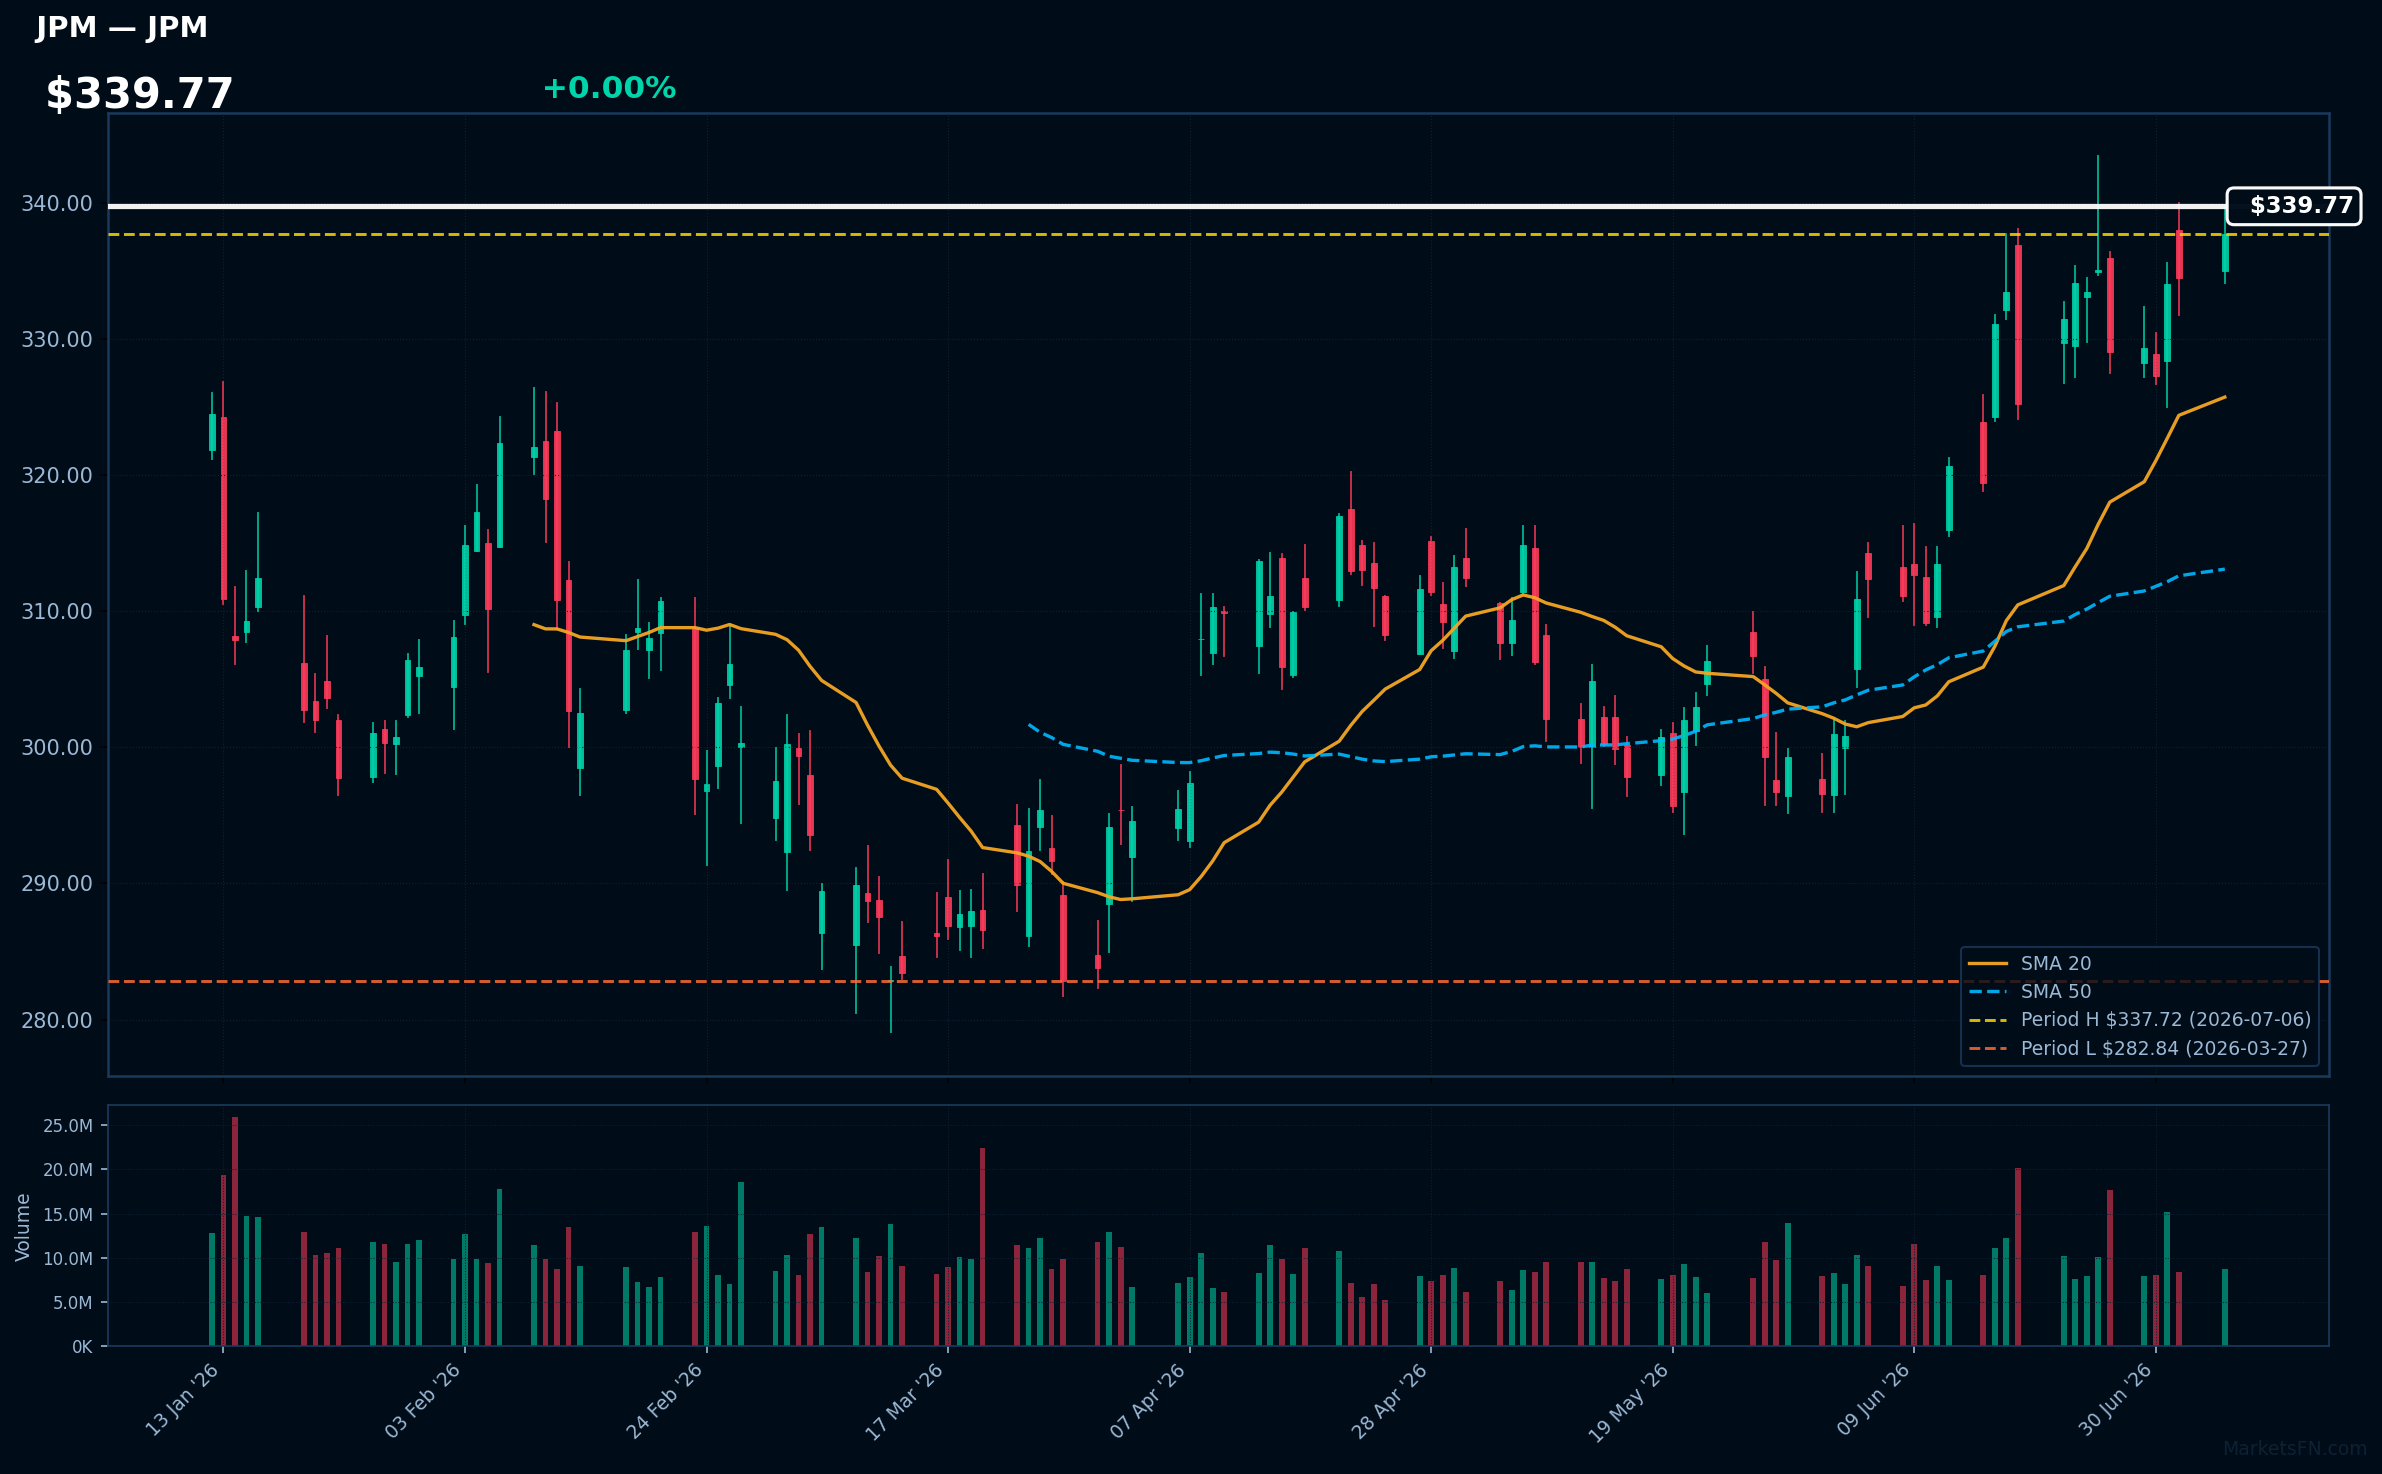
JPM | JPMorgan Chase & Co | Financial | Price Last: $337.72 | % Realized: +3.76% | RSI: 67.4 | % above MA200: +9.4% | Trend: Above MA20, MA50, MA200
JPMorgan Chase & Co is a global financial services firm providing consumer and investment banking, financial transactions processing, asset management, and private banking. Investors care due to its systemic importance and exposure to global economic trends.
JPMorgan Chase & Co is in a sustained uptrend with price at $339.77, above MA20, MA50, and MA200. RSI(14) is 67.4, near its 2026 YTD high. This indicates strong momentum with no immediate signs of reversal, as it's 0.0% below the YTD high.
Related headlines
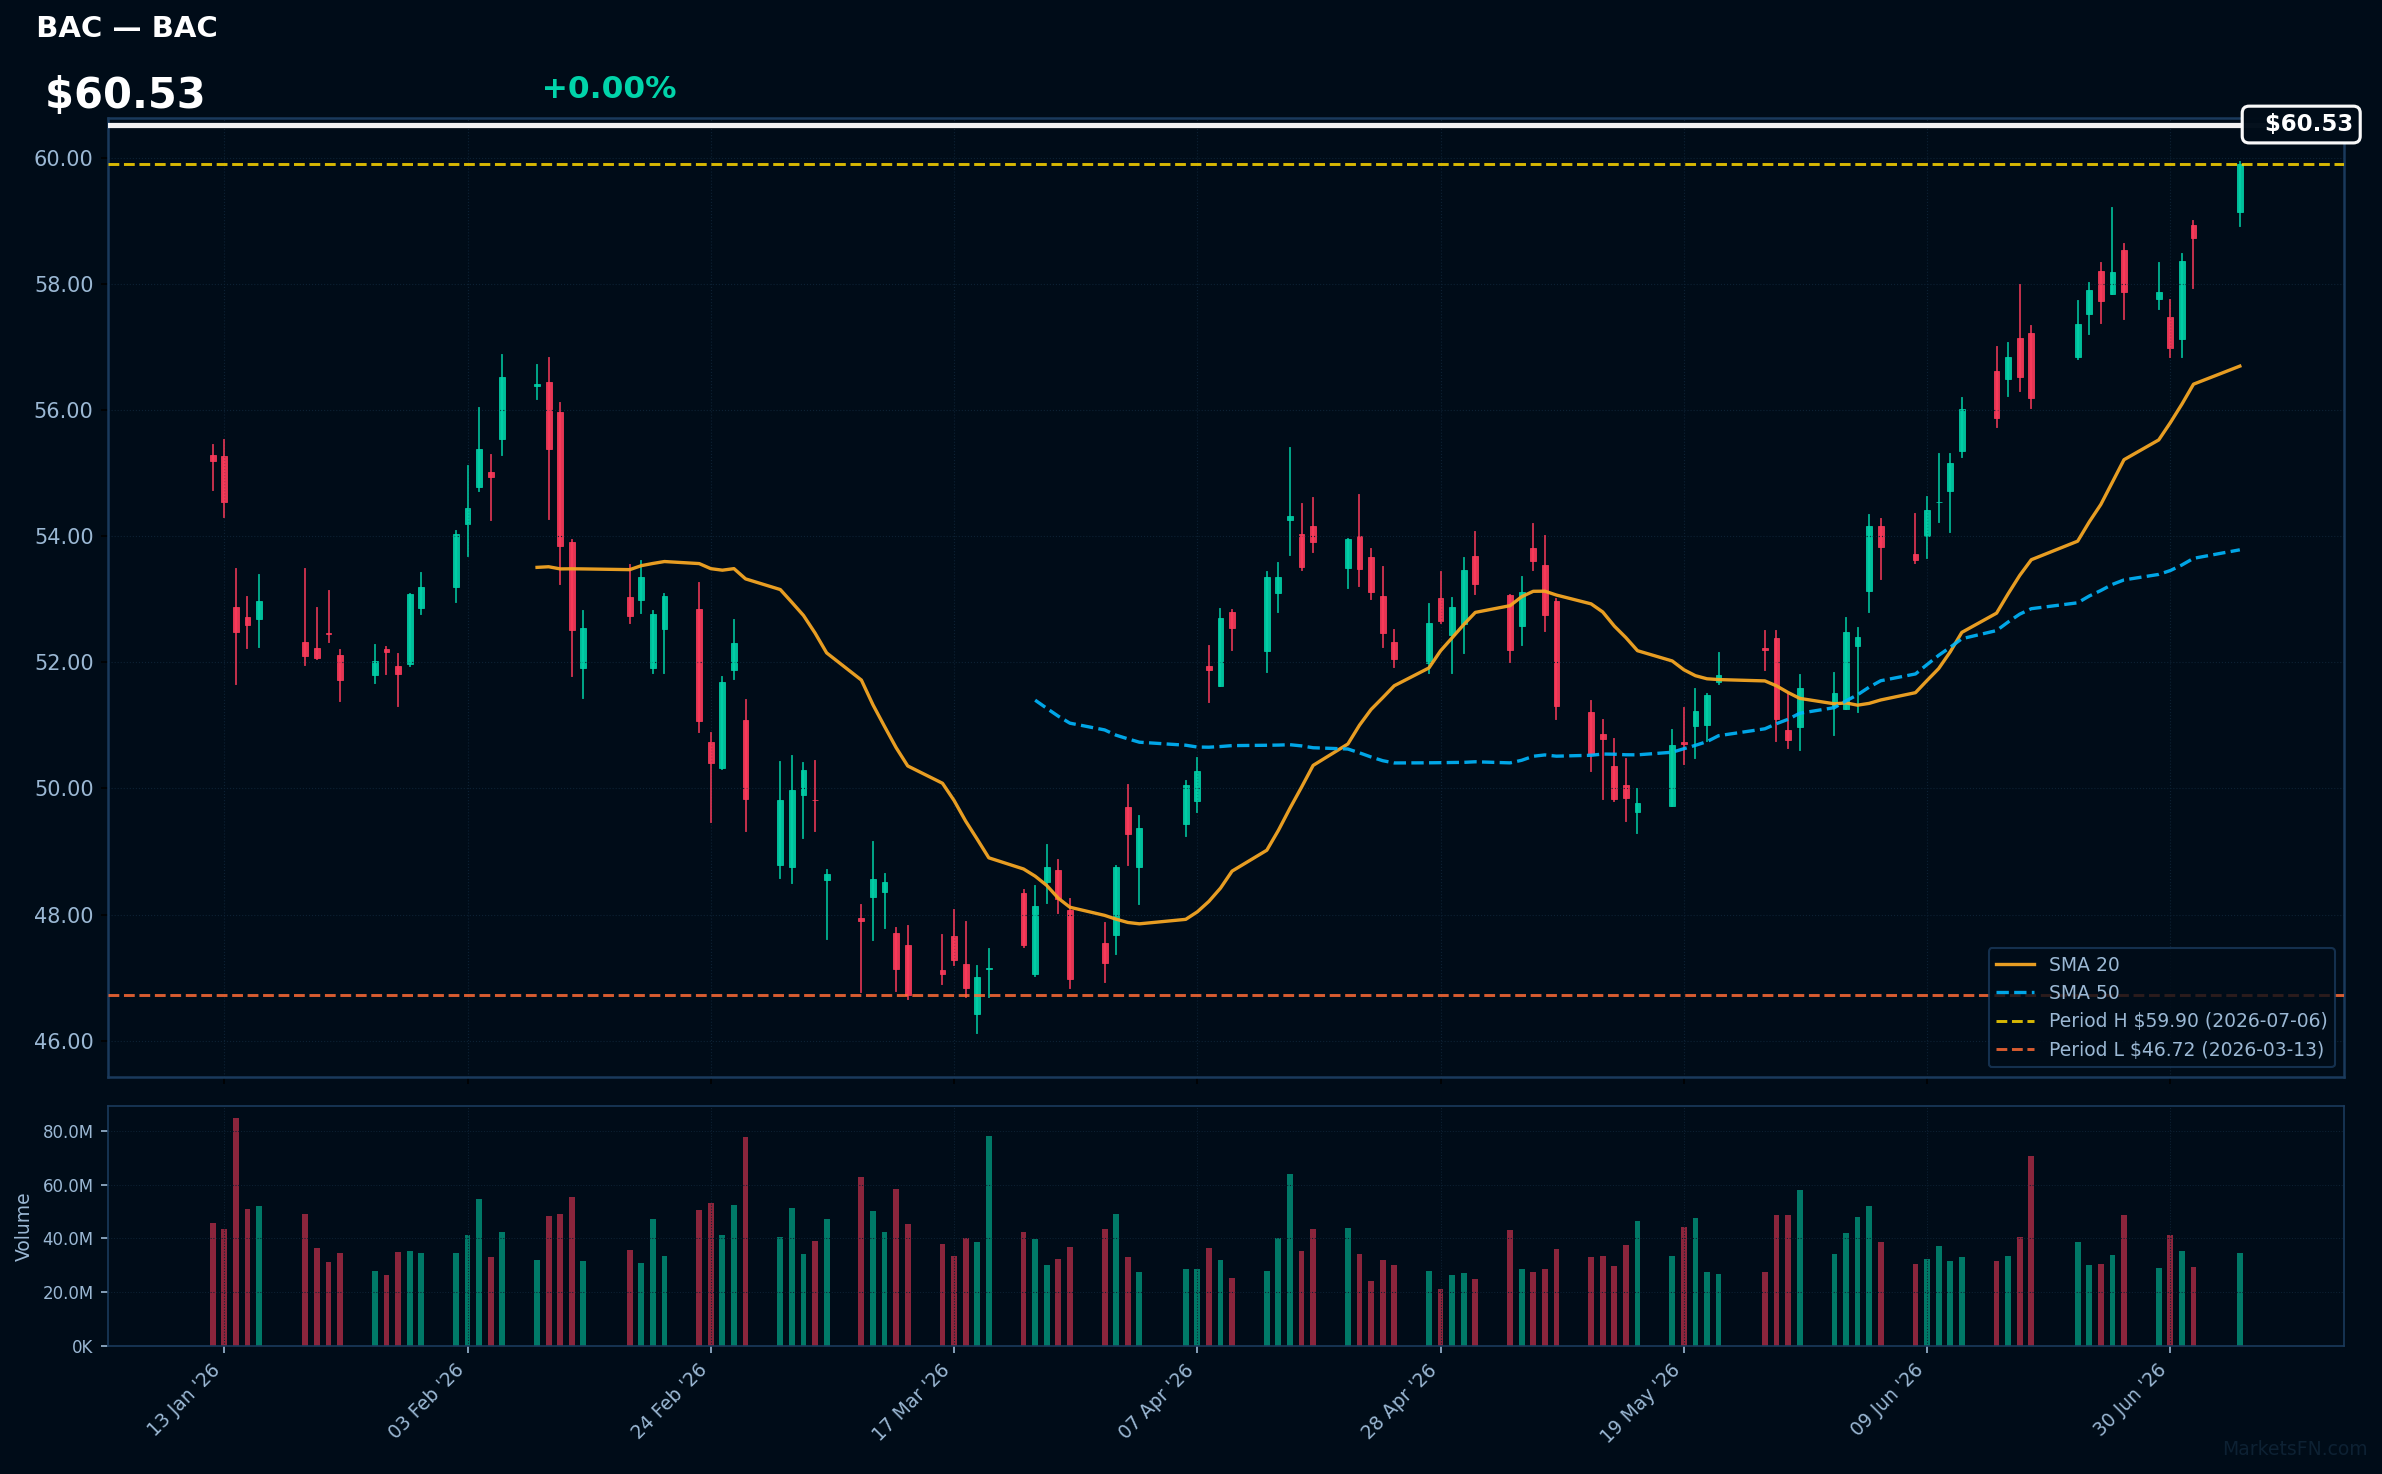
BAC | Bank Of America Corp | Financial | Price Last: $59.90 | % Realized: +7.06% | RSI: 76.1 | % above MA200: +13.7% | Trend: Above MA20, MA50, MA200
Bank Of America Corp is a multinational banking and financial services corporation. Investors should care about its performance as it is a significant player in the US banking sector, influencing overall market sentiment and economic indicators.
The stock is in a sustained uptrend with price > MA20 > MA50 > MA200. RSI(14) is 76.1, nearing overbought territory. It's 0.0% below its 2026 YTD high, indicating potential breakout momentum.
Related headlines
- Fiserv Stock Jumps on Report Big U.S. Banks Explore Buying Its Debit Card Network
- Fiserv discusses potential sale of debit payments network with major US banks (FISV)
- Intel-Backed AI Chip and Software Maker Syntiant Files for IPO
- Bank of America Gives Astera Labs Stock a Stunning Street-High Price Target
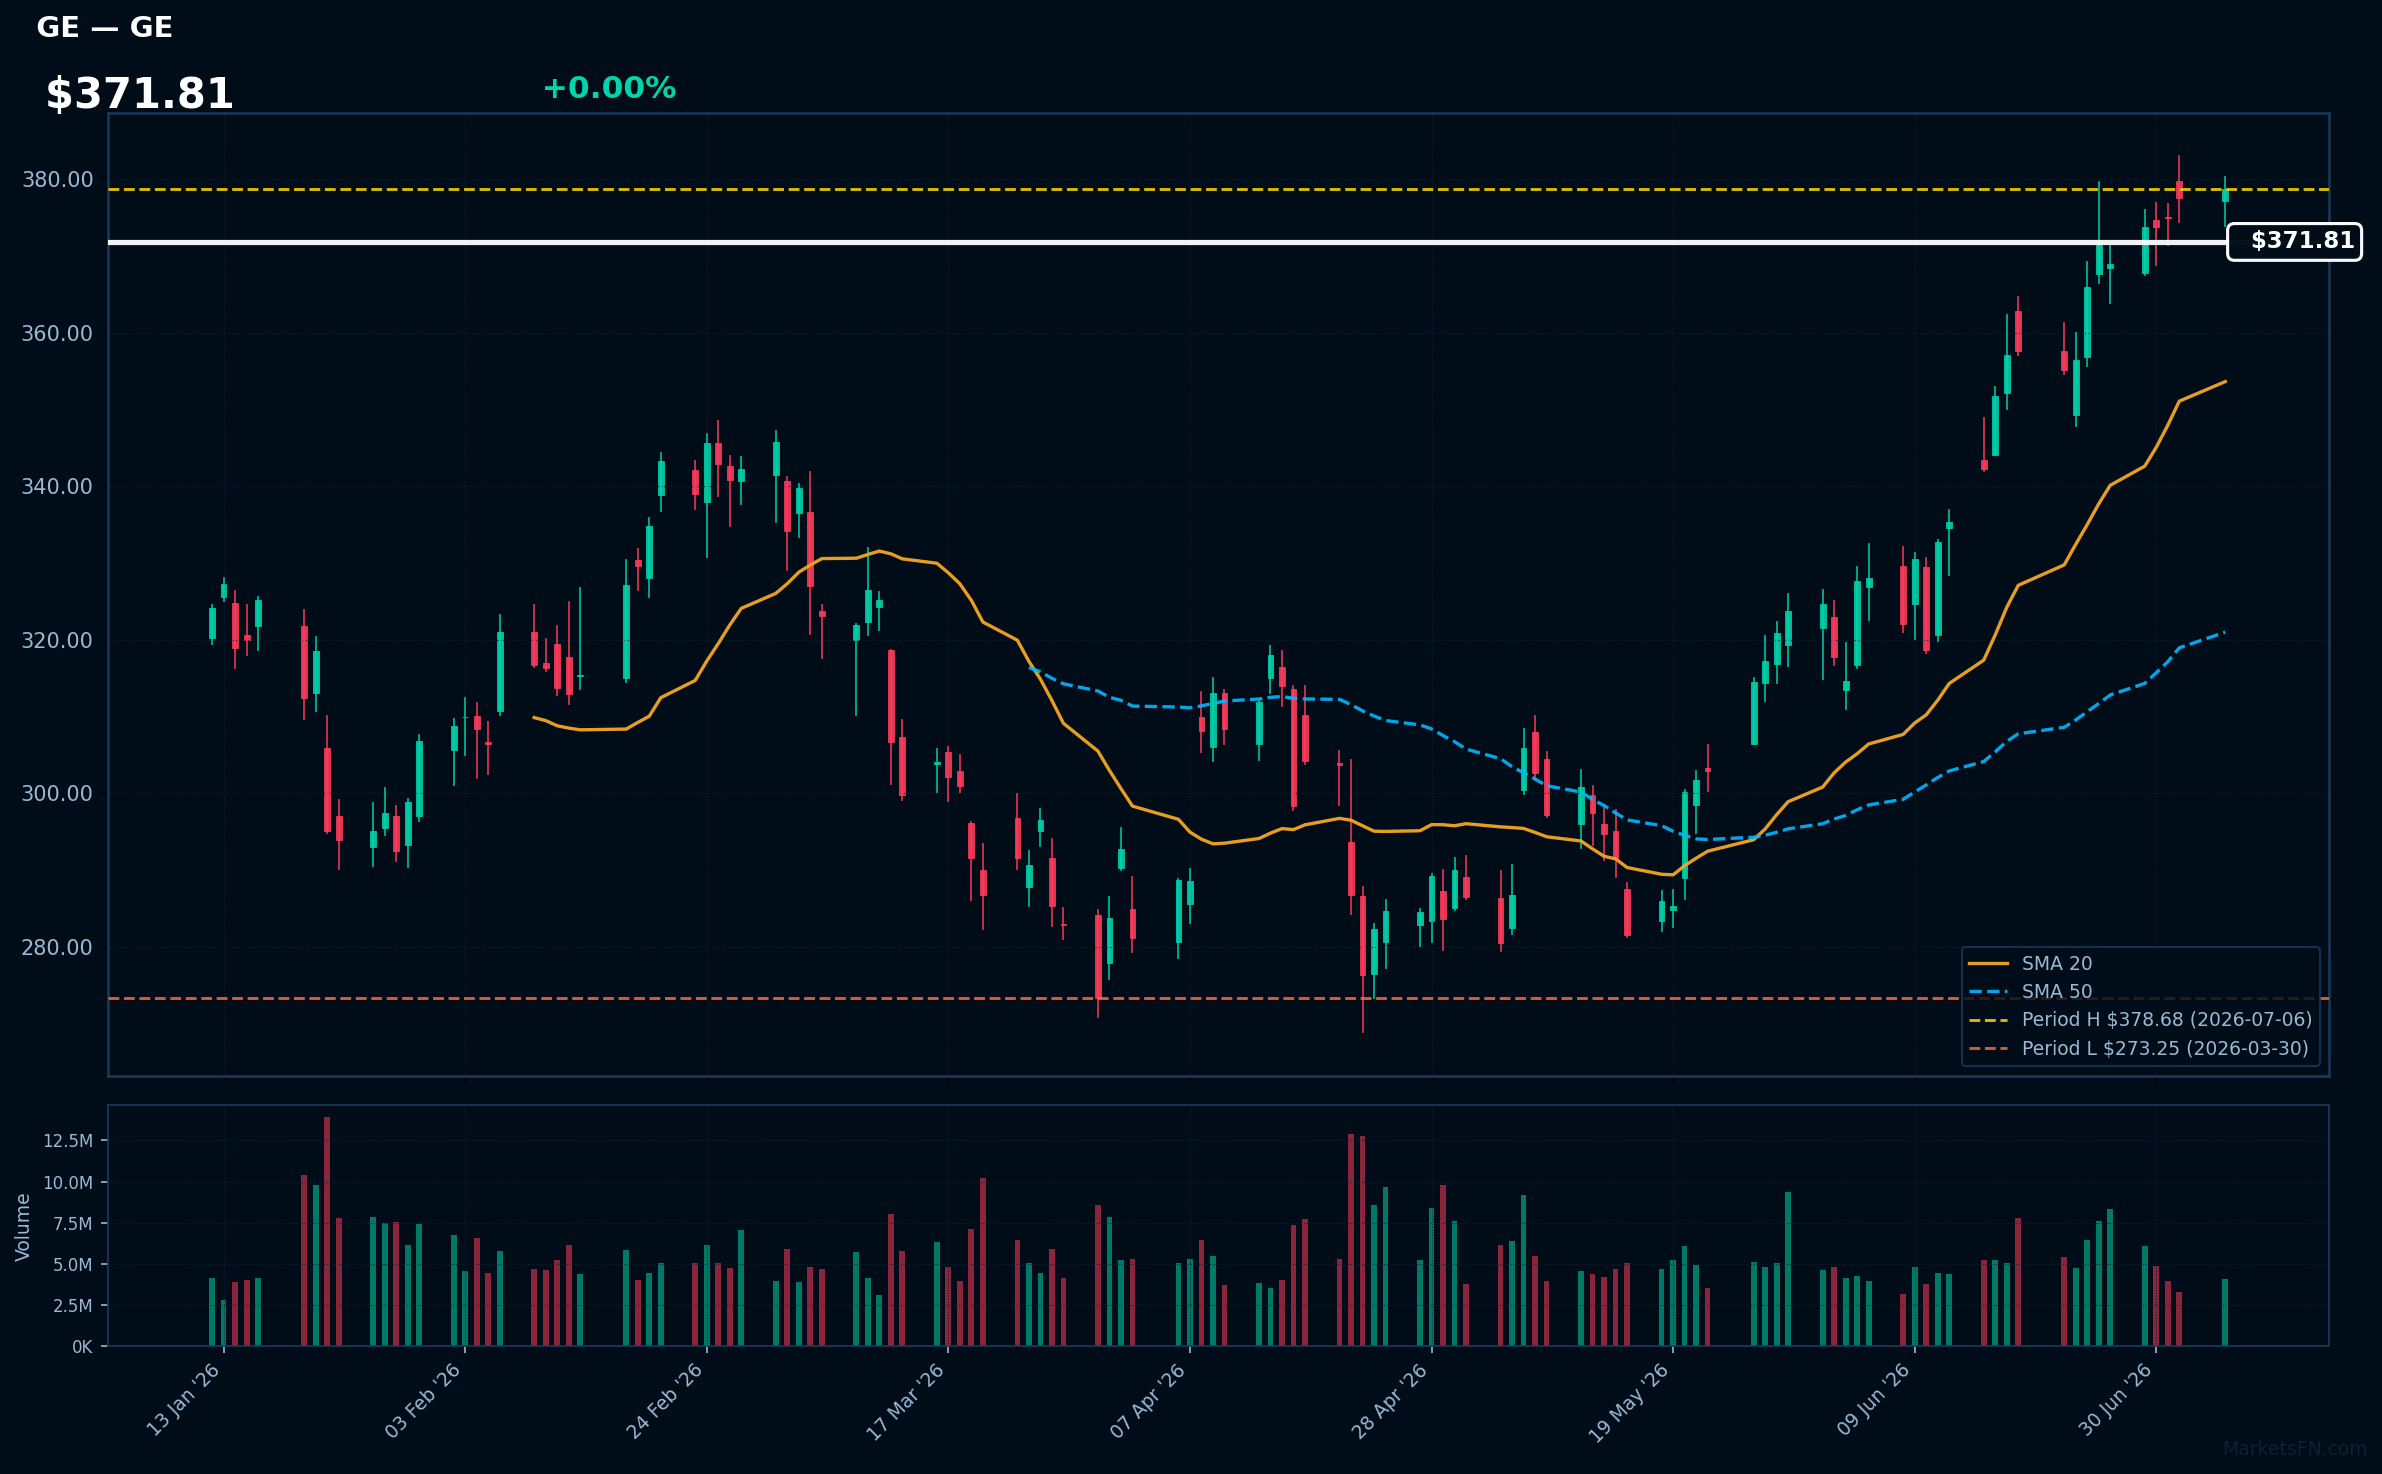
GE | GE Aerospace | Industrials | Price Last: $378.68 | % Realized: +18.06% | RSI: 68.2 | % above MA200: +22.1% | Trend: Above MA20, MA50, MA200
GE Aerospace is a leader in commercial and defense aviation, producing jet engines, components, and services. Investors should care about its dominance in the aviation industry and potential for long-term growth driven by increasing air travel demand and modernization of fleets.
GE Aerospace's current technical situation indicates strong momentum, with RSI(14) at 68.2 and a bullish MA alignment (price > MA20 > MA50 > MA200), suggesting a sustained uptrend. The stock is near its 2026 YTD high, 0.0% below, potentially setting up for a breakout.
Related headlines
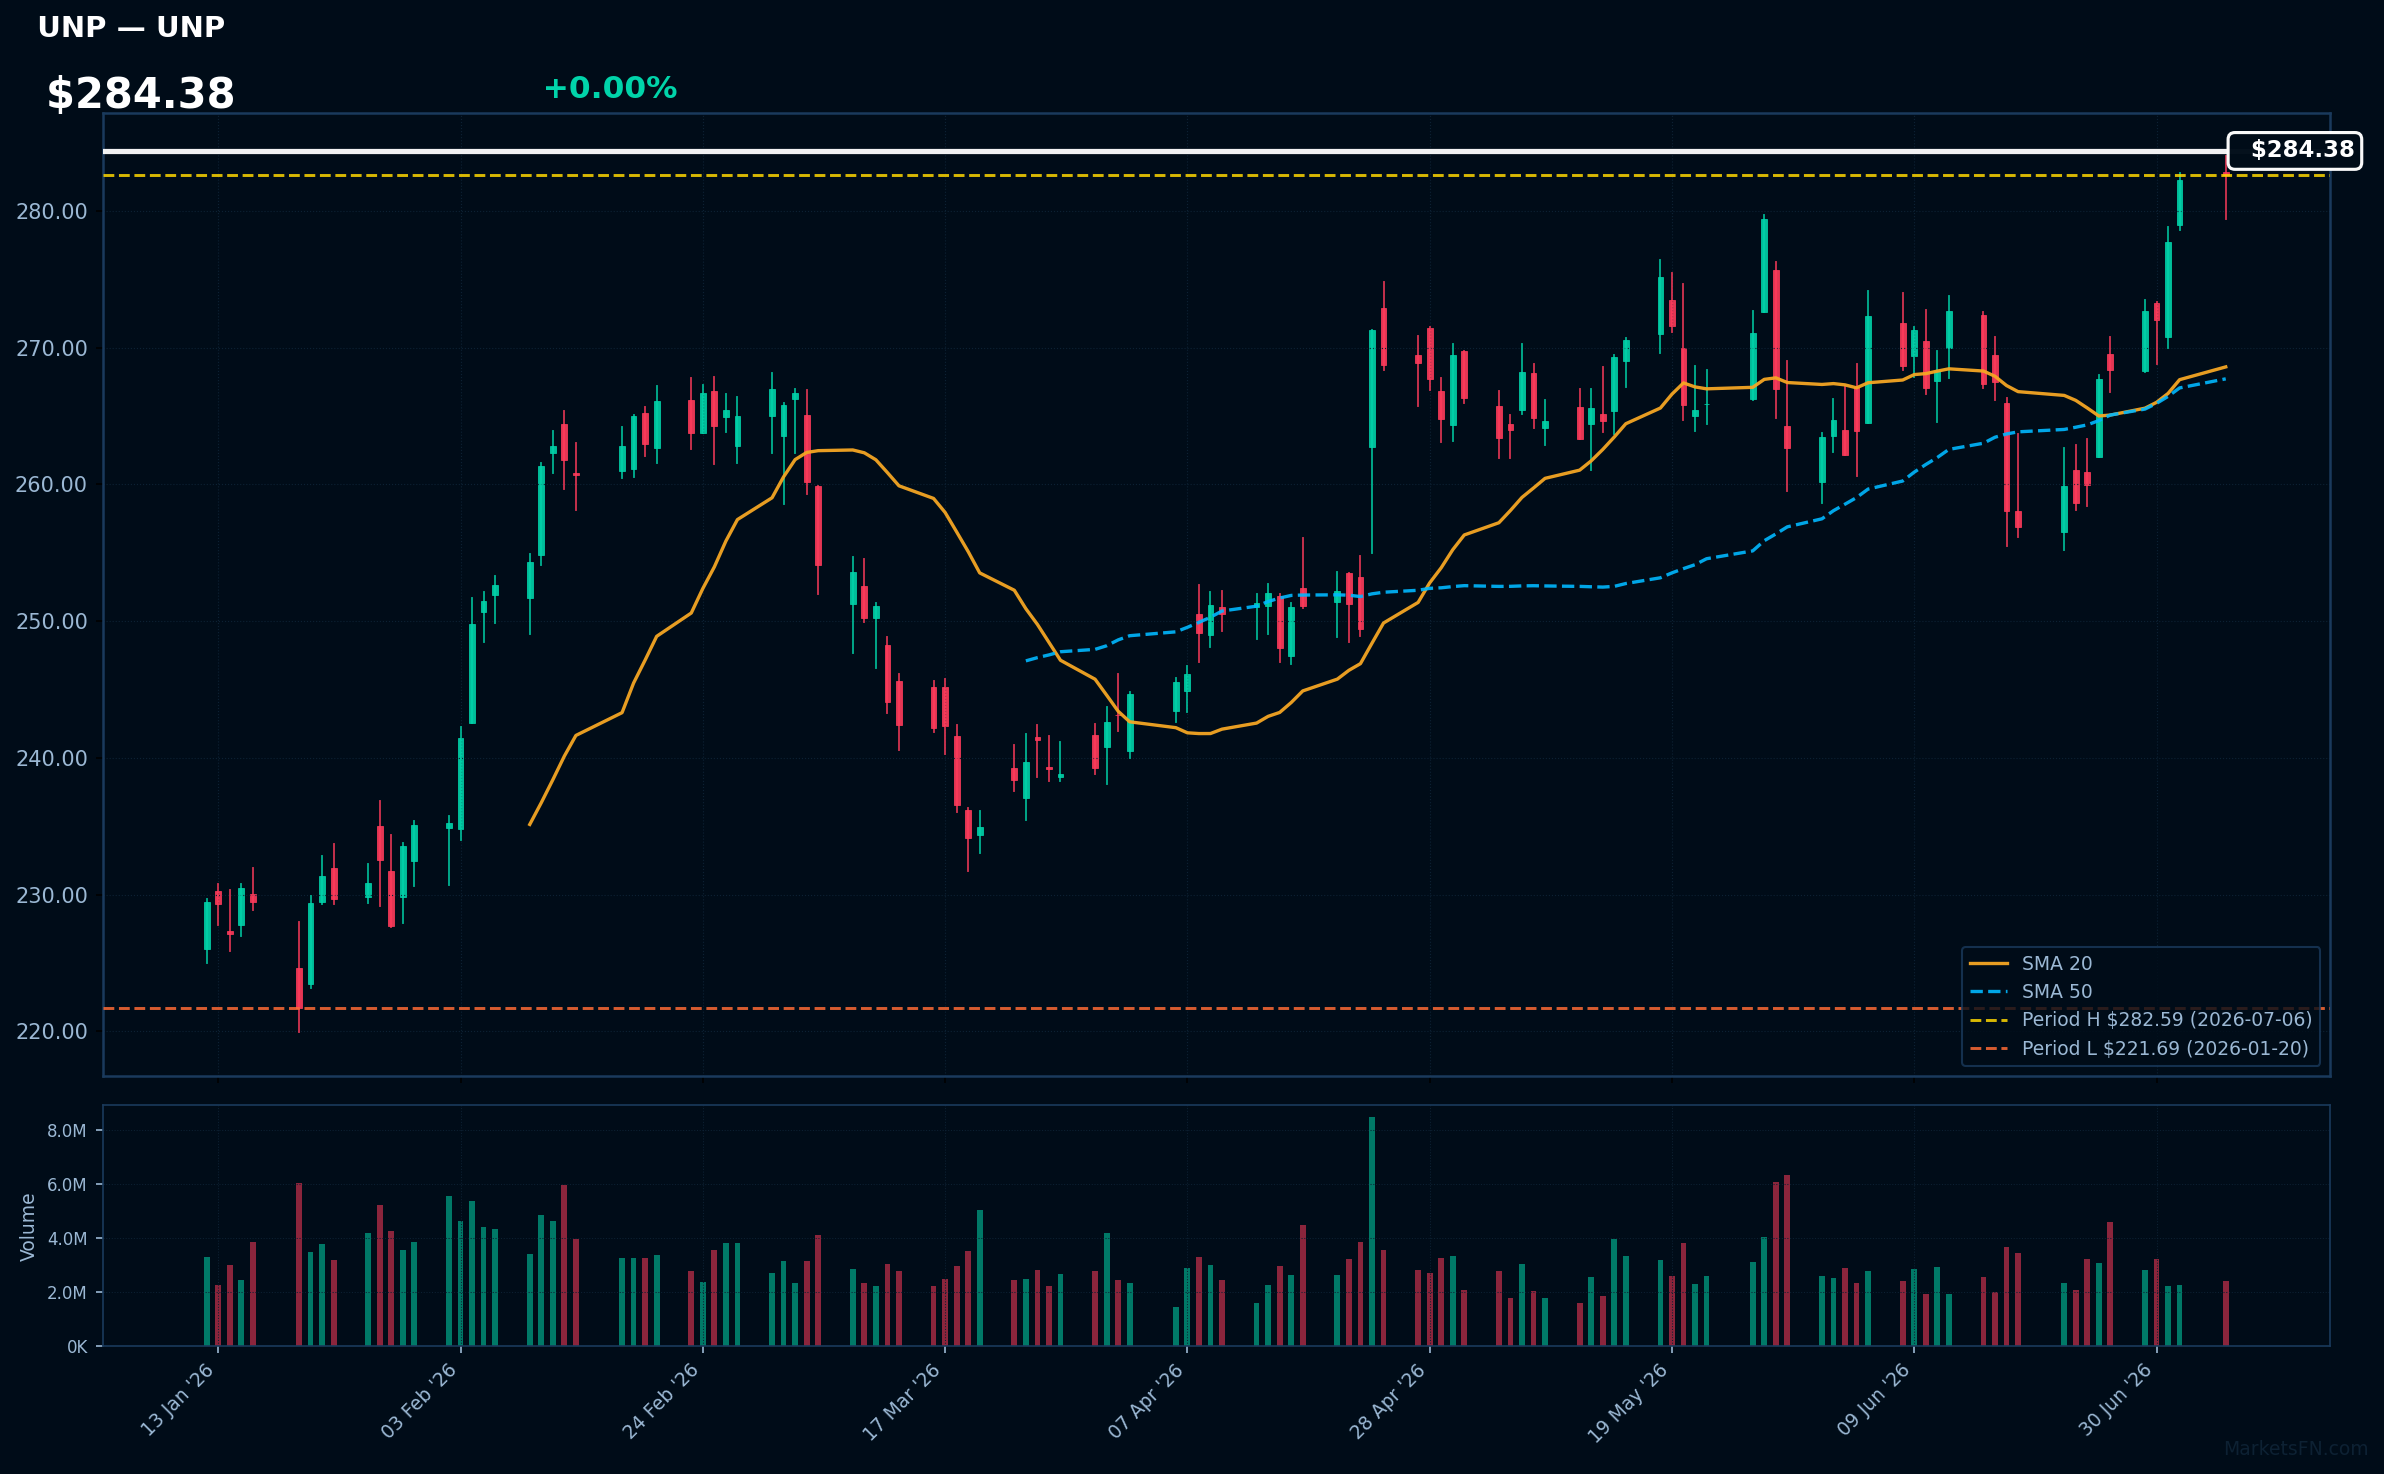
UNP | Union Pacific Corp | Industrials | Price Last: $282.59 | % Realized: +21.85% | RSI: 67.4 | % above MA200: +15.3% | Trend: Above MA20, MA50, MA200
Union Pacific Corp (UNP) operates North America's largest railroad network, efficiently transporting goods across key industries like energy, automotive, and agriculture. Investors care about its operational efficiency and market share in the transportation sector.
UNP's technicals indicate sustained uptrend with price > MA20 > MA50 > MA200. RSI(14) is 67.4, nearing overbought territory. The stock is 0.0% below its 2026 YTD high, suggesting potential breakout momentum.
Related headlines
- Union Pacific and Norfolk Southern Celebrate Americas 250th Anniversary with Worlds Largest Steam Locomotive in Philadelphia
- Union Pacific Corporation Announces Second Quarter 2026 Earnings Release Date
- Rate, service issues flagged by ag retailers in Union Pacific-Norfolk Southern rail merger
- Union Pacific Corporation CEO Jim Vena and CFO Jennifer Hamann to Address the NYSE 2026 European Investor Conference In Association with Bank of America
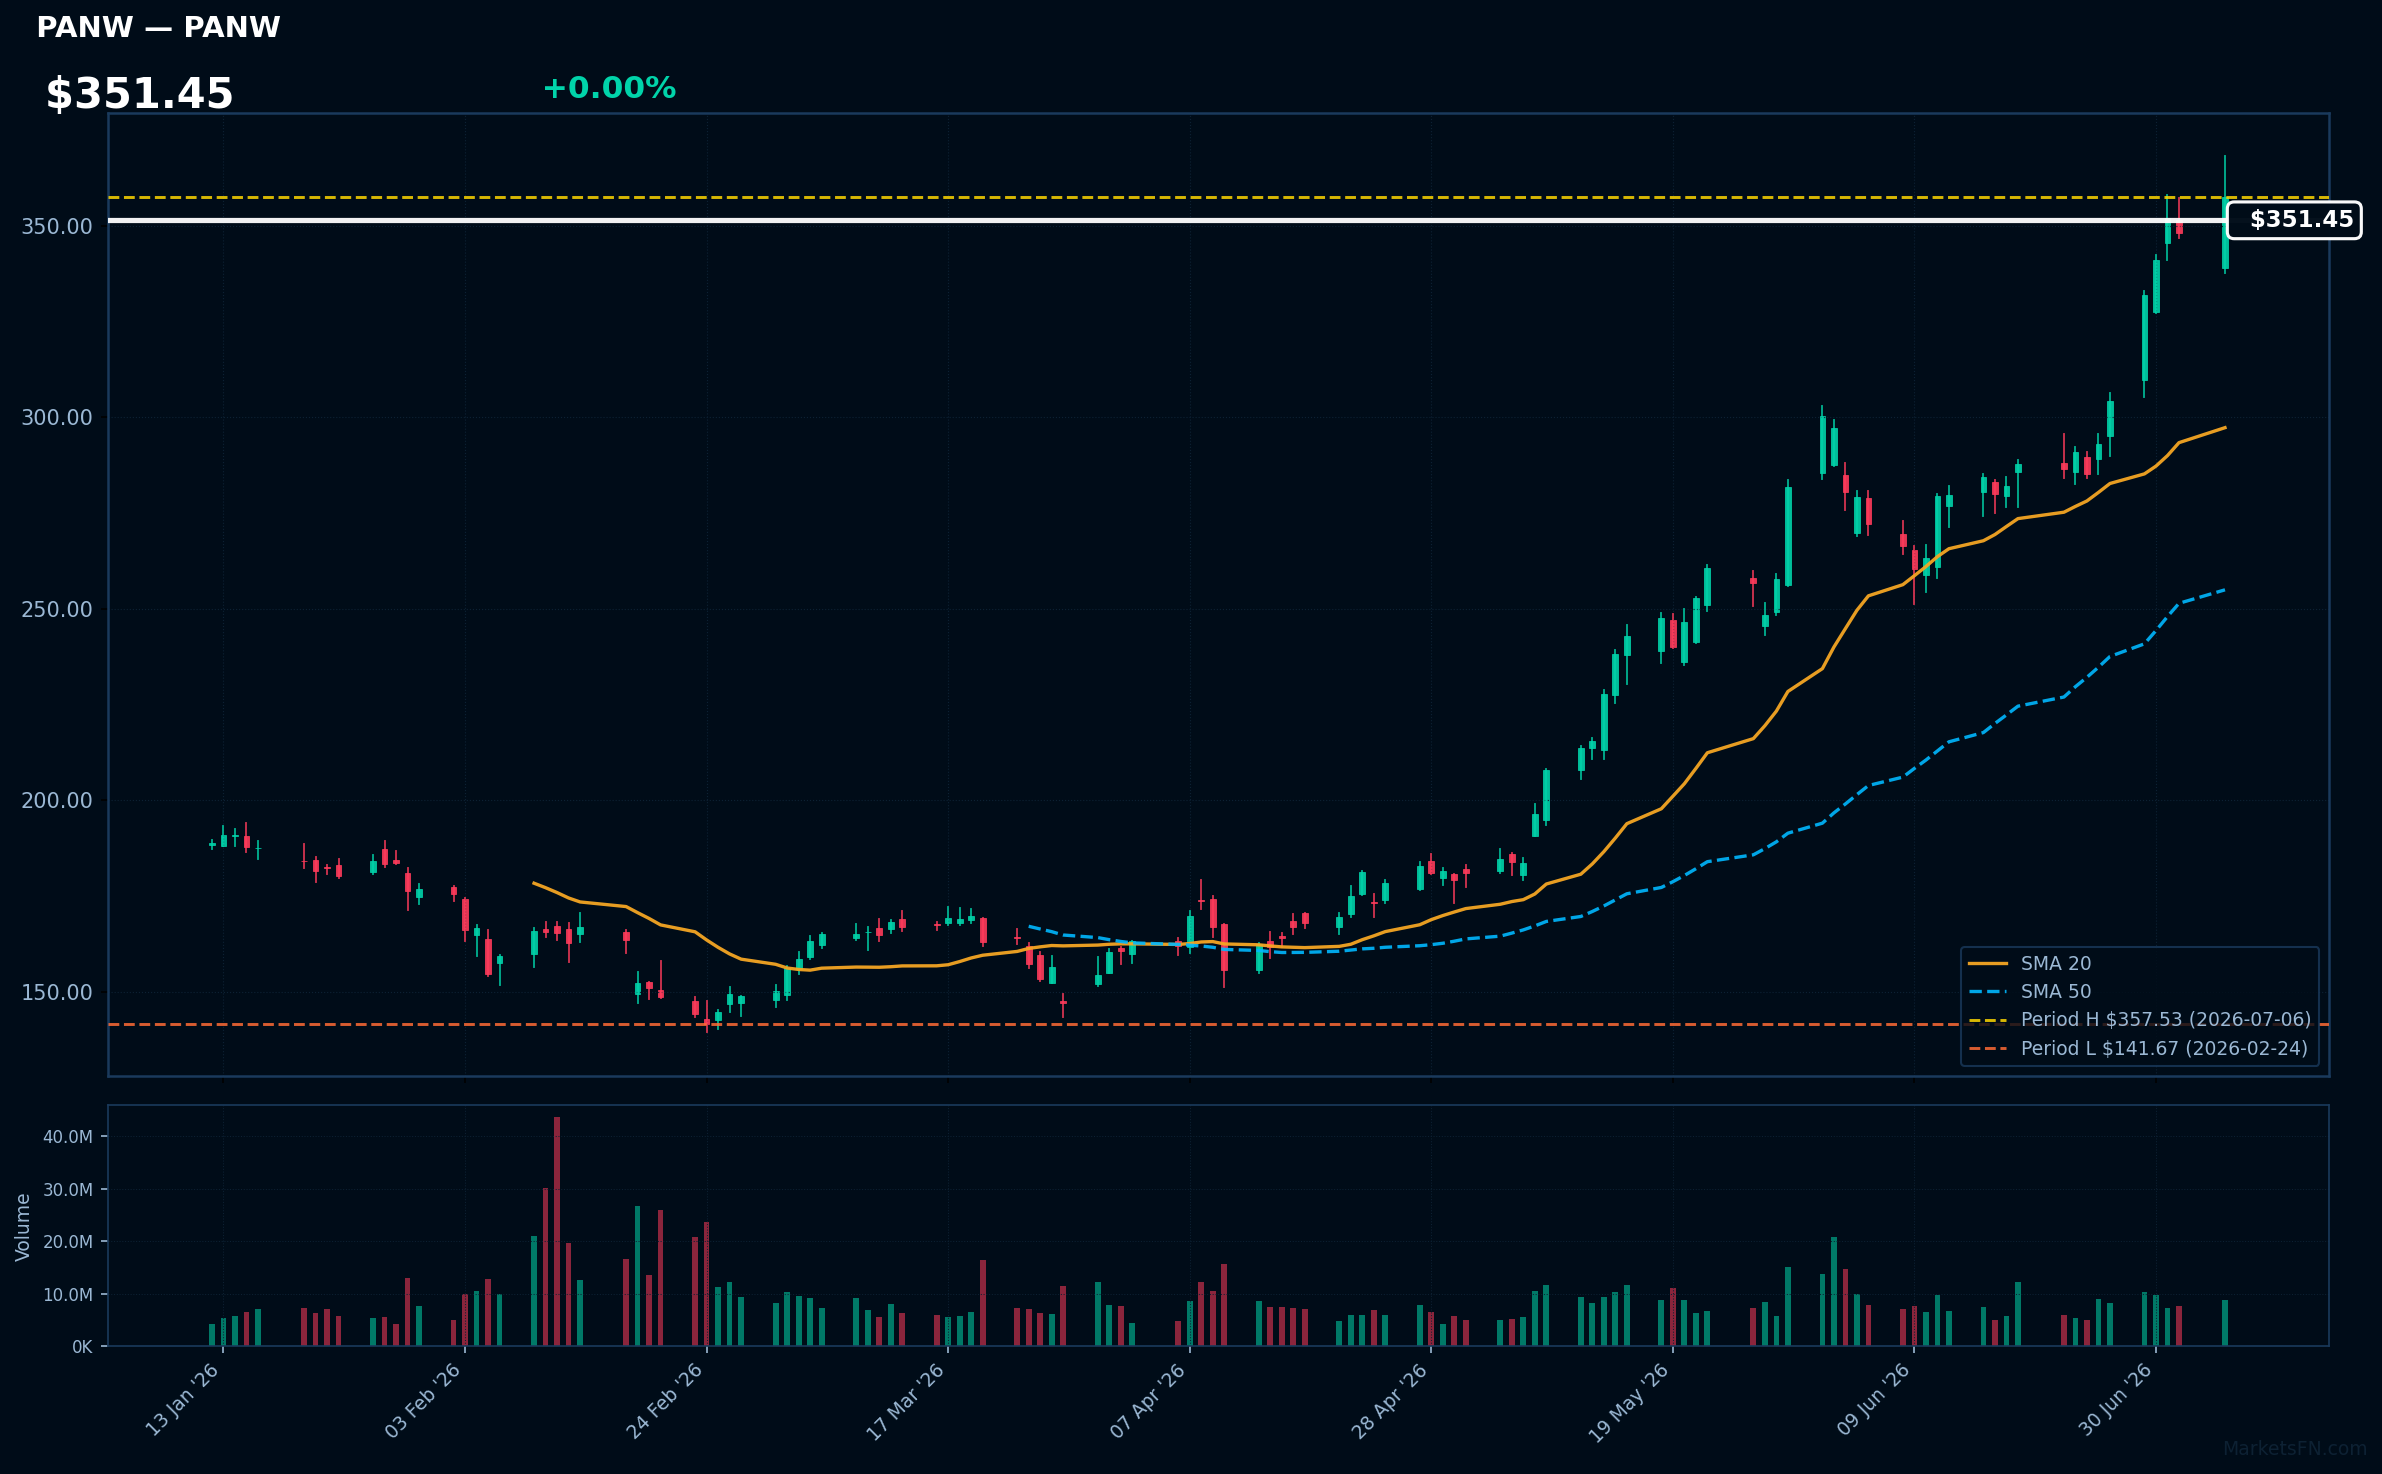
PANW | Palo Alto Networks Inc | Technology | Price Last: $357.53 | % Realized: +99.33% | RSI: 75.9 | % above MA200: +76.1% | Trend: Above MA20, MA50, MA200
Palo Alto Networks Inc is a cybersecurity company providing advanced threat prevention and security solutions. Investors should care as its innovative products and strong market position drive growth, making it a significant player in the rapidly expanding cybersecurity market.
Palo Alto Networks Inc is in a sustained uptrend with price at $351.45, above MA20, MA50, and MA200. RSI(14) is 75.9, nearing overbought territory. The stock is 0.0% below its 2026 YTD high, indicating potential breakout momentum.
Related headlines
📉 Nearest to 2026 Low
Sectors represented: Real Estate (2), Consumer Cyclical (1), Communication Services (1), Consumer Defensive (1)
| Ticker | Company | Sector | Price Last | % Realized | 2026 YTD Low Date | RSI | % above MA200 | Trend |
|---|---|---|---|---|---|---|---|---|
| AMT | American Tower Corp | Real Estate | $162.11 | -7.26% | 2026-07-06 | 37.7 | -10.4% | Below MA20, MA50, MA200 |
| ORLY | O'Reilly Automotive, Inc | Consumer Cyclical | $84.24 | -6.75% | 2026-07-06 | 41.9 | -11.0% | Below MA20, MA50, MA200 |
| CCI | Crown Castle Inc | Real Estate | $74.92 | -15.54% | 2026-07-06 | 34.7 | -15.5% | Below MA20, MA50, MA200 |
| WBD | Warner Bros. Discovery Inc | Communication Services | $26.12 | -8.38% | 2026-07-06 | 44.6 | +1.2% | Above MA200 · Below MA20, MA50 |
| STZ | Constellation Brands Inc | Consumer Defensive | $130.68 | -7.43% | 2026-07-06 | 40.4 | -10.4% | Below MA20, MA50, MA200 |
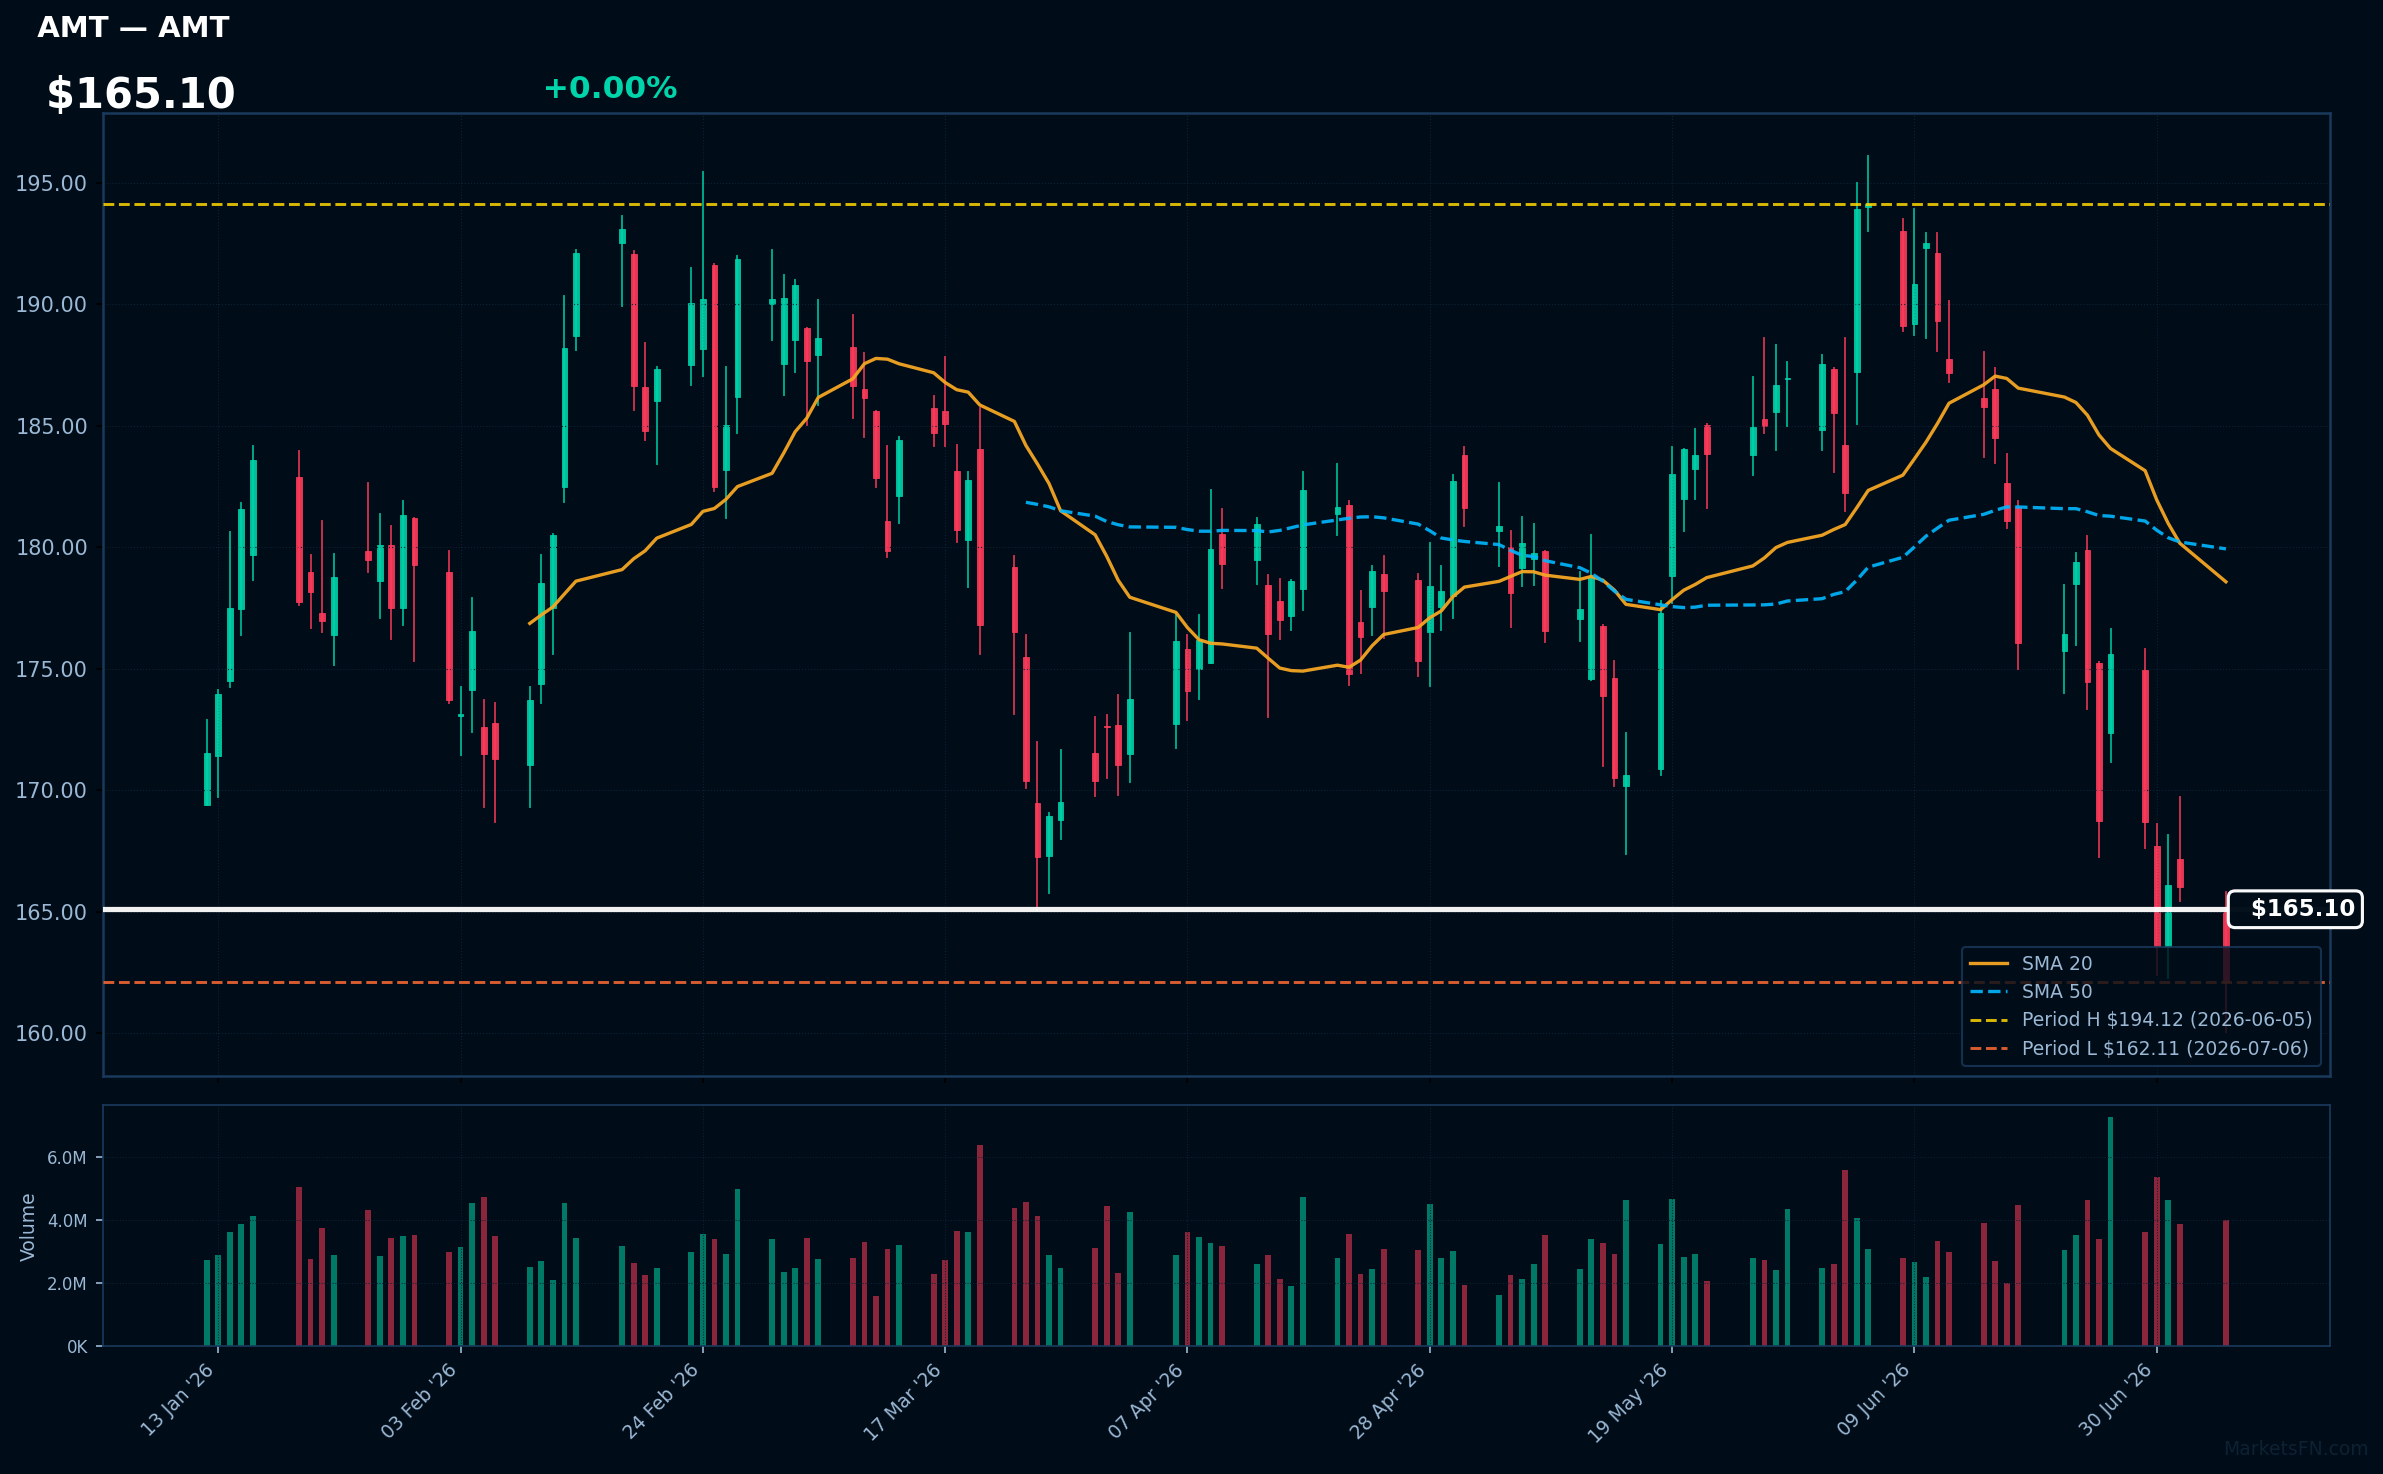
AMT | American Tower Corp | Real Estate | Price Last: $162.11 | % Realized: -7.26% | RSI: 37.7 | % above MA200: -10.4% | Trend: Below MA20, MA50, MA200
American Tower Corp is a real estate investment trust that owns and operates wireless communication infrastructure, including cell towers. Investors care because the company's tower leasing revenue is tied to the demand for mobile data and 5G infrastructure.
The stock is in a sustained downtrend with price ($165.10) below all key MAs (MA20, MA50, MA200) and an RSI(14) of 37.7, indicating bearish momentum and testing major support at its 2026 YTD low.
Related headlines
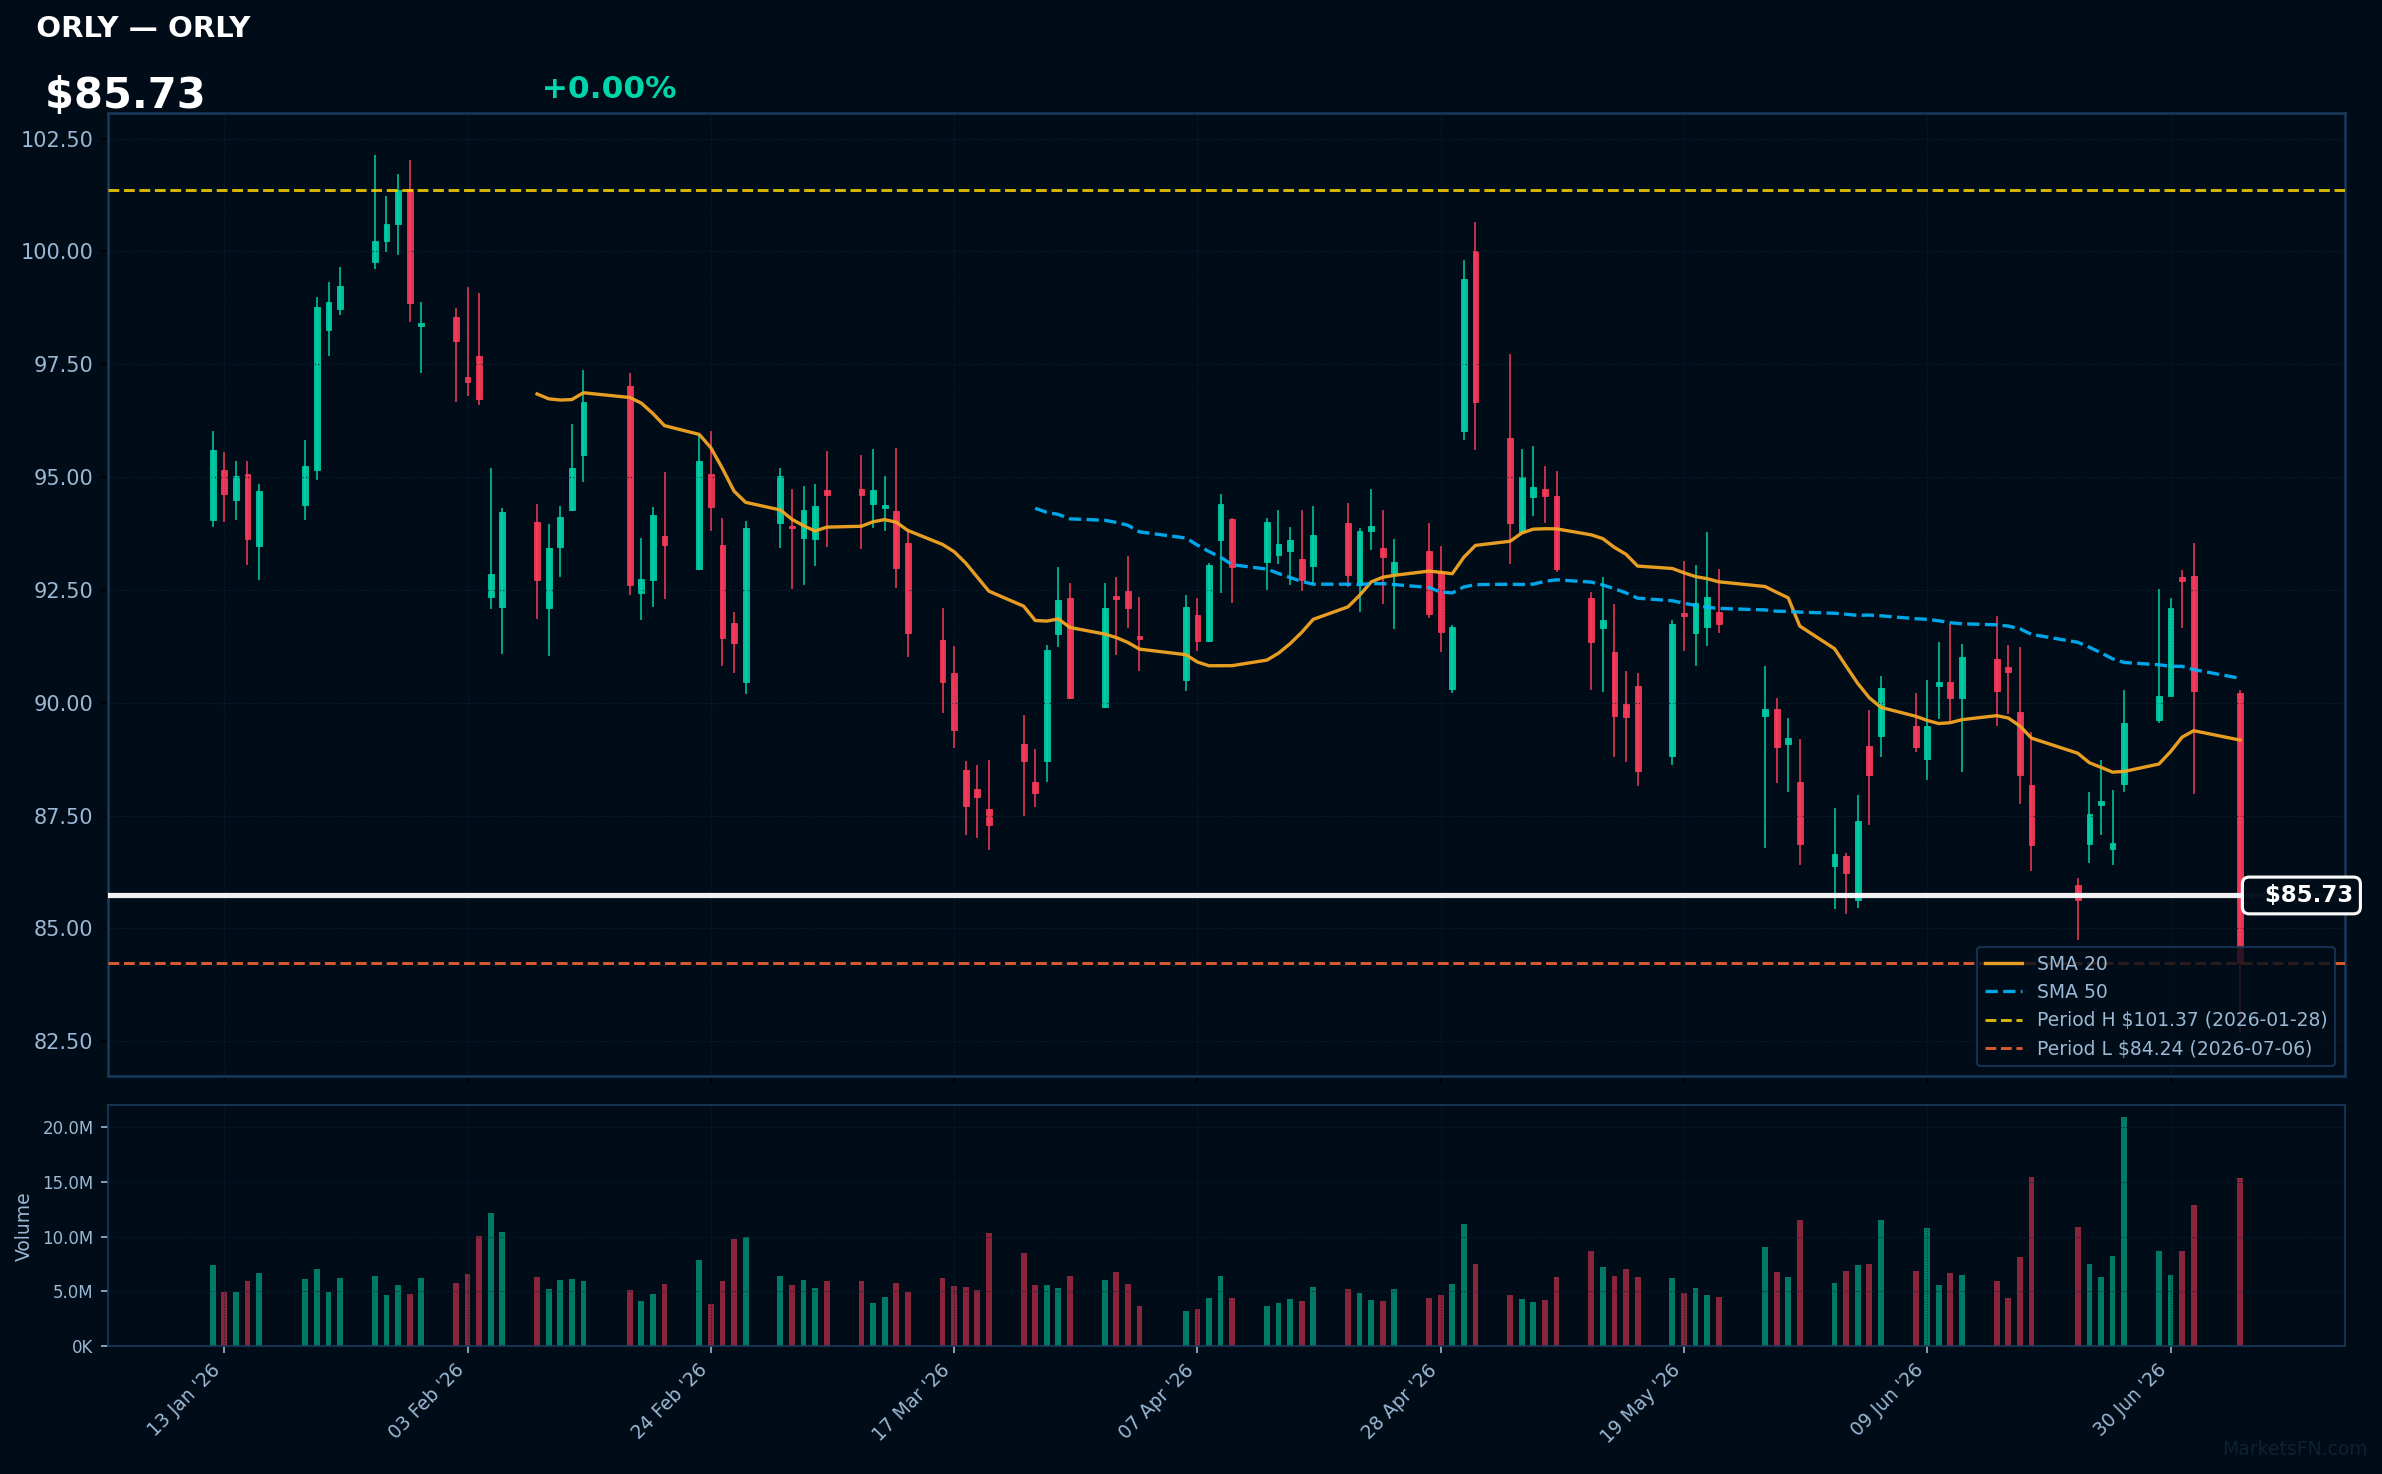
ORLY | O'Reilly Automotive, Inc | Consumer Cyclical | Price Last: $84.24 | % Realized: -6.75% | RSI: 41.9 | % above MA200: -11.0% | Trend: Below MA20, MA50, MA200
O'Reilly Automotive, Inc is a leading auto parts retailer with a vast store network. Investors should care because its performance reflects the health of the automotive aftermarket, influenced by factors like vehicle age, DIY repair trends, and professional installer demand.
The stock's technical situation is bearish, with an RSI(14) of 41.9 indicating neutral momentum, but a sustained downtrend as price ($85.73) remains below MA20, MA50, and MA200, and is 0.0% above its 2026 YTD low, testing major support.
Related headlines
- Why Did REE, HTZ, ORLY Stocks Slump To 52-Week Lows Today?
- O'Reilly Stock Sinks on Report of Possible NAPA Bid
- GPC Stock Pops 13%, ORLY Falls 5% OReilly Makes Cash Bid For Genuine Parts $10B Auto Unit, Says Report
- O'Reilly Automotive, Inc. Announces Dates for Its Second Quarter 2026 Earnings Release and Conference Call
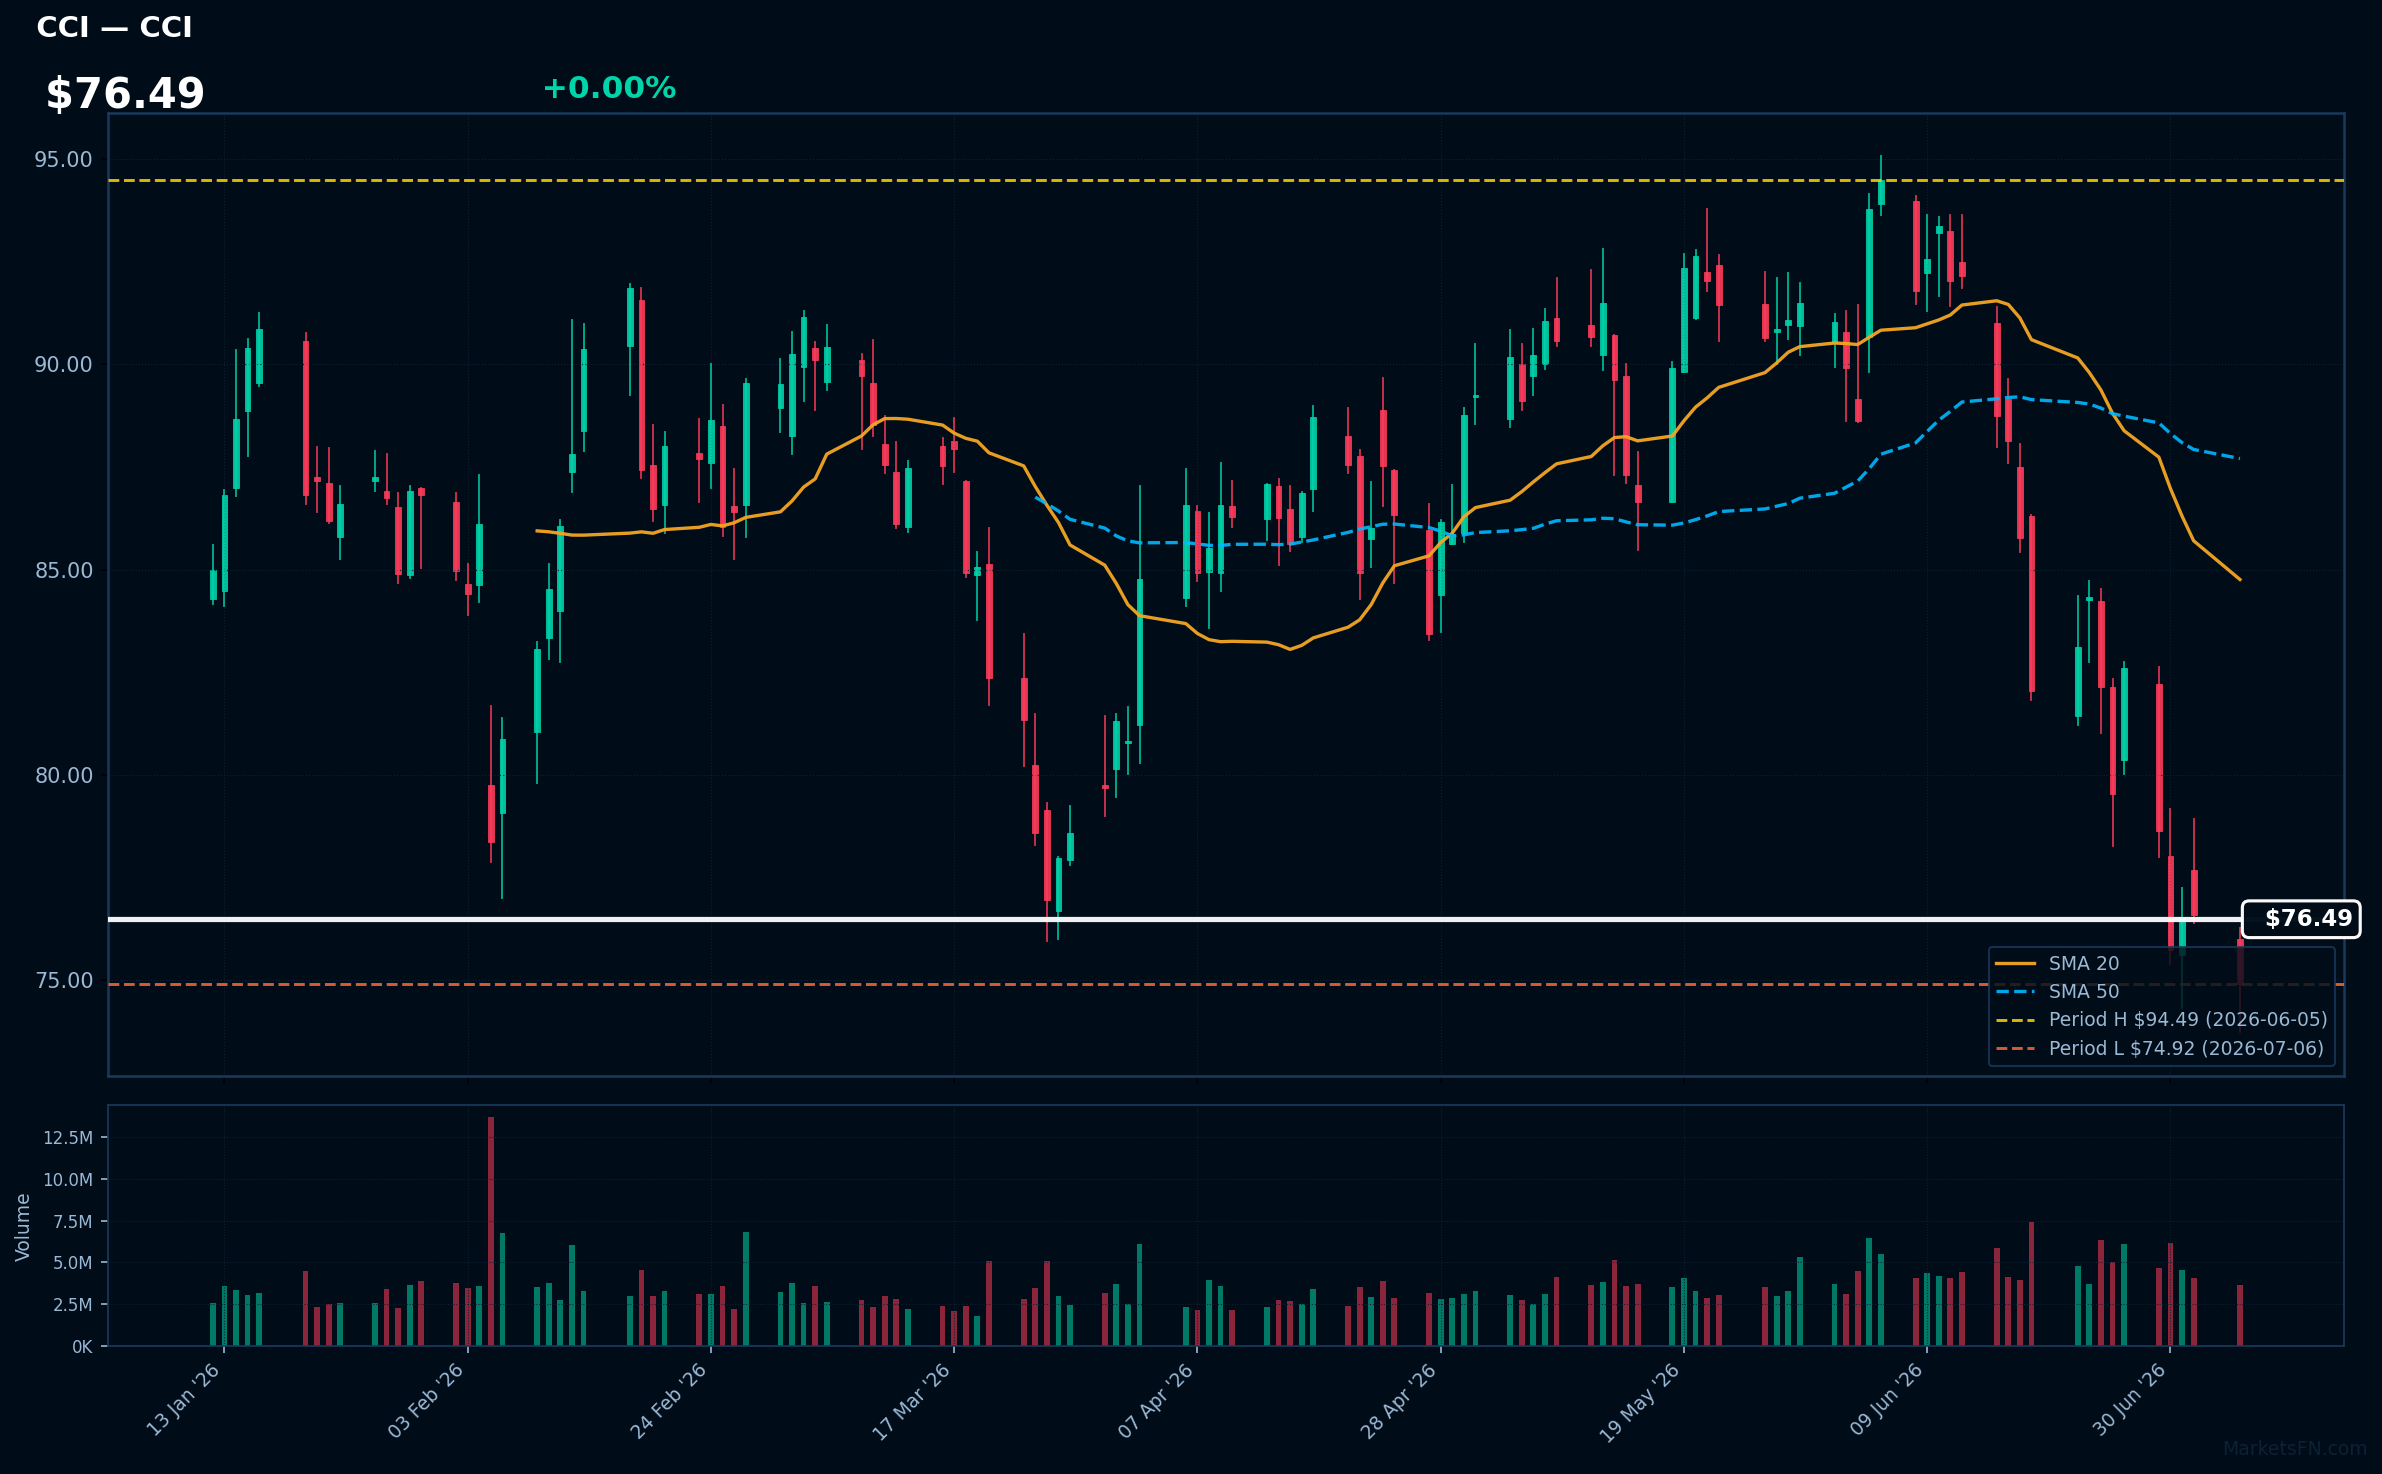
CCI | Crown Castle Inc | Real Estate | Price Last: $74.92 | % Realized: -15.54% | RSI: 34.7 | % above MA200: -15.5% | Trend: Below MA20, MA50, MA200
Crown Castle Inc (CCI) owns and operates a portfolio of cell towers and fiber infrastructure, providing critical infrastructure for wireless communication. Investors should care because the company's assets enable mobile network operators to deliver high-speed data services.
CCI's technical situation is bearish, with an RSI(14) of 34.7 indicating oversold conditions, and a sustained downtrend confirmed by bearish MA alignment: price ($76.49) < MA20 < MA50 < MA200, testing major support at its 2026 YTD low.
Related headlines
- Crown Castle Announces Second Quarter 2026 Earnings Conference Call Details
- Crown Castle Inc. stock outperforms competitors on strong trading day
- Crown Castle Names Kris Hinson as Chief Commercial Officer and Mark Lennon as Chief Information Officer
- Crown Castle Declares Quarterly Common Stock Dividend
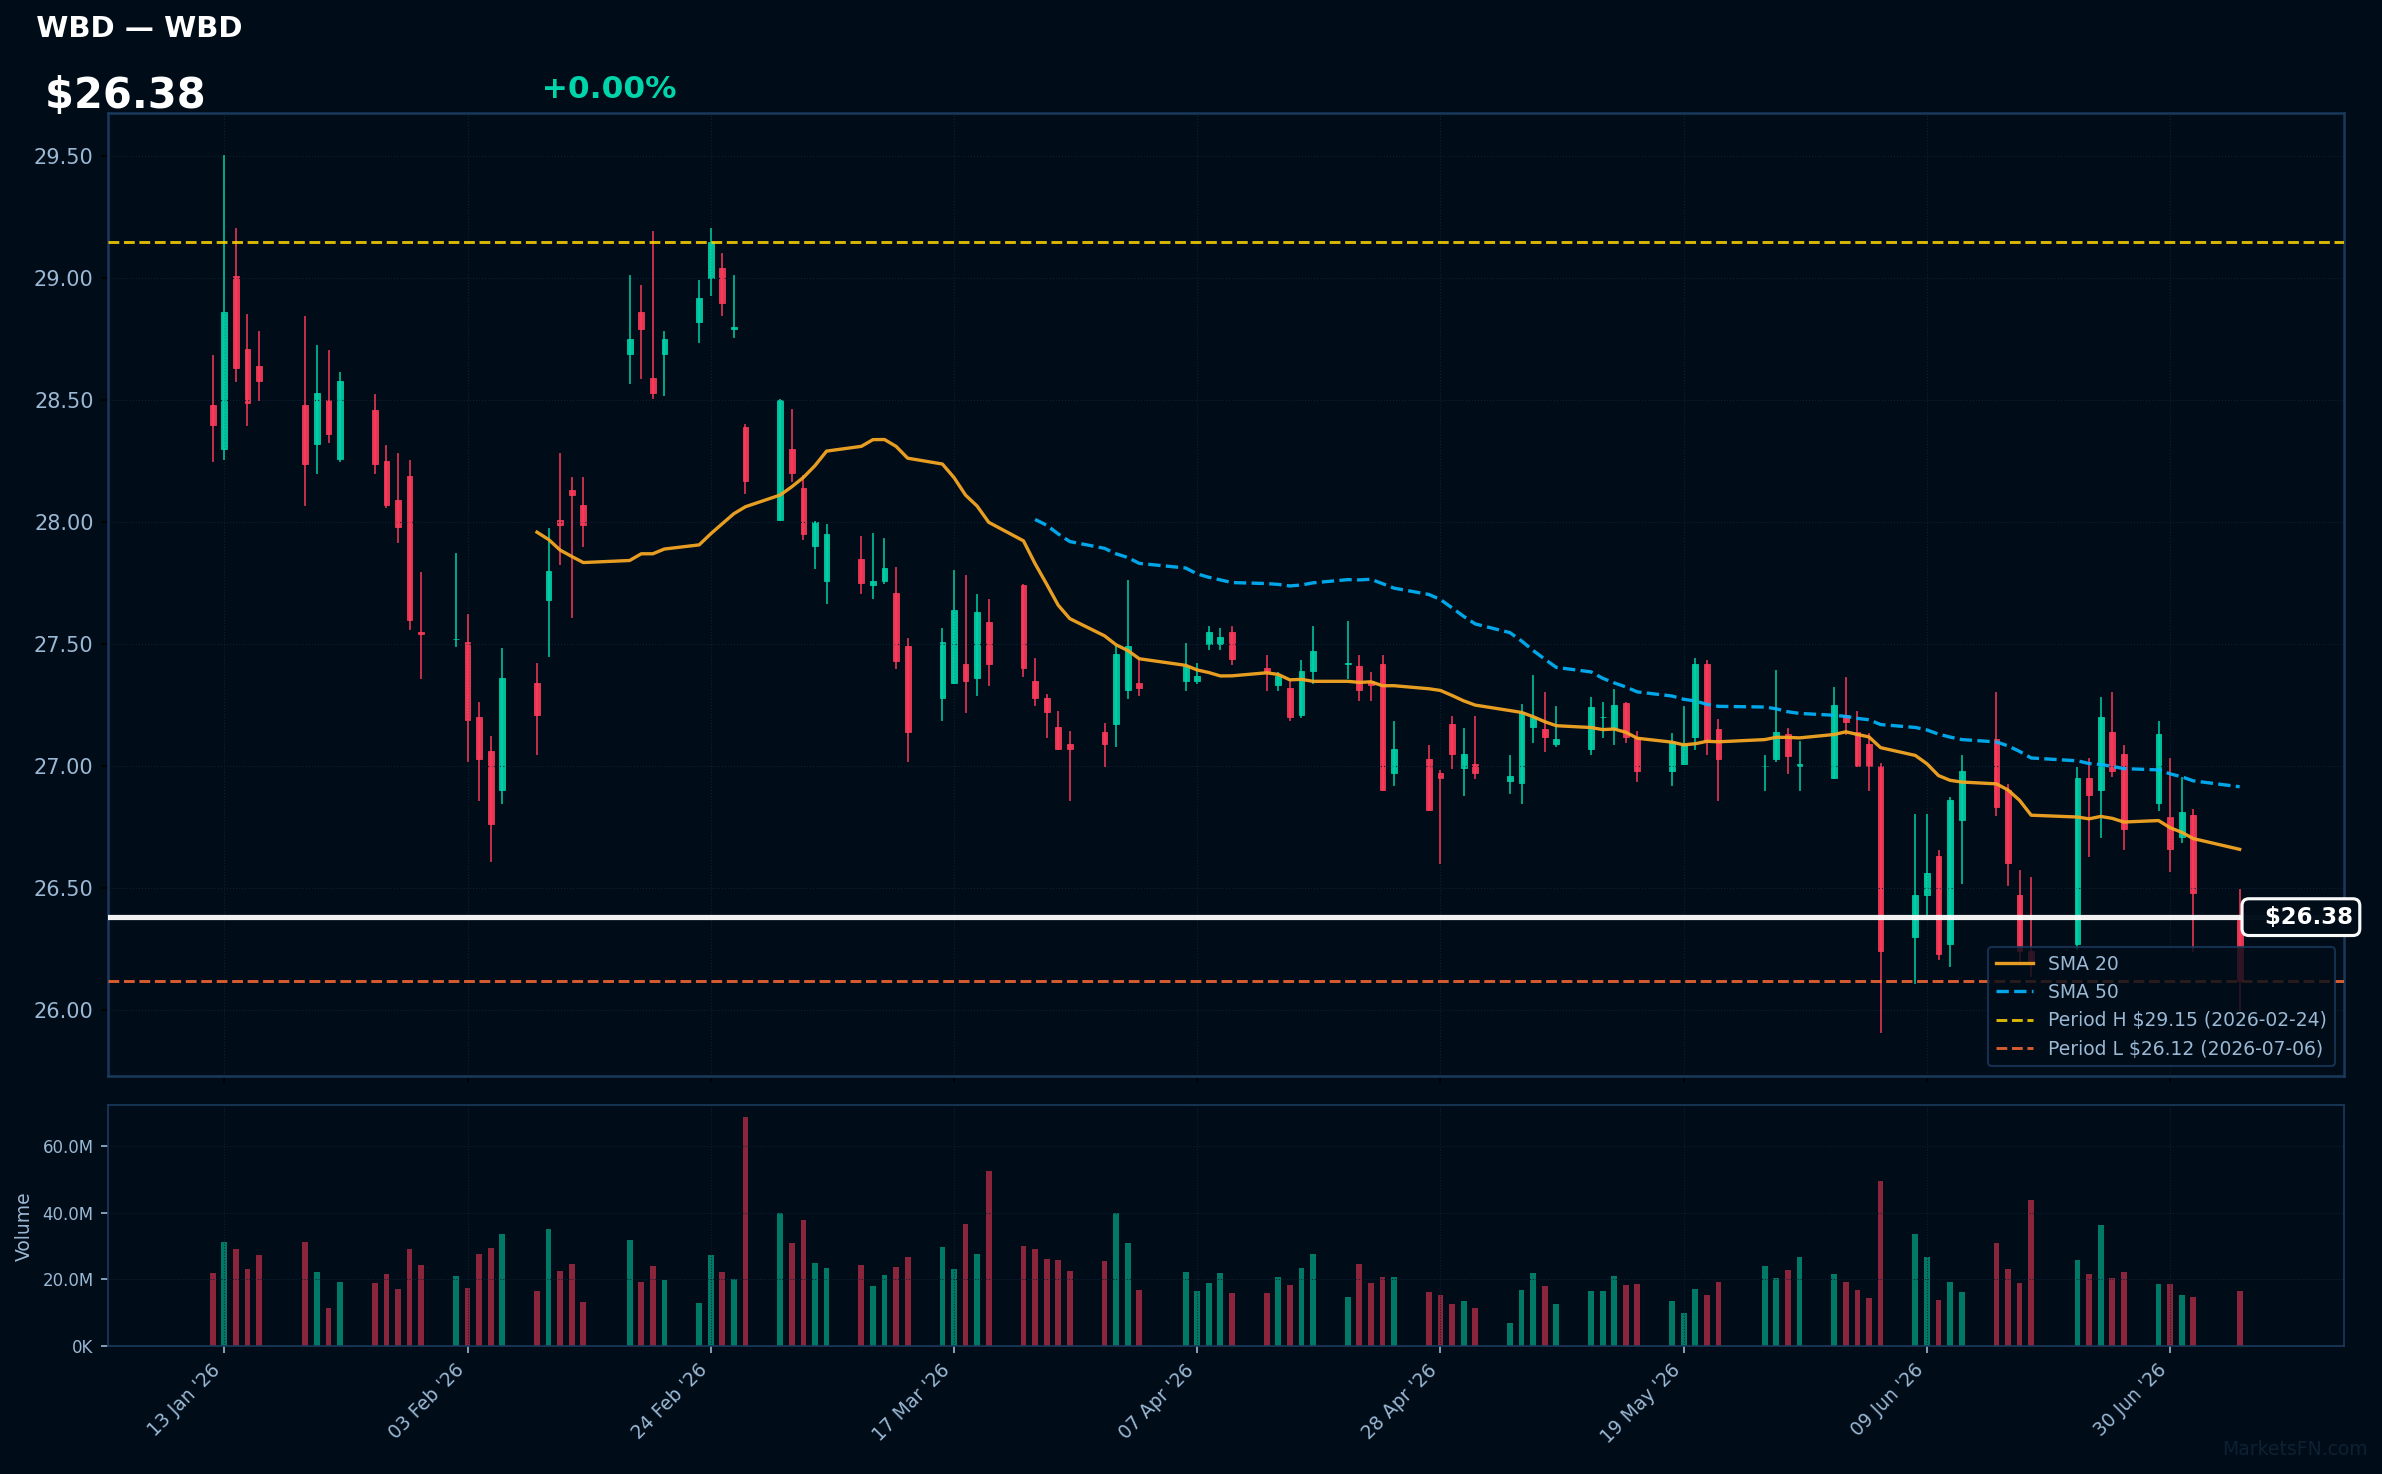
WBD | Warner Bros. Discovery Inc | Communication Services | Price Last: $26.12 | % Realized: -8.38% | RSI: 44.6 | % above MA200: +1.2% | Trend: Above MA200 · Below MA20, MA50
Warner Bros. Discovery Inc is a media conglomerate with a diverse portfolio of entertainment and news assets, including Warner Bros. film studio, HBO, and Discovery Channel, making it a significant player in content creation and distribution.
WBD's technicals indicate a warning sign: RSI(14) at 44.6 suggests neutral momentum, while price is below MA20/MA50 but above MA200, showing mixed signals, and is 0.0% above its 2026 YTD low, testing major support.
Related headlines
- Warner Bros. Slips on California Lawsuit Report
- Paramount's $110 Billion Warner Deal Nears EU Decision
- Paramount Skydance Offers Concessions to Facilitate EU Approval of $81 Billion Warner Bros Deal
- PSKY Stock Inches Higher Premarket: Paramount Reportedly Offers EU Concessions To Advance $110B Warner Bros Deal
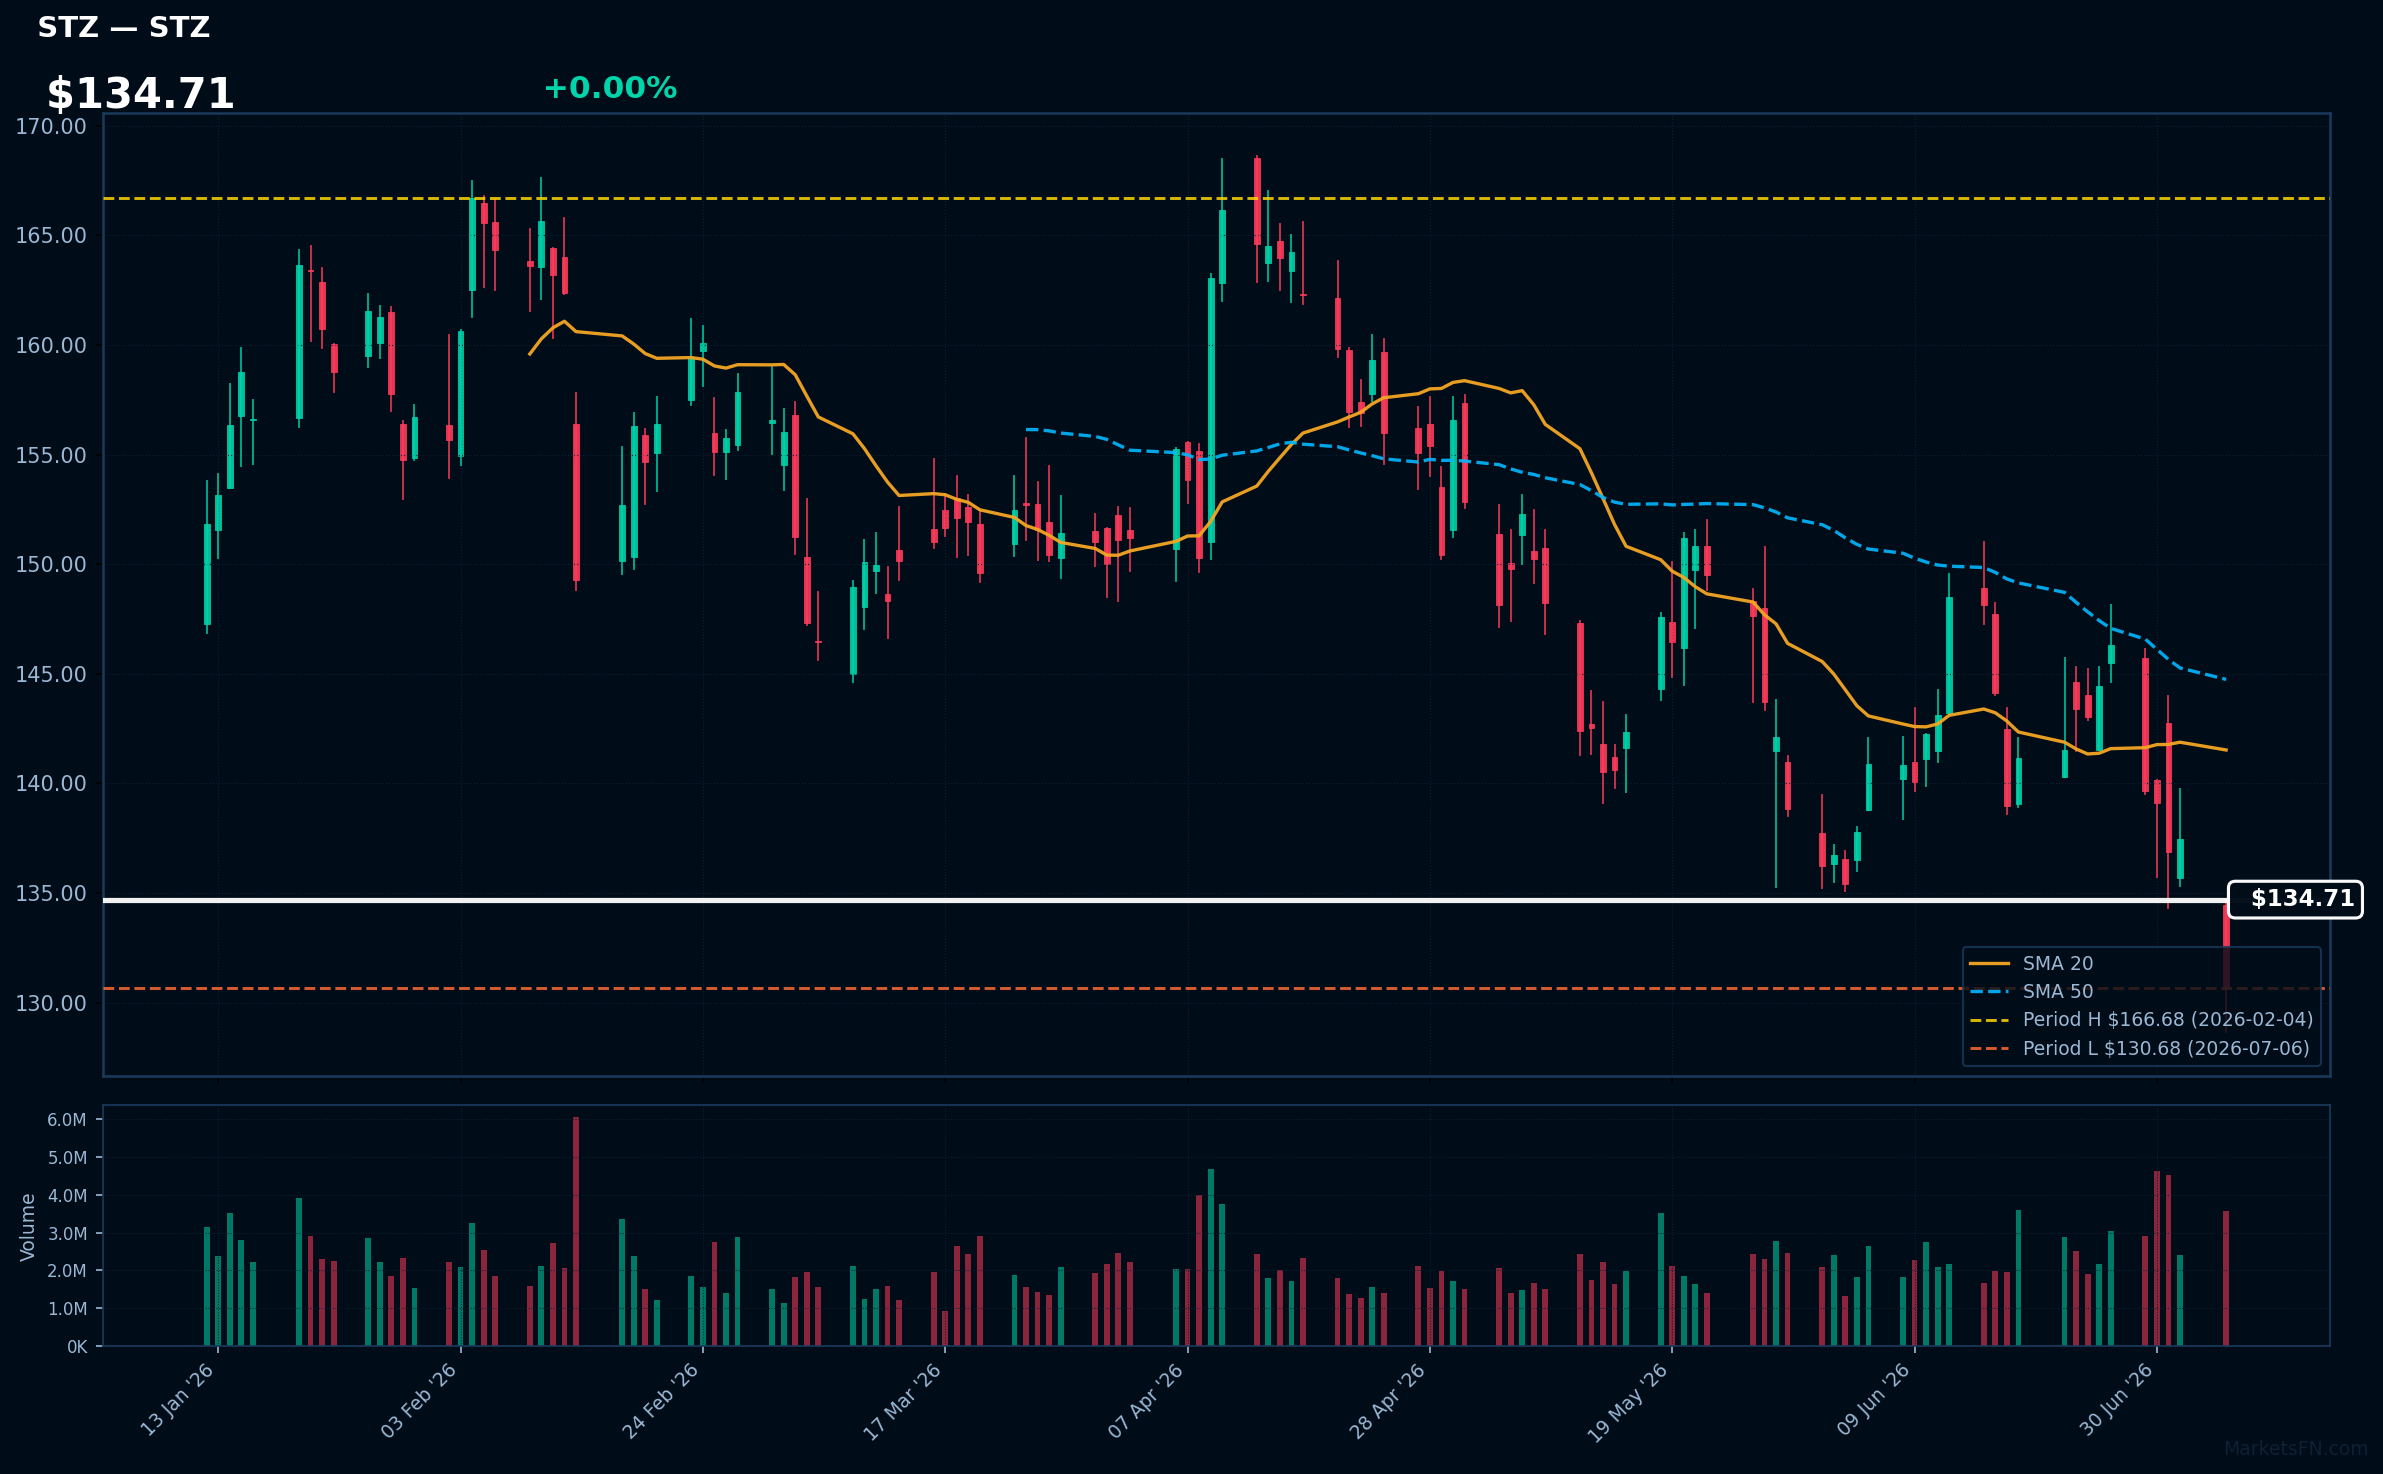
STZ | Constellation Brands Inc | Consumer Defensive | Price Last: $130.68 | % Realized: -7.43% | RSI: 40.4 | % above MA200: -10.4% | Trend: Below MA20, MA50, MA200
Constellation Brands Inc (STZ) is a leading beverage alcohol company with a portfolio of beer, wine, and spirits brands, including Corona and Modelo. Investors should care about its brand strength and market share in the competitive beverage industry.
STZ is testing major support at its 2026 YTD low, with a bearish MA alignment (price < MA20 < MA50 < MA200) and RSI(14) at 40.4, indicating a sustained downtrend with potential further downside; the stock has lost 7.4% YTD.
Related headlines
- You may want to start a position in Constellation Brands, says Jim Cramer
- Constellation Brands Inc. Cl A stock underperforms Monday when compared to competitors
- Constellation Brands Inc (STZ) Q1 2027 Earnings Call Highlights: Navigating Growth Amid Volatility
- Constellation's New Boss Sees Brighter Summer for Beer
Market Commentary
The S&P 500 stocks listed are currently trading near their 2026 year-to-date (YTD) extremes, with some at their highs and others at their lows. Specifically, JPMorgan Chase & Co (JPM), Bank Of America Corp (BAC), GE Aerospace (GE), Union Pacific Corp (UNP), and Palo Alto Networks Inc (PANW) are at their 2026 YTD highs, while American Tower Corp (AMT), O'Reilly Automotive, Inc (ORLY), Crown Castle Inc (CCI), Warner Bros. Discovery Inc (WBD), and Constellation Brands Inc (STZ) are at their 2026 YTD lows.
The stocks near their 2026 YTD highs are from diverse sectors, including finance (JPM, BAC), industrials (GE, UNP), and technology (PANW), indicating strong performance across various industries. Conversely, the stocks at their 2026 YTD lows are primarily from the real estate (AMT, CCI) and consumer discretionary (WBD, STZ) sectors, as well as industrials (ORLY), suggesting challenges in these areas.
Investors should monitor market conditions and sector-specific trends to understand the sustainability of these extremes. Factors influencing the financial, industrial, and technology sectors, as well as the real estate and consumer discretionary sectors, will be crucial in determining the future direction of these stocks.
Methodology: All 503 S&P 500 constituents screened. Close prices downloaded from 2026-01-01. Period high = highest close since Jan 1 2026; period low = lowest close since Jan 1 2026. Distance = (current price / period extreme − 1) × 100. Technical indicators computed on up to 1 year of daily OHLCV data.
Disclaimer: For informational purposes only. Not investment advice. Past performance is not indicative of future results.

