Nasdaq 100 2026 YTD Highs & Lows Radar: Palo Alto Networks (PANW), O'Reilly Automotive, (ORLY) and more
MarketsFN Team

Nasdaq 100 2026 YTD Highs & Lows Radar: Palo Alto Networks (PANW), O'Reilly Automotive, (ORLY) and more
Screening all 101 Nasdaq 100 constituents for stocks nearest to their 2026 year-to-date high and their 2026 YTD low. Data as of July 07, 2026. % Realized = total return since Jan 1 2026.
Legend: RSI > 70 = overbought · RSI < 30 = oversold · Green % Realized = positive YTD return · Red = negative.
📈 Nearest to 2026 High
Sectors represented: Technology (3), Healthcare (1), Communication Services (1)
| Ticker | Company | Sector | Price Last | % Realized | 2026 YTD High Date | RSI | % above MA200 | Trend |
|---|---|---|---|---|---|---|---|---|
| PANW | Palo Alto Networks Inc | Technology | $357.53 | +99.33% | 2026-07-06 | 75.8 | +76.1% | Above MA20, MA50, MA200 |
| VRTX | Vertex Pharmaceuticals, Inc | Healthcare | $529.59 | +17.13% | 2026-07-06 | 72.2 | +19.0% | Above MA20, MA50, MA200 |
| CRWD | Crowdstrike Holdings Inc | Technology | $199.38 | +75.83% | 2026-07-06 | 69.2 | +57.6% | Above MA20, MA50, MA200 |
| FTNT | Fortinet Inc | Technology | $162.35 | +108.46% | 2026-07-06 | 67.6 | +72.8% | Above MA20, MA50, MA200 |
| TTWO | Take-Two Interactive Software, Inc | Communication Services | $258.41 | +2.71% | 2026-07-06 | 75.3 | +11.9% | Above MA20, MA50, MA200 |
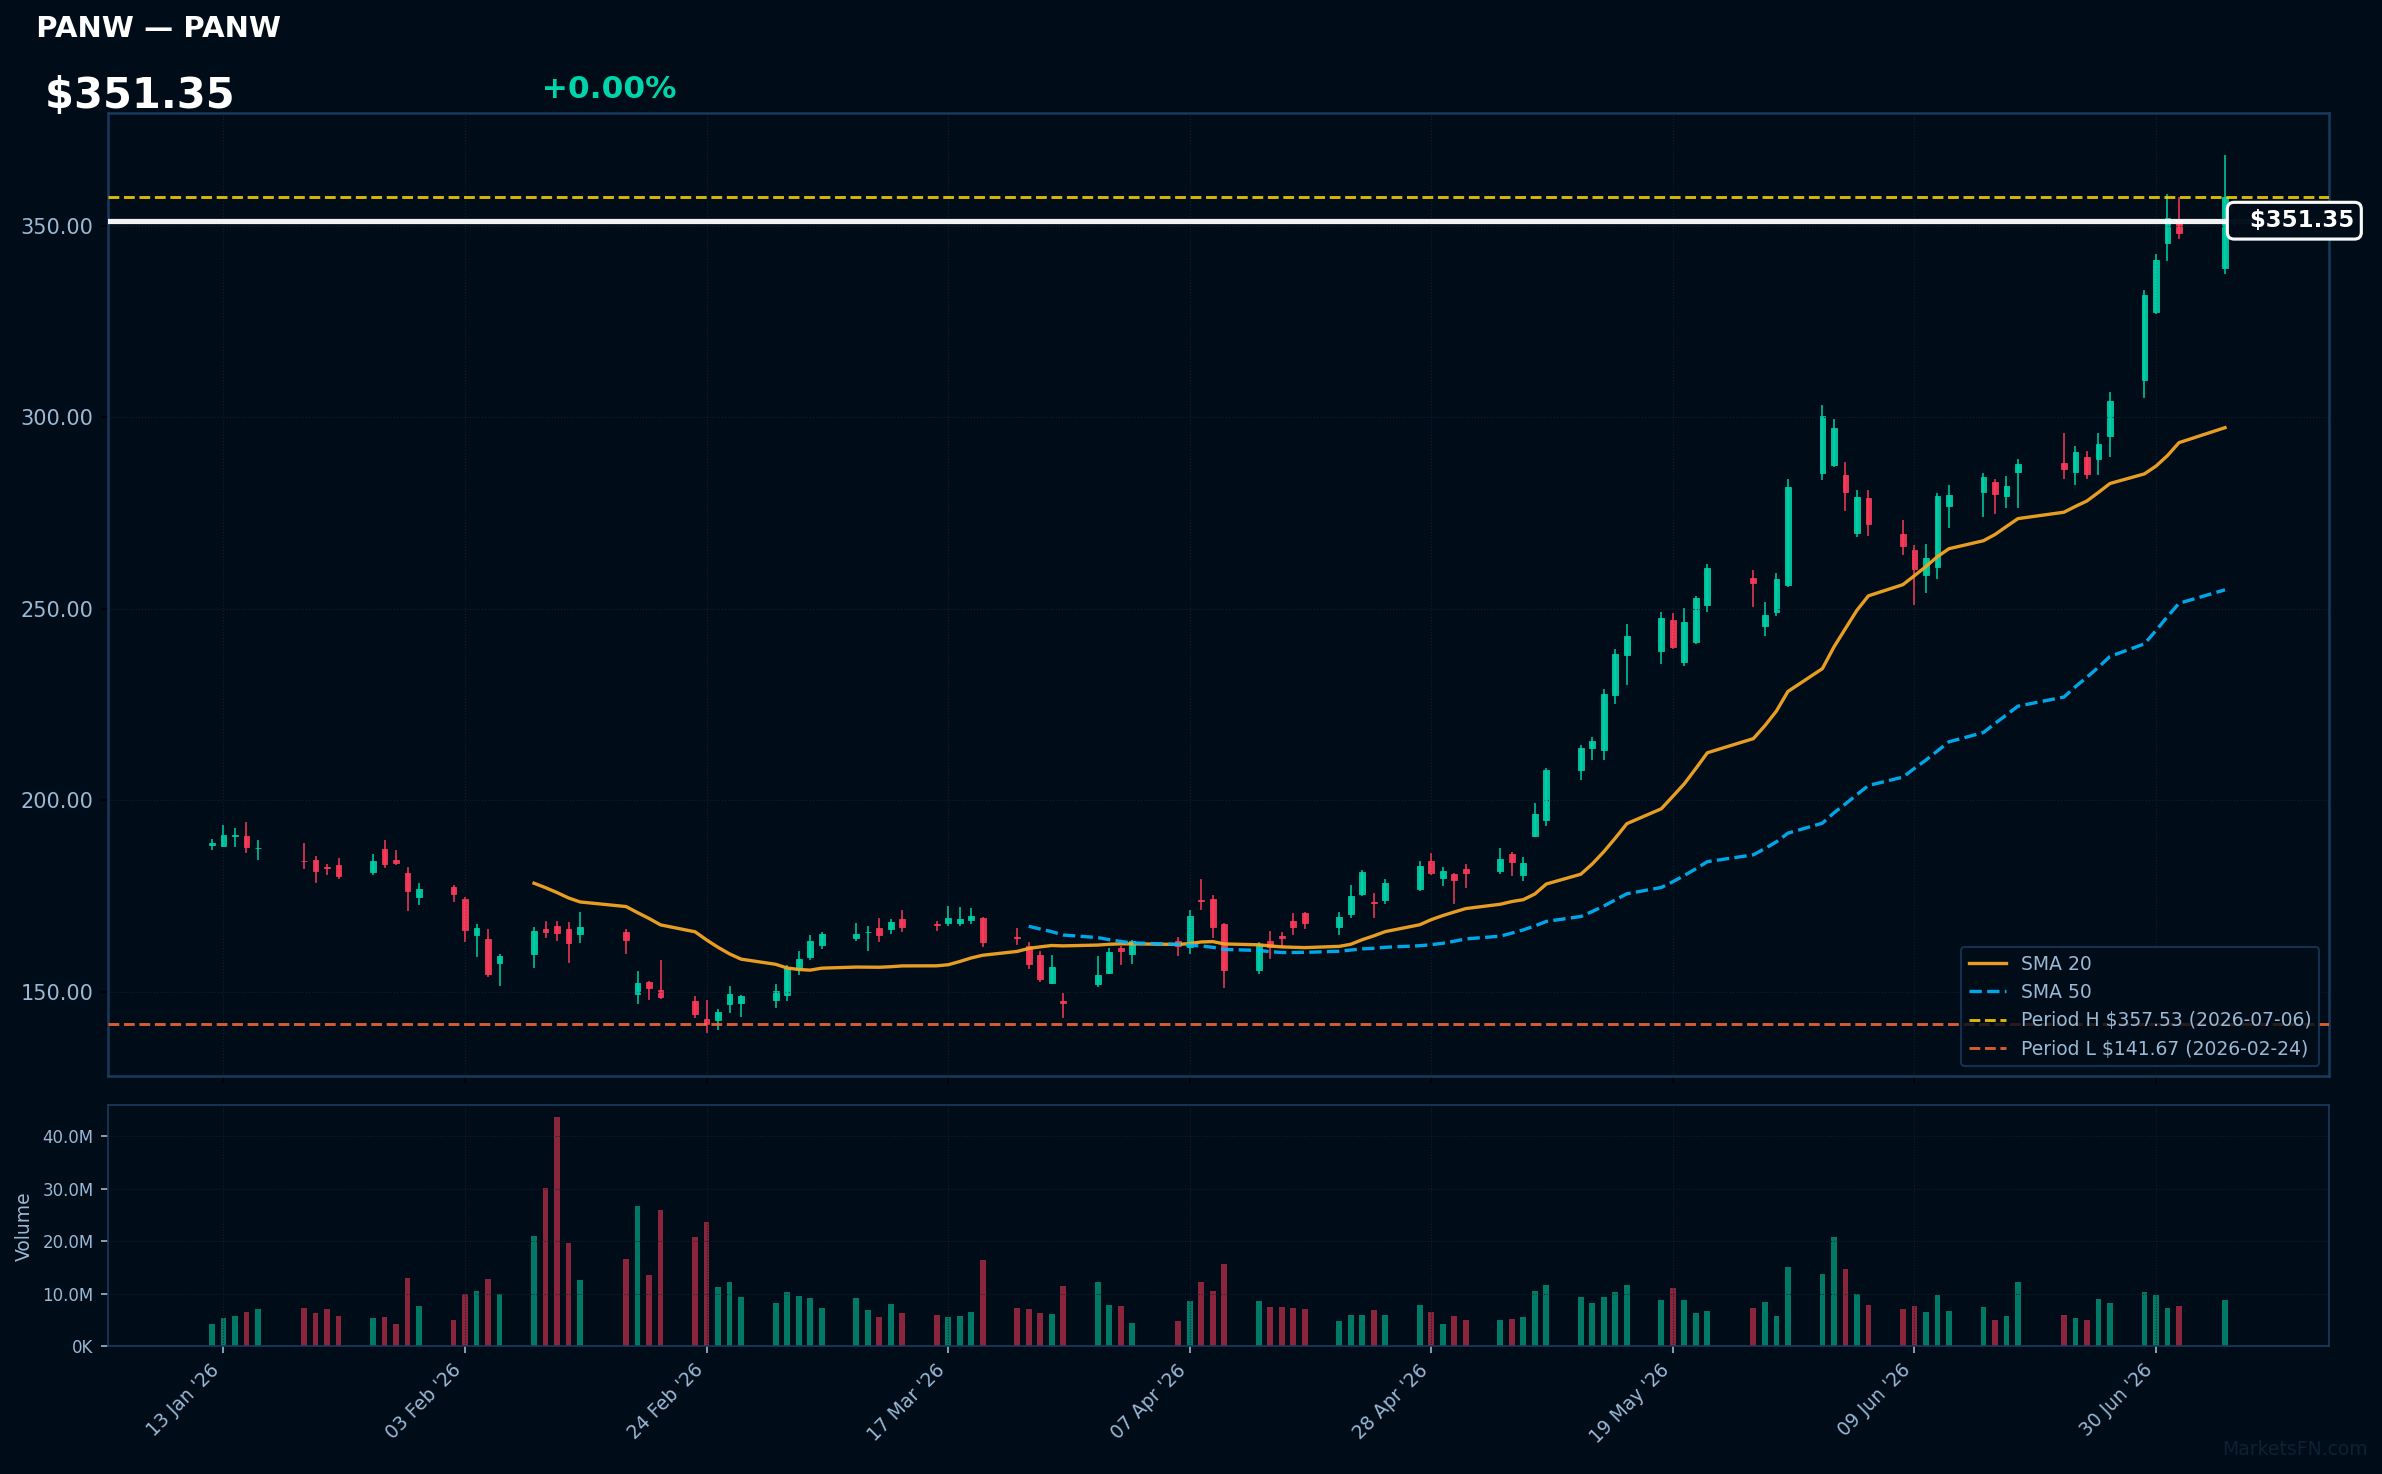
PANW | Palo Alto Networks Inc | Technology | Price Last: $357.53 | % Realized: +99.33% | RSI: 75.8 | % above MA200: +76.1% | Trend: Above MA20, MA50, MA200
Palo Alto Networks Inc is a cybersecurity company providing advanced threat prevention and security solutions. Investors should care because its innovative products and strong market position drive growth, making it a significant player in the expanding cybersecurity market.
Palo Alto Networks Inc is in a sustained uptrend with price ($351.35) above MA20 > MA50 > MA200. RSI(14) is 75.8, nearing overbought territory. The stock is 0.0% below its 2026 YTD high, indicating potential breakout level, with 99.3% return over the 2026 YTD period.
Related headlines
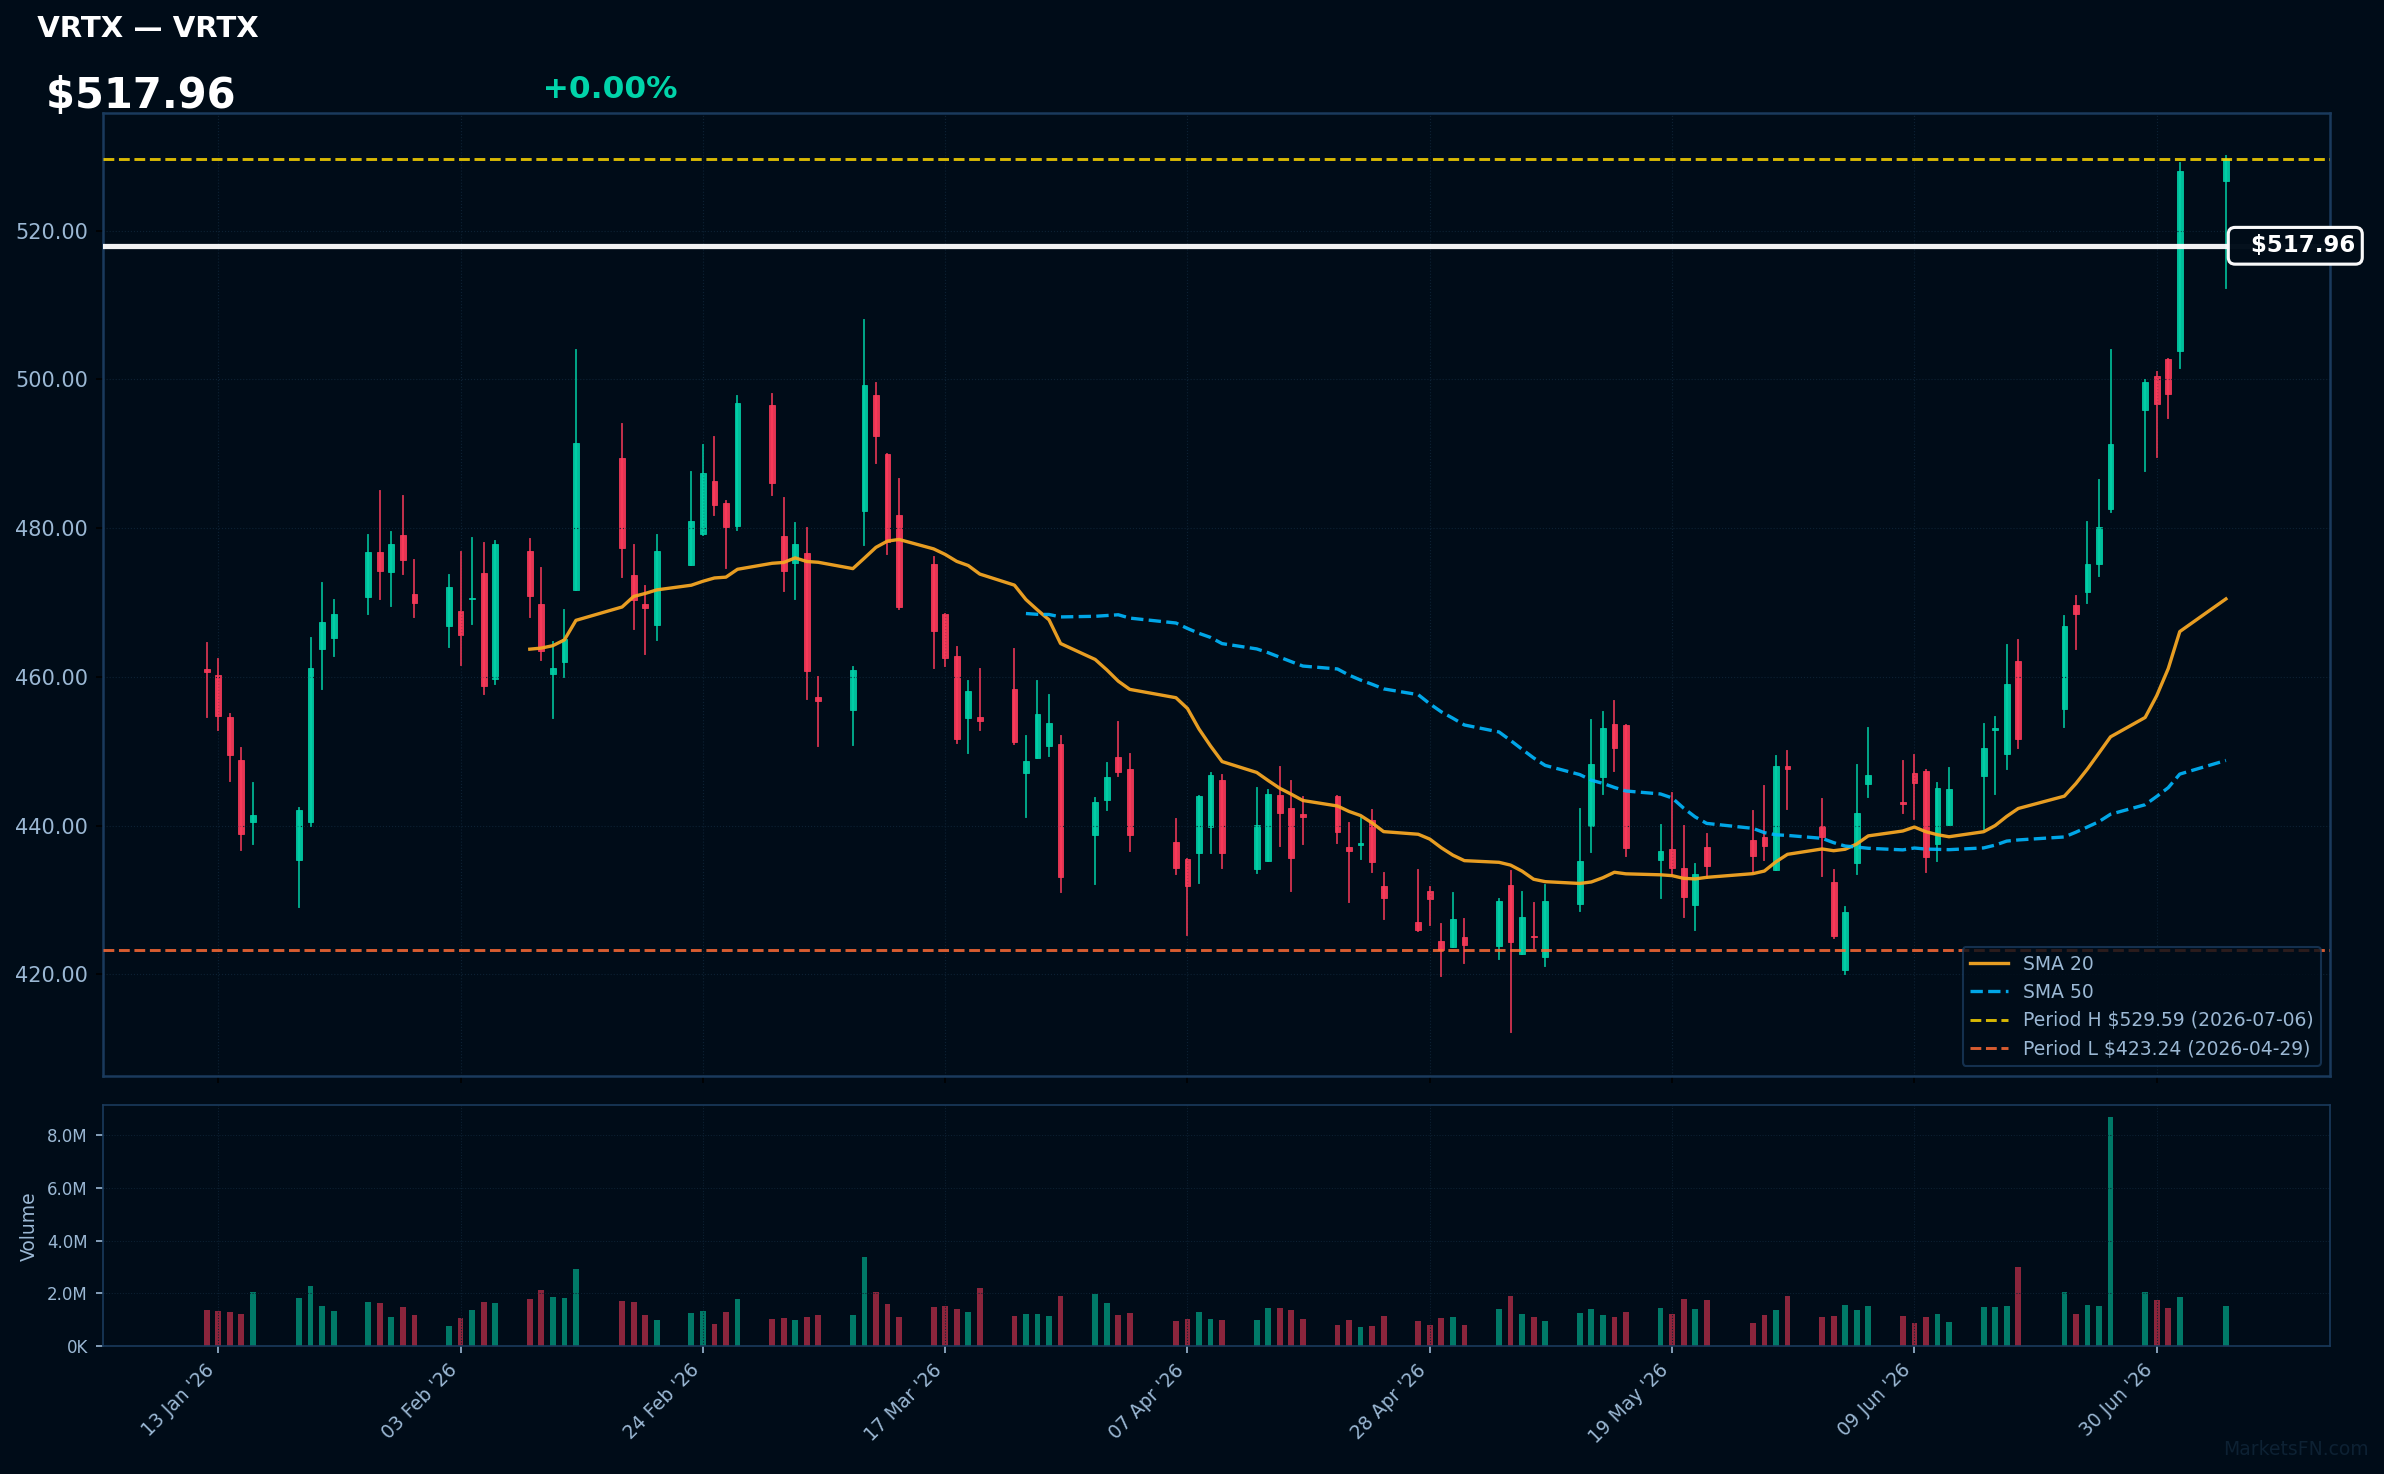
VRTX | Vertex Pharmaceuticals, Inc | Healthcare | Price Last: $529.59 | % Realized: +17.13% | RSI: 72.2 | % above MA200: +19.0% | Trend: Above MA20, MA50, MA200
Vertex Pharmaceuticals, Inc is a biotechnology company that develops and commercializes treatments for cystic fibrosis and other serious diseases. Investors should care because its cystic fibrosis treatments have shown significant market success and the company continues to expand its pipeline.
Vertex Pharmaceuticals shows strong technical momentum with an RSI(14) of 72.2 and a bullish MA alignment (price > MA20 > MA50 > MA200). The stock is 0.0% below its 2026 YTD high, indicating potential for a breakout.
Related headlines
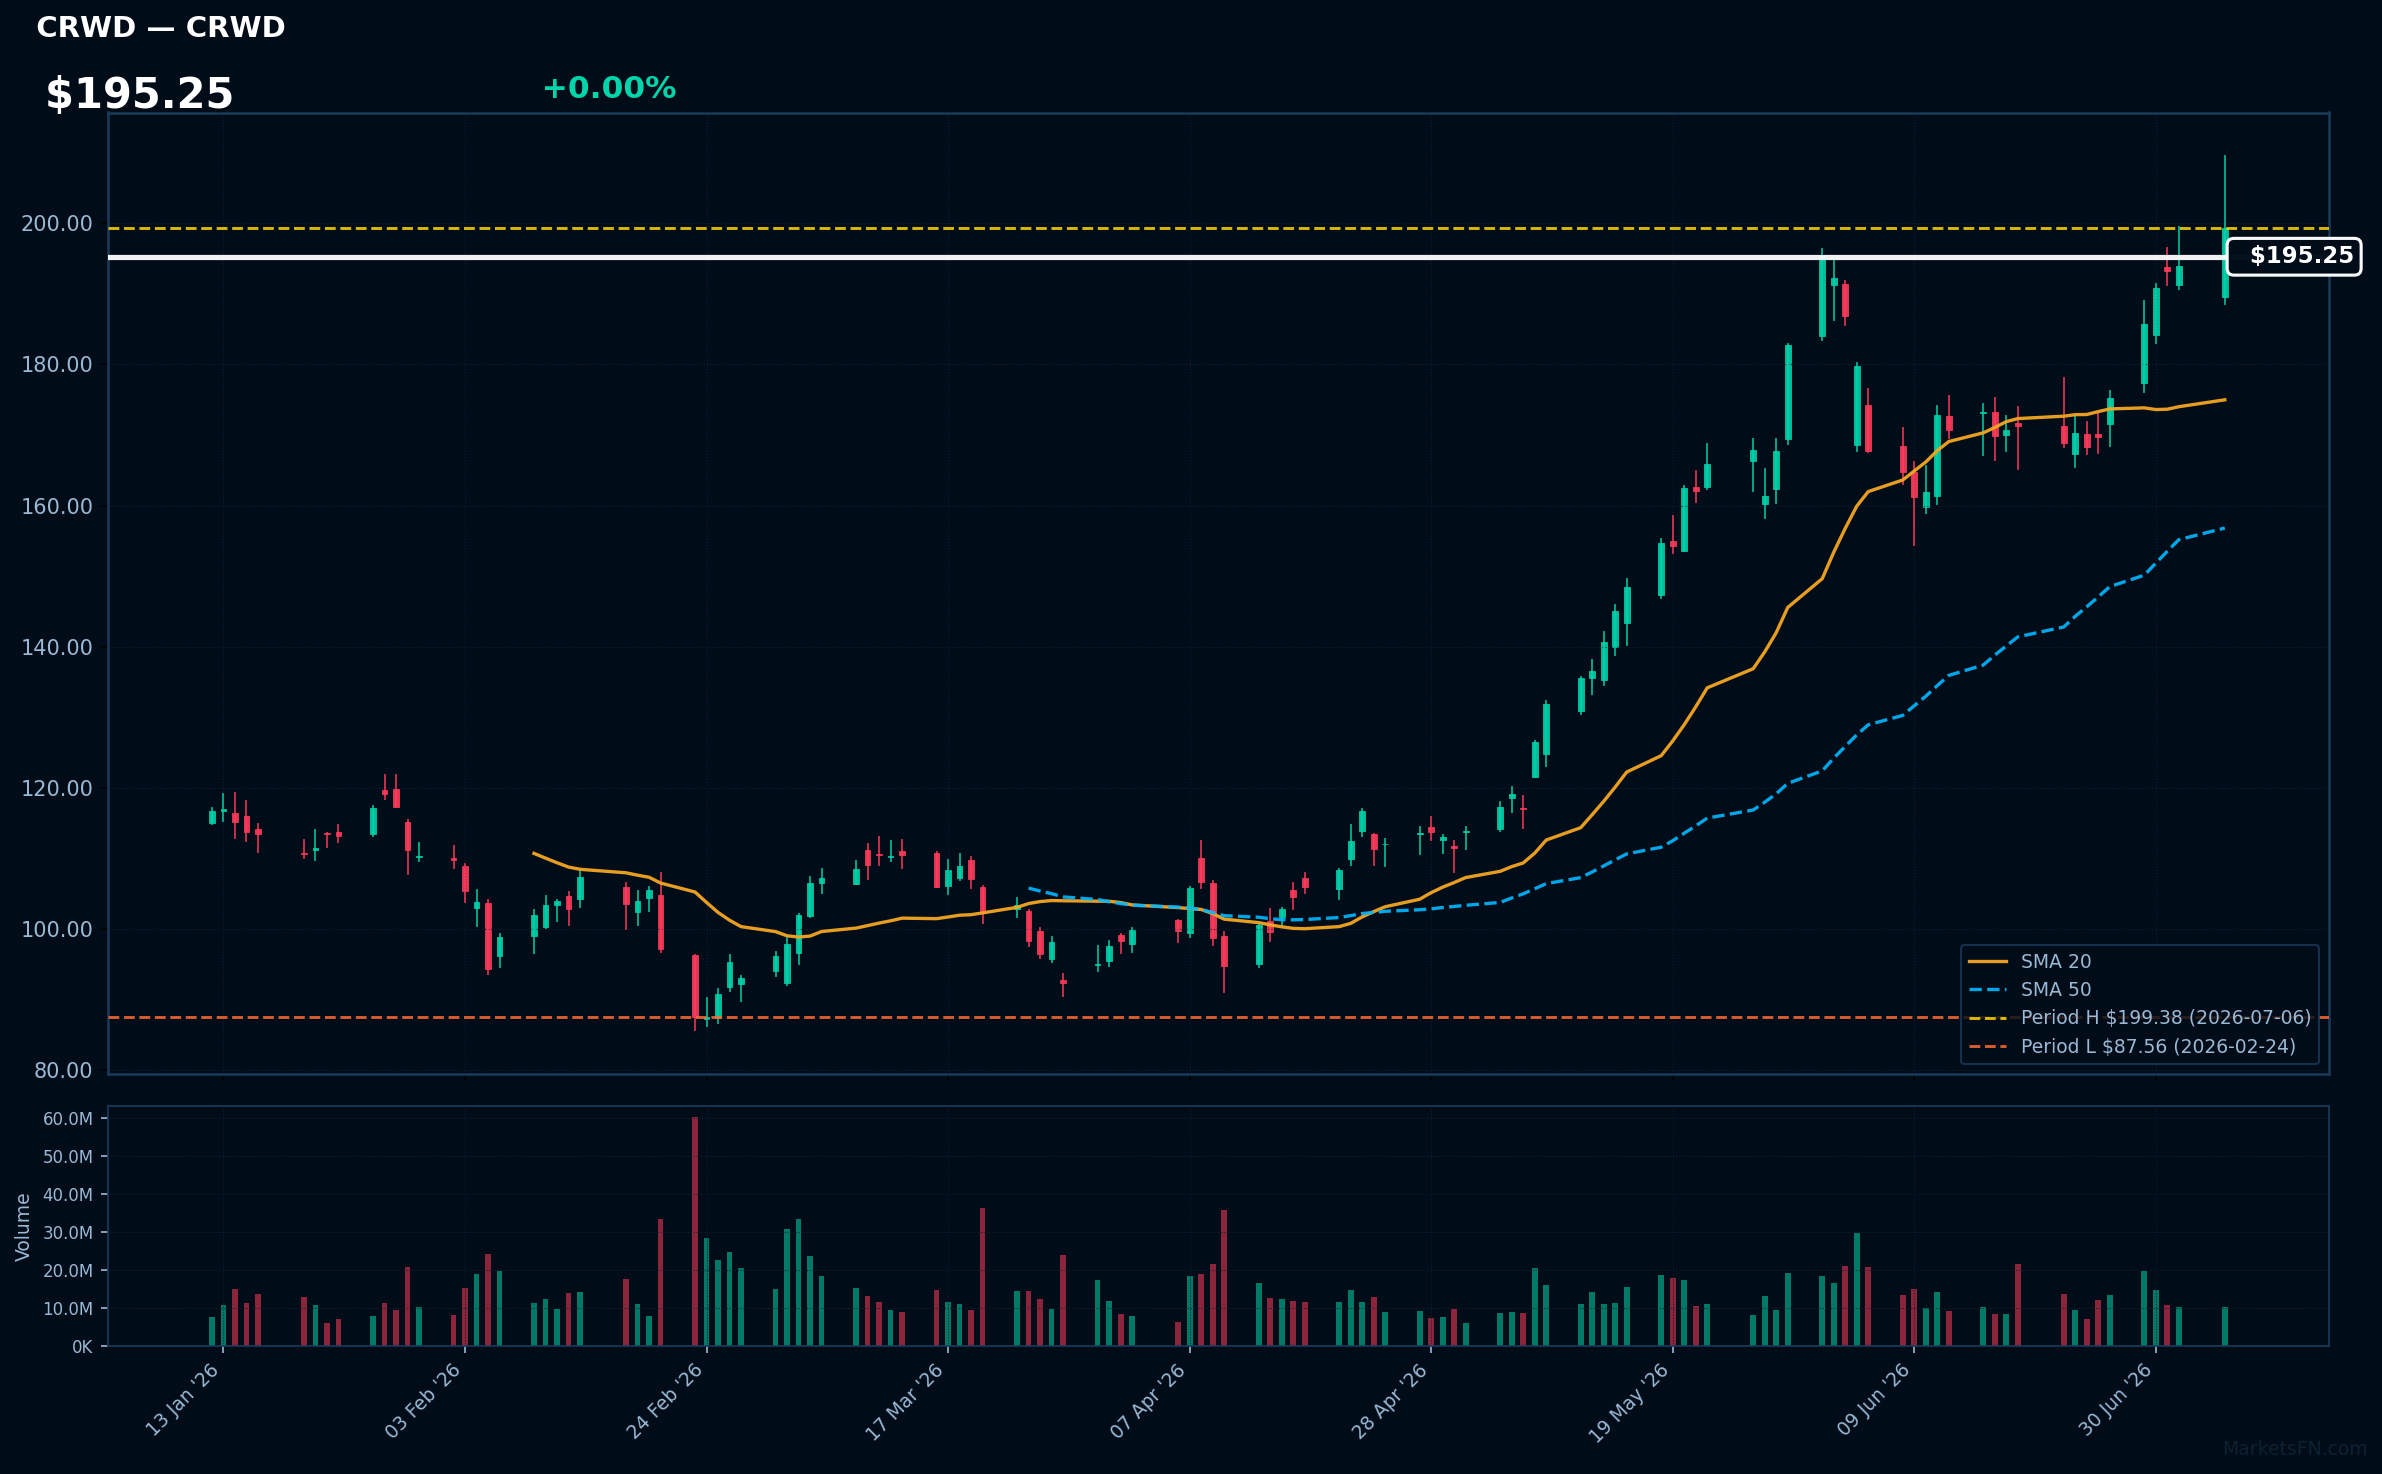
CRWD | Crowdstrike Holdings Inc | Technology | Price Last: $199.38 | % Realized: +75.83% | RSI: 69.2 | % above MA200: +57.6% | Trend: Above MA20, MA50, MA200
Crowdstrike Holdings Inc provides cloud-delivered endpoint security solutions, protecting endpoints from cyber threats. Investors should care as the company's technology is crucial for organizations to prevent cyberattacks, making its growth prospects tied to the increasing demand for cybersecurity.
Crowdstrike's technicals indicate momentum: RSI(14) is 69.2, nearing overbought territory. The MA alignment is bullish with price > MA20 > MA50 > MA200, and the stock is 0.0% below its 2026 YTD high, suggesting a potential breakout.
Related headlines
- What CrowdStrike Stock Was Telling You Before Its AI-Fueled Surge
- NAVN, JNJ, CRWD Stocks Hit 52-Week Highs Last Week: What's Driving The Surge?
- CrowdStrike Named Frost & Sullivan's 2026 Global Enabling Technology Leader in Zero Trust Browser Security
- Chinese AI Is Closing in on U.S. Rivals. That's Good News for CrowdStrike and These 3 Stocks.
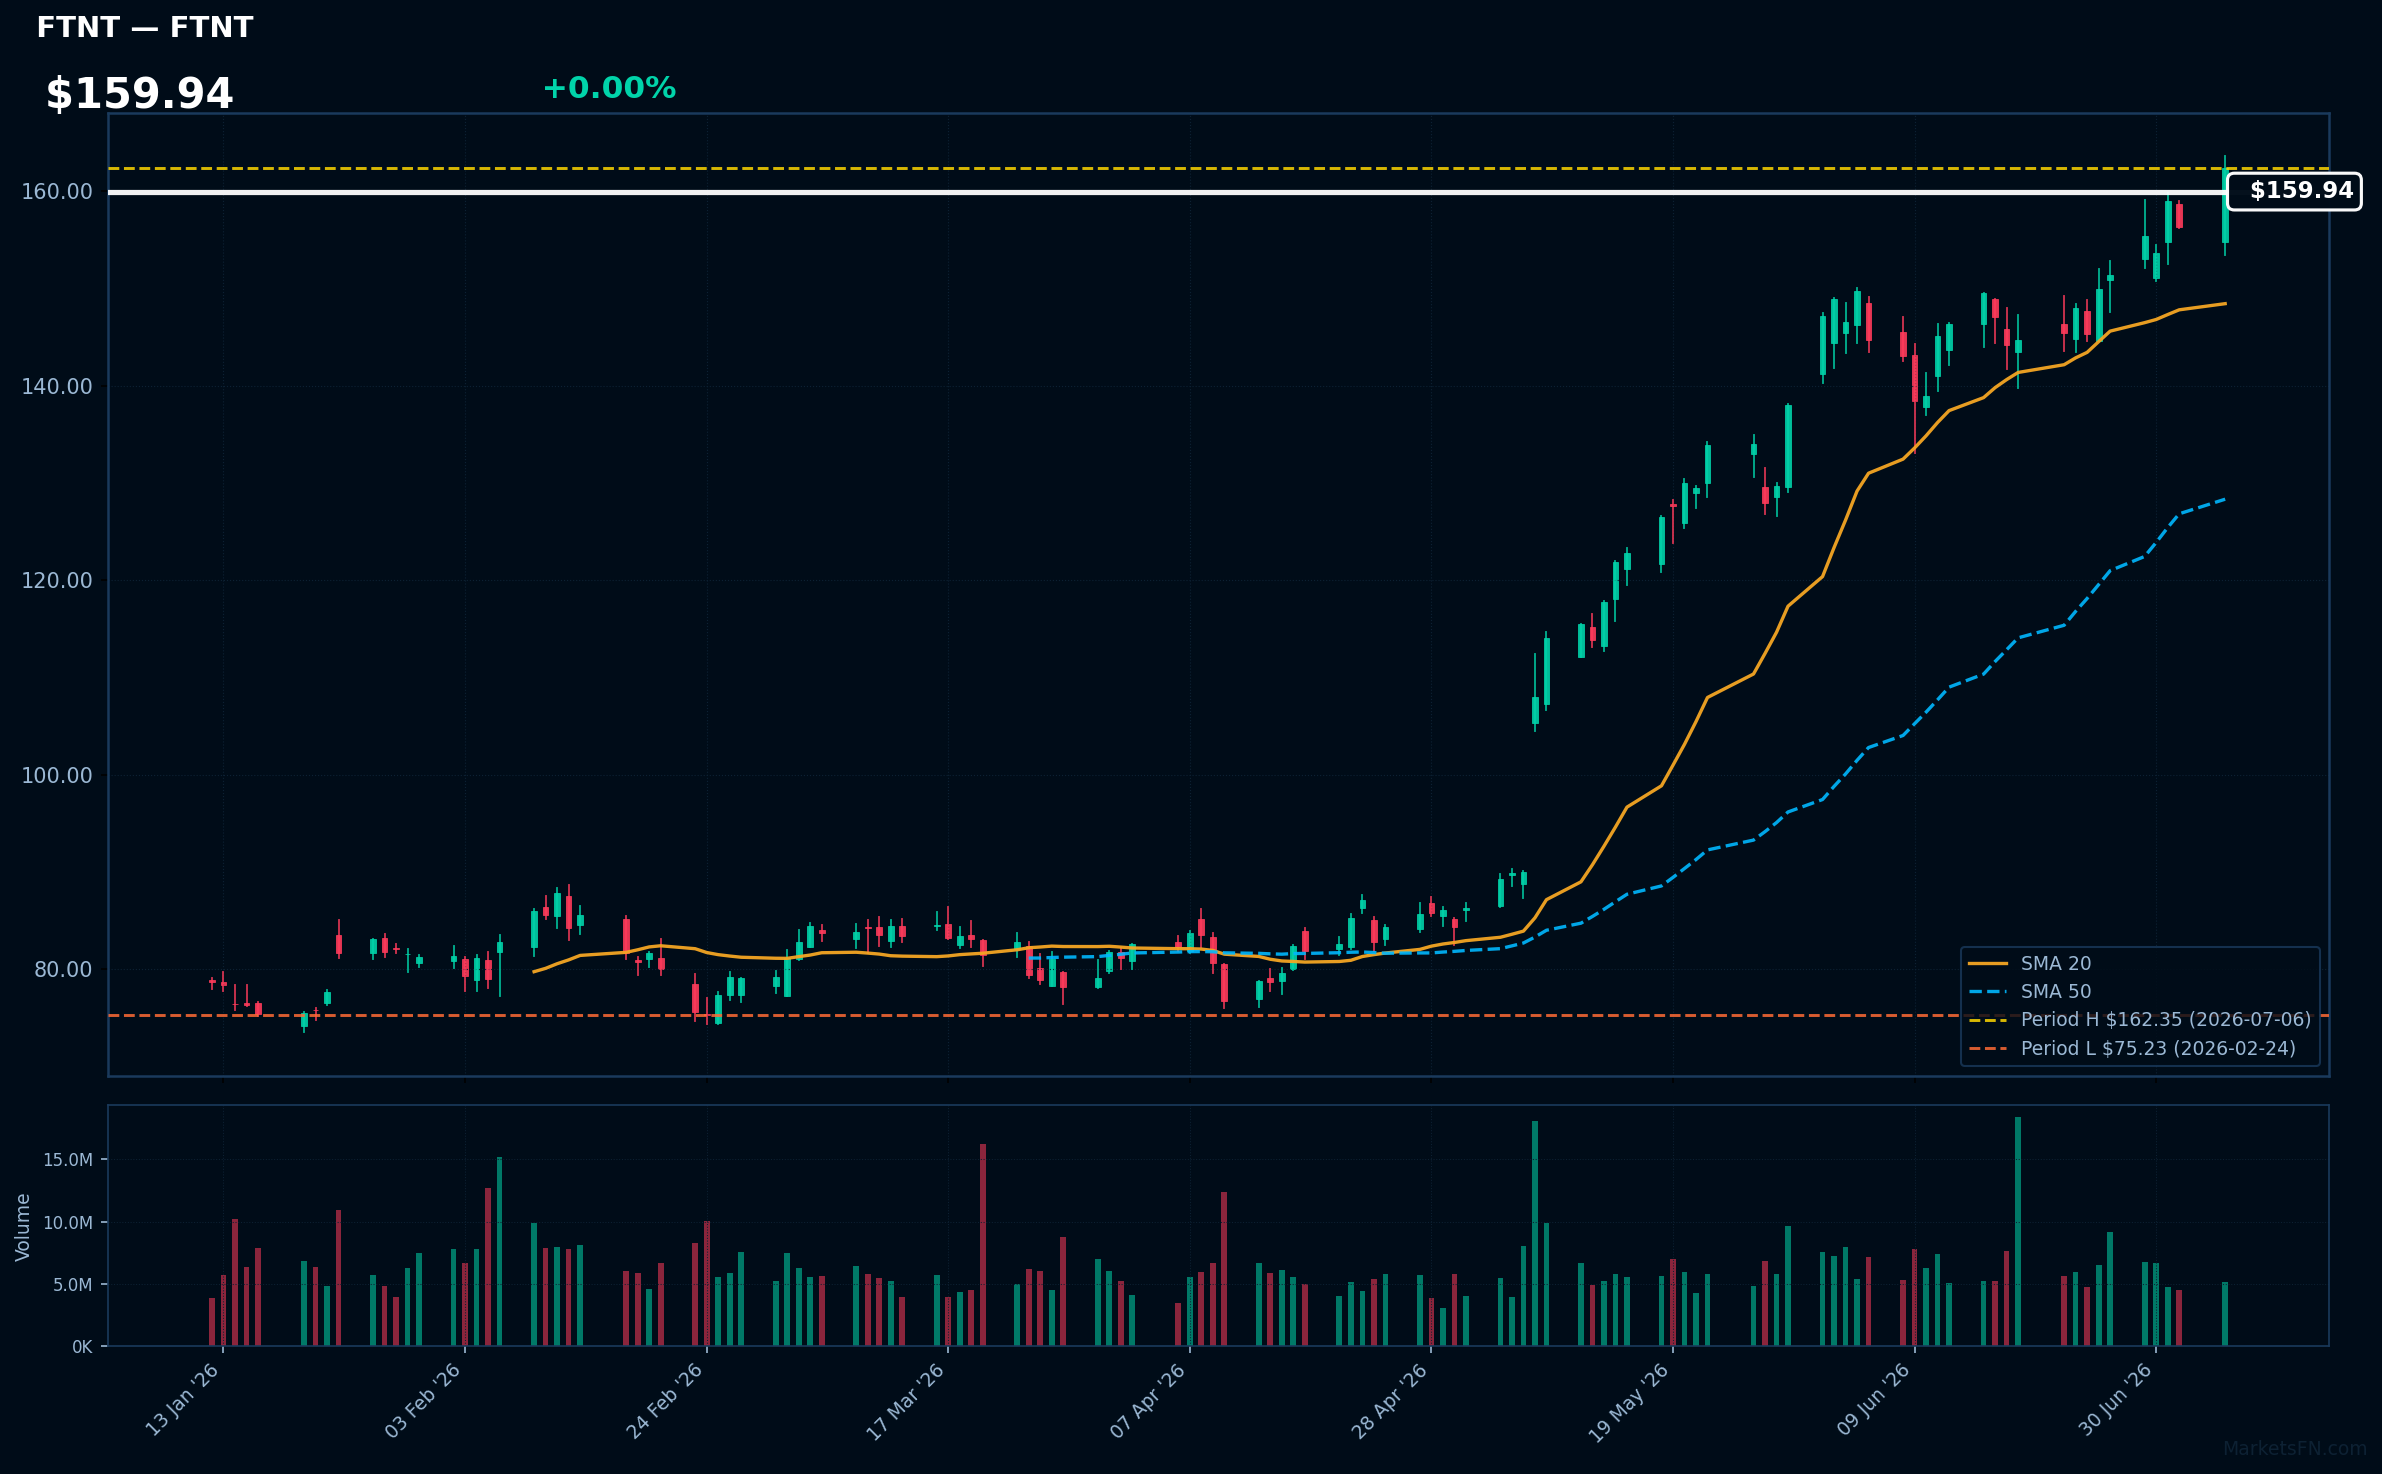
FTNT | Fortinet Inc | Technology | Price Last: $162.35 | % Realized: +108.46% | RSI: 67.6 | % above MA200: +72.8% | Trend: Above MA20, MA50, MA200
Fortinet Inc is a cybersecurity company providing security solutions such as firewalls and intrusion detection/prevention systems. Investors should care because its products protect networks from cyber threats, a growing concern for businesses and organizations.
Fortinet Inc is in a sustained uptrend with price > MA20 > MA50 > MA200, RSI(14) at 67.6, and is 0.0% below its 2026 YTD high, indicating strong momentum with no immediate signs of overbought conditions or reversal.
Related headlines
- Fortinet to Announce Second Quarter 2026 Financial Results
- Dow Jones Medical Giant J&J Breaks Out; PNC, Iron Mountain, Fortinet In Or Near Buy Zones
- Fortinet, IBD Stock Of The Day, Gets Network Firewall Boost From AI Data Centers
- Fortinet Appoints Public Sector Leader and Tech Executive Derek Kan to Its Board of Directors
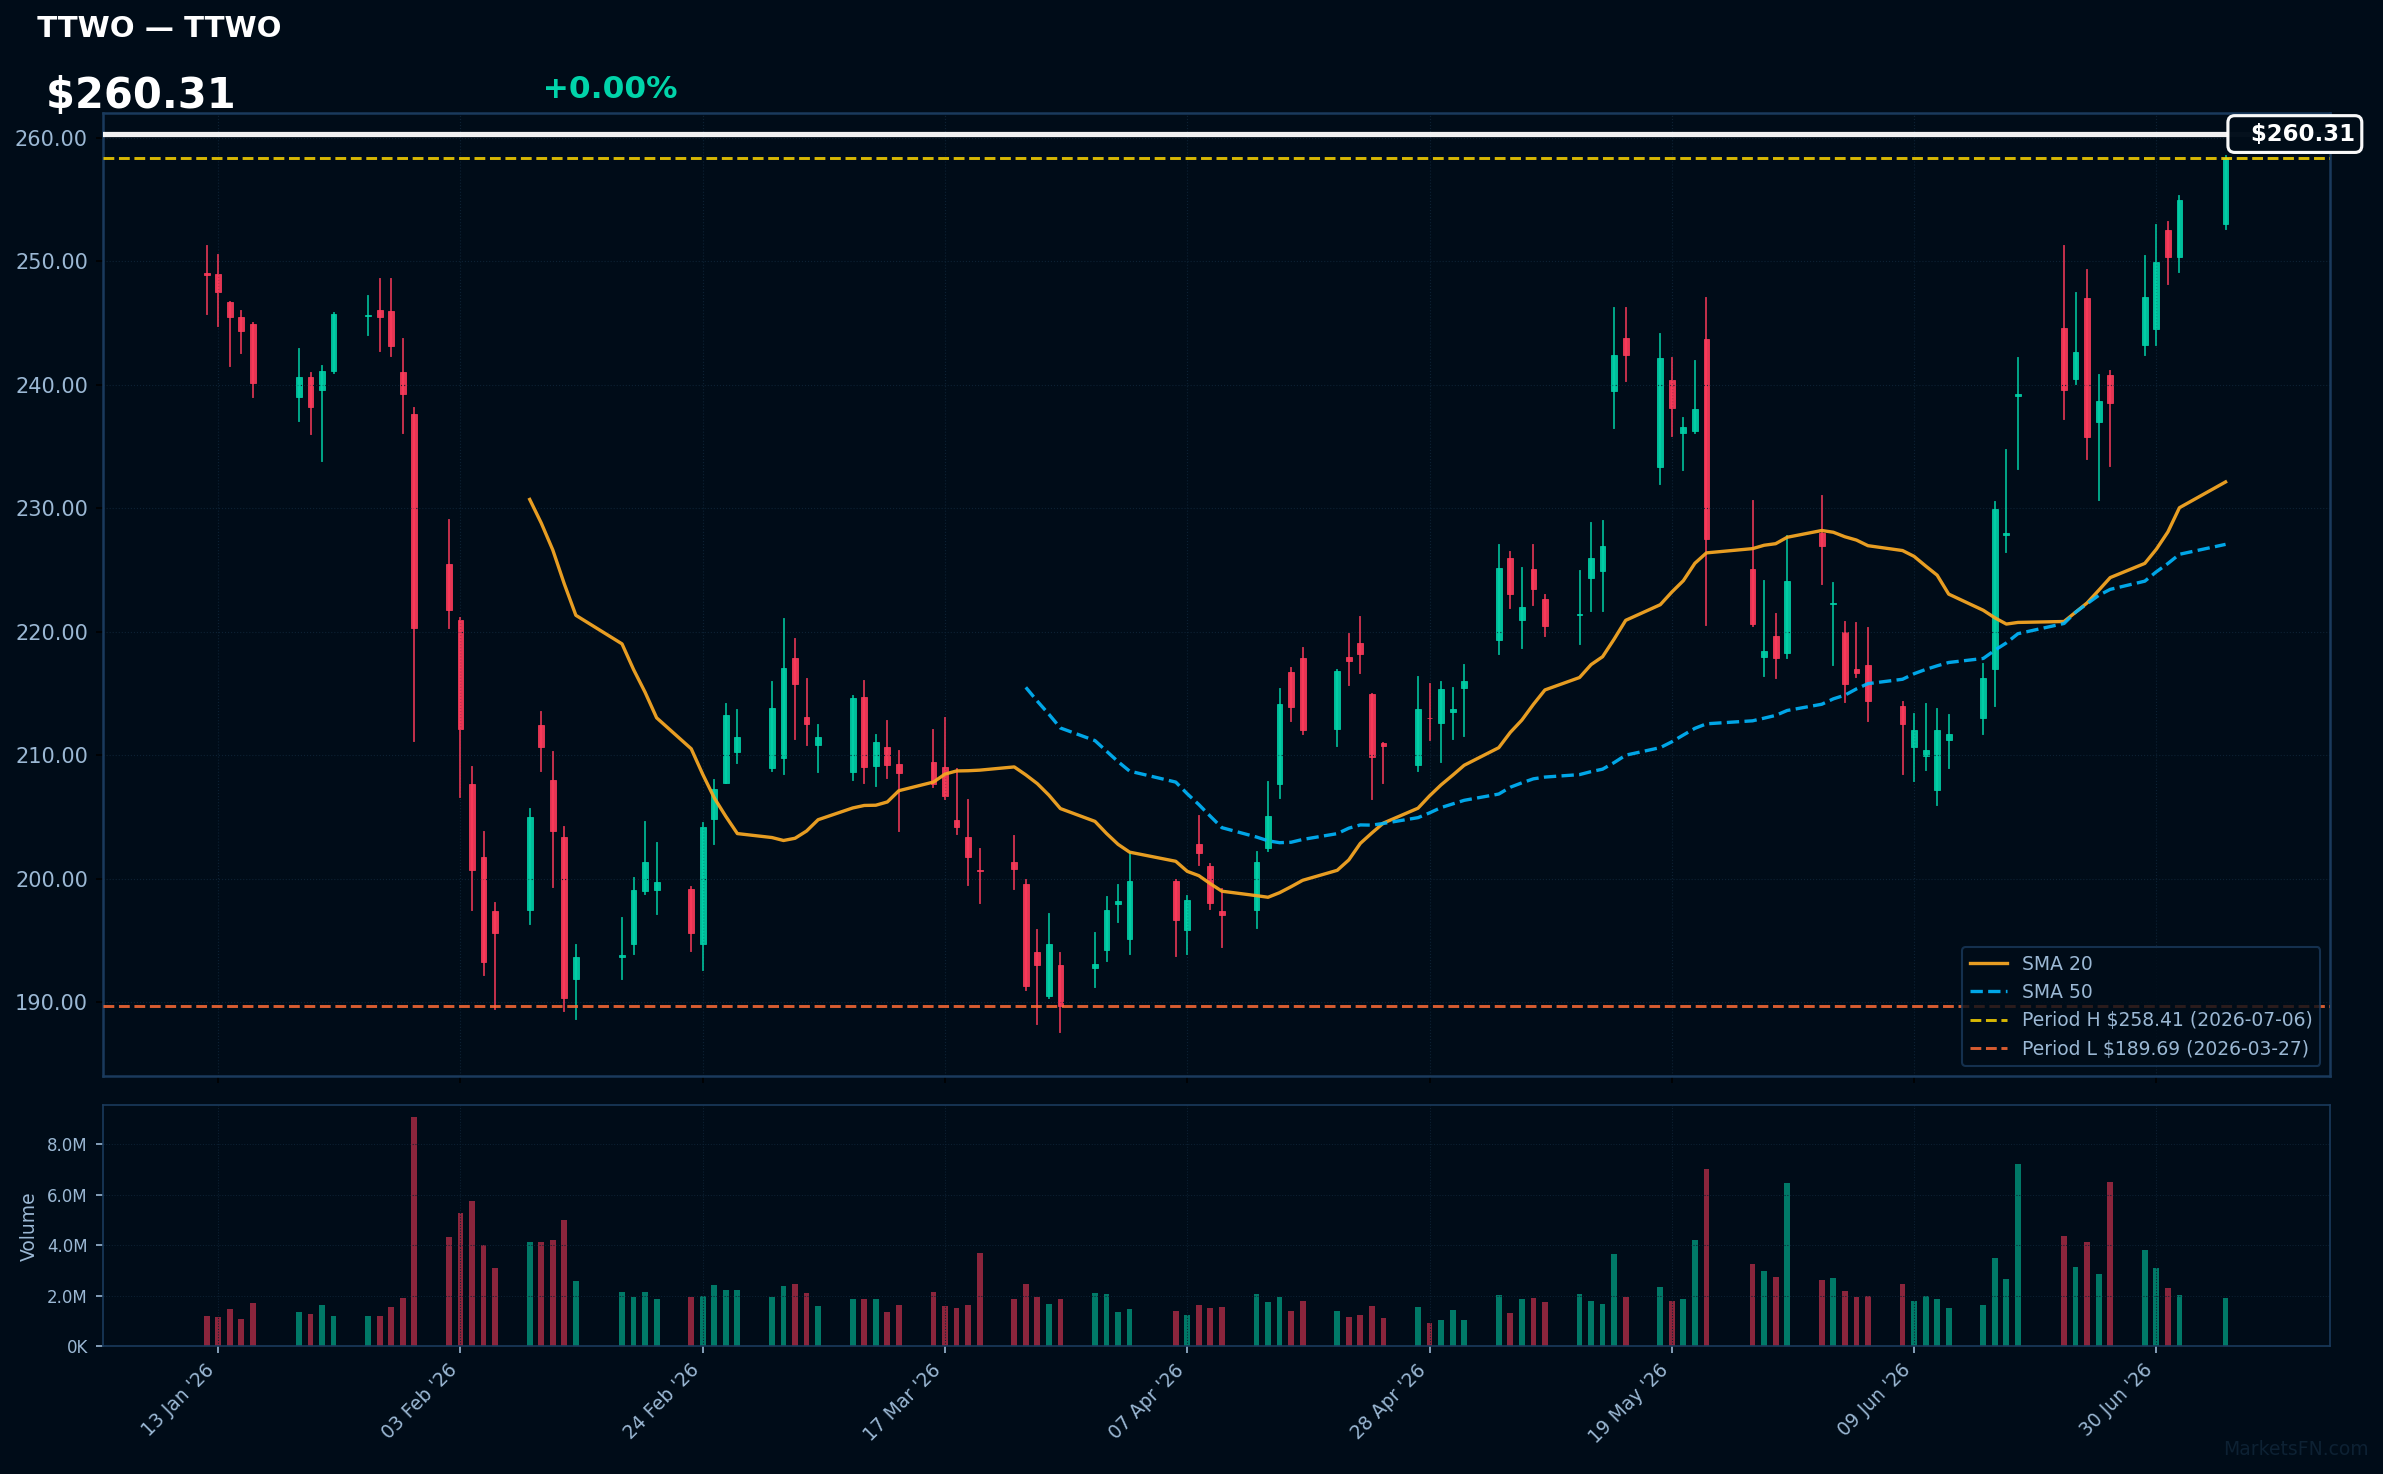
TTWO | Take-Two Interactive Software, Inc | Communication Services | Price Last: $258.41 | % Realized: +2.71% | RSI: 75.3 | % above MA200: +11.9% | Trend: Above MA20, MA50, MA200
Take-Two Interactive Software, Inc is a leading video game publisher behind popular titles such as Grand Theft Auto and Red Dead Redemption. Investors should care due to its significant market presence and potential for growth in the gaming industry.
The stock's RSI(14) is 75.3, indicating strong momentum as it is above MA20, MA50, and MA200. Currently, it is 0.0% below its 2026 YTD high, suggesting a potential breakout.
Related headlines
- Gonna buy Take-Two shares before the GTA 6 release? Here's how blockbuster game launches actually move stocks
- Viral post says GTA 6 cost as much to build as the $1.5B+ Burj Khalifa analysts say Take-Two could recoup that in days
- GTA 6 Pre-Orders Send Take-Two Stock Down as Price and Launch Details Disappoint
- TTWO Stock Climbs After GTA 6 Preorders Go Live Retail Fans Debate Discless Physical Edition
📉 Nearest to 2026 Low
Sectors represented: Consumer Cyclical (1), Communication Services (1), Real Estate (1), Utilities (1), Industrials (1)
| Ticker | Company | Sector | Price Last | % Realized | 2026 YTD Low Date | RSI | % above MA200 | Trend |
|---|---|---|---|---|---|---|---|---|
| ORLY | O'Reilly Automotive, Inc | Consumer Cyclical | $84.24 | -6.75% | 2026-07-06 | 40.2 | -11.0% | Below MA20, MA50, MA200 |
| WBD | Warner Bros. Discovery Inc | Communication Services | $26.12 | -8.38% | 2026-07-06 | 44.8 | +1.2% | Above MA200 · Below MA20, MA50 |
| CSGP | Costar Group, Inc | Real Estate | $28.70 | -56.31% | 2026-06-30 | 44.1 | -46.5% | Below MA20, MA50, MA200 |
| CEG | Constellation Energy Corporation | Utilities | $245.87 | -32.87% | 2026-07-01 | 38.8 | -22.2% | Below MA20, MA50, MA200 |
| CPRT | Copart, Inc | Industrials | $29.24 | -22.58% | 2026-06-29 | 43.3 | -21.7% | Below MA20, MA50, MA200 |
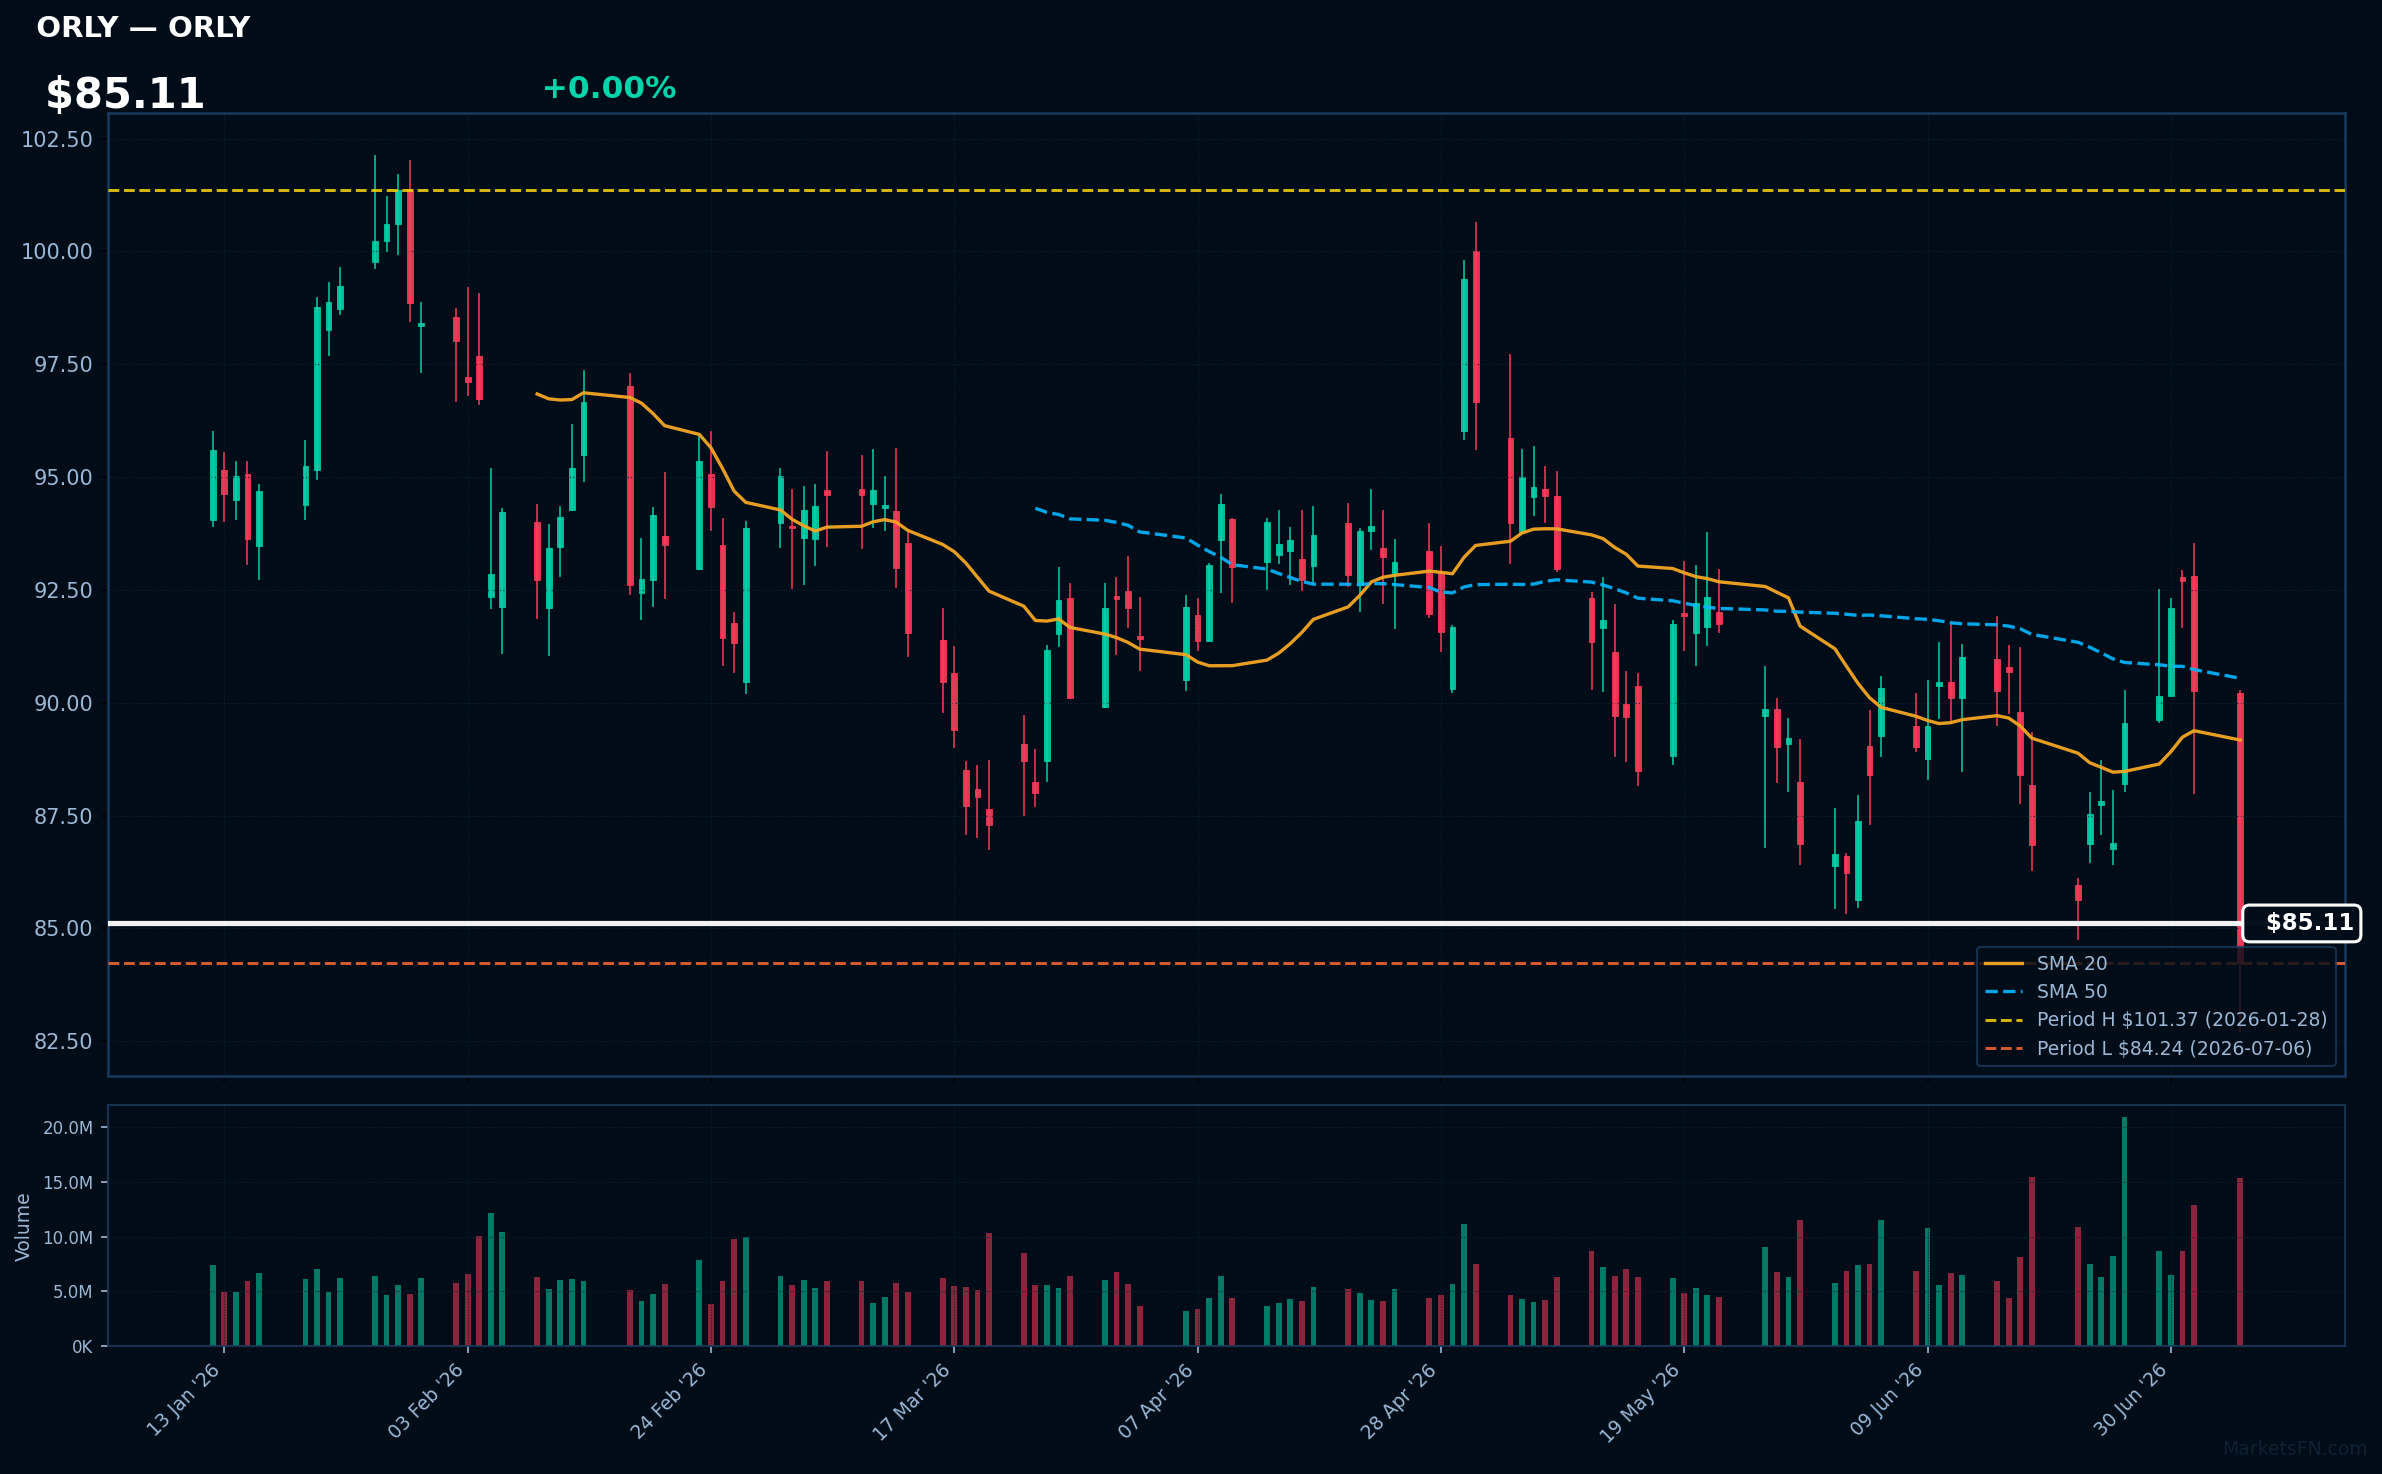
ORLY | O'Reilly Automotive, Inc | Consumer Cyclical | Price Last: $84.24 | % Realized: -6.75% | RSI: 40.2 | % above MA200: -11.0% | Trend: Below MA20, MA50, MA200
O'Reilly Automotive, Inc (ORLY) operates a retail chain selling automotive aftermarket parts, tools, and supplies. Investors should care due to its significant market presence and potential for steady demand, making it a key player in the auto parts retail sector.
ORLY's technical situation is bearish, with an RSI(14) of 40.2 indicating weakening momentum. The MA alignment (price $85.11 < MA20 < MA50 < MA200) confirms a sustained downtrend. The stock is at its 2026 YTD low, returning -6.8% YTD, signaling a potential warning sign.
Related headlines
- Why Did REE, HTZ, ORLY Stocks Slump To 52-Week Lows Today?
- O'Reilly Stock Sinks on Report of Possible NAPA Bid
- GPC Stock Pops 13%, ORLY Falls 5% OReilly Makes Cash Bid For Genuine Parts $10B Auto Unit, Says Report
- O'Reilly Automotive, Inc. Announces Dates for Its Second Quarter 2026 Earnings Release and Conference Call
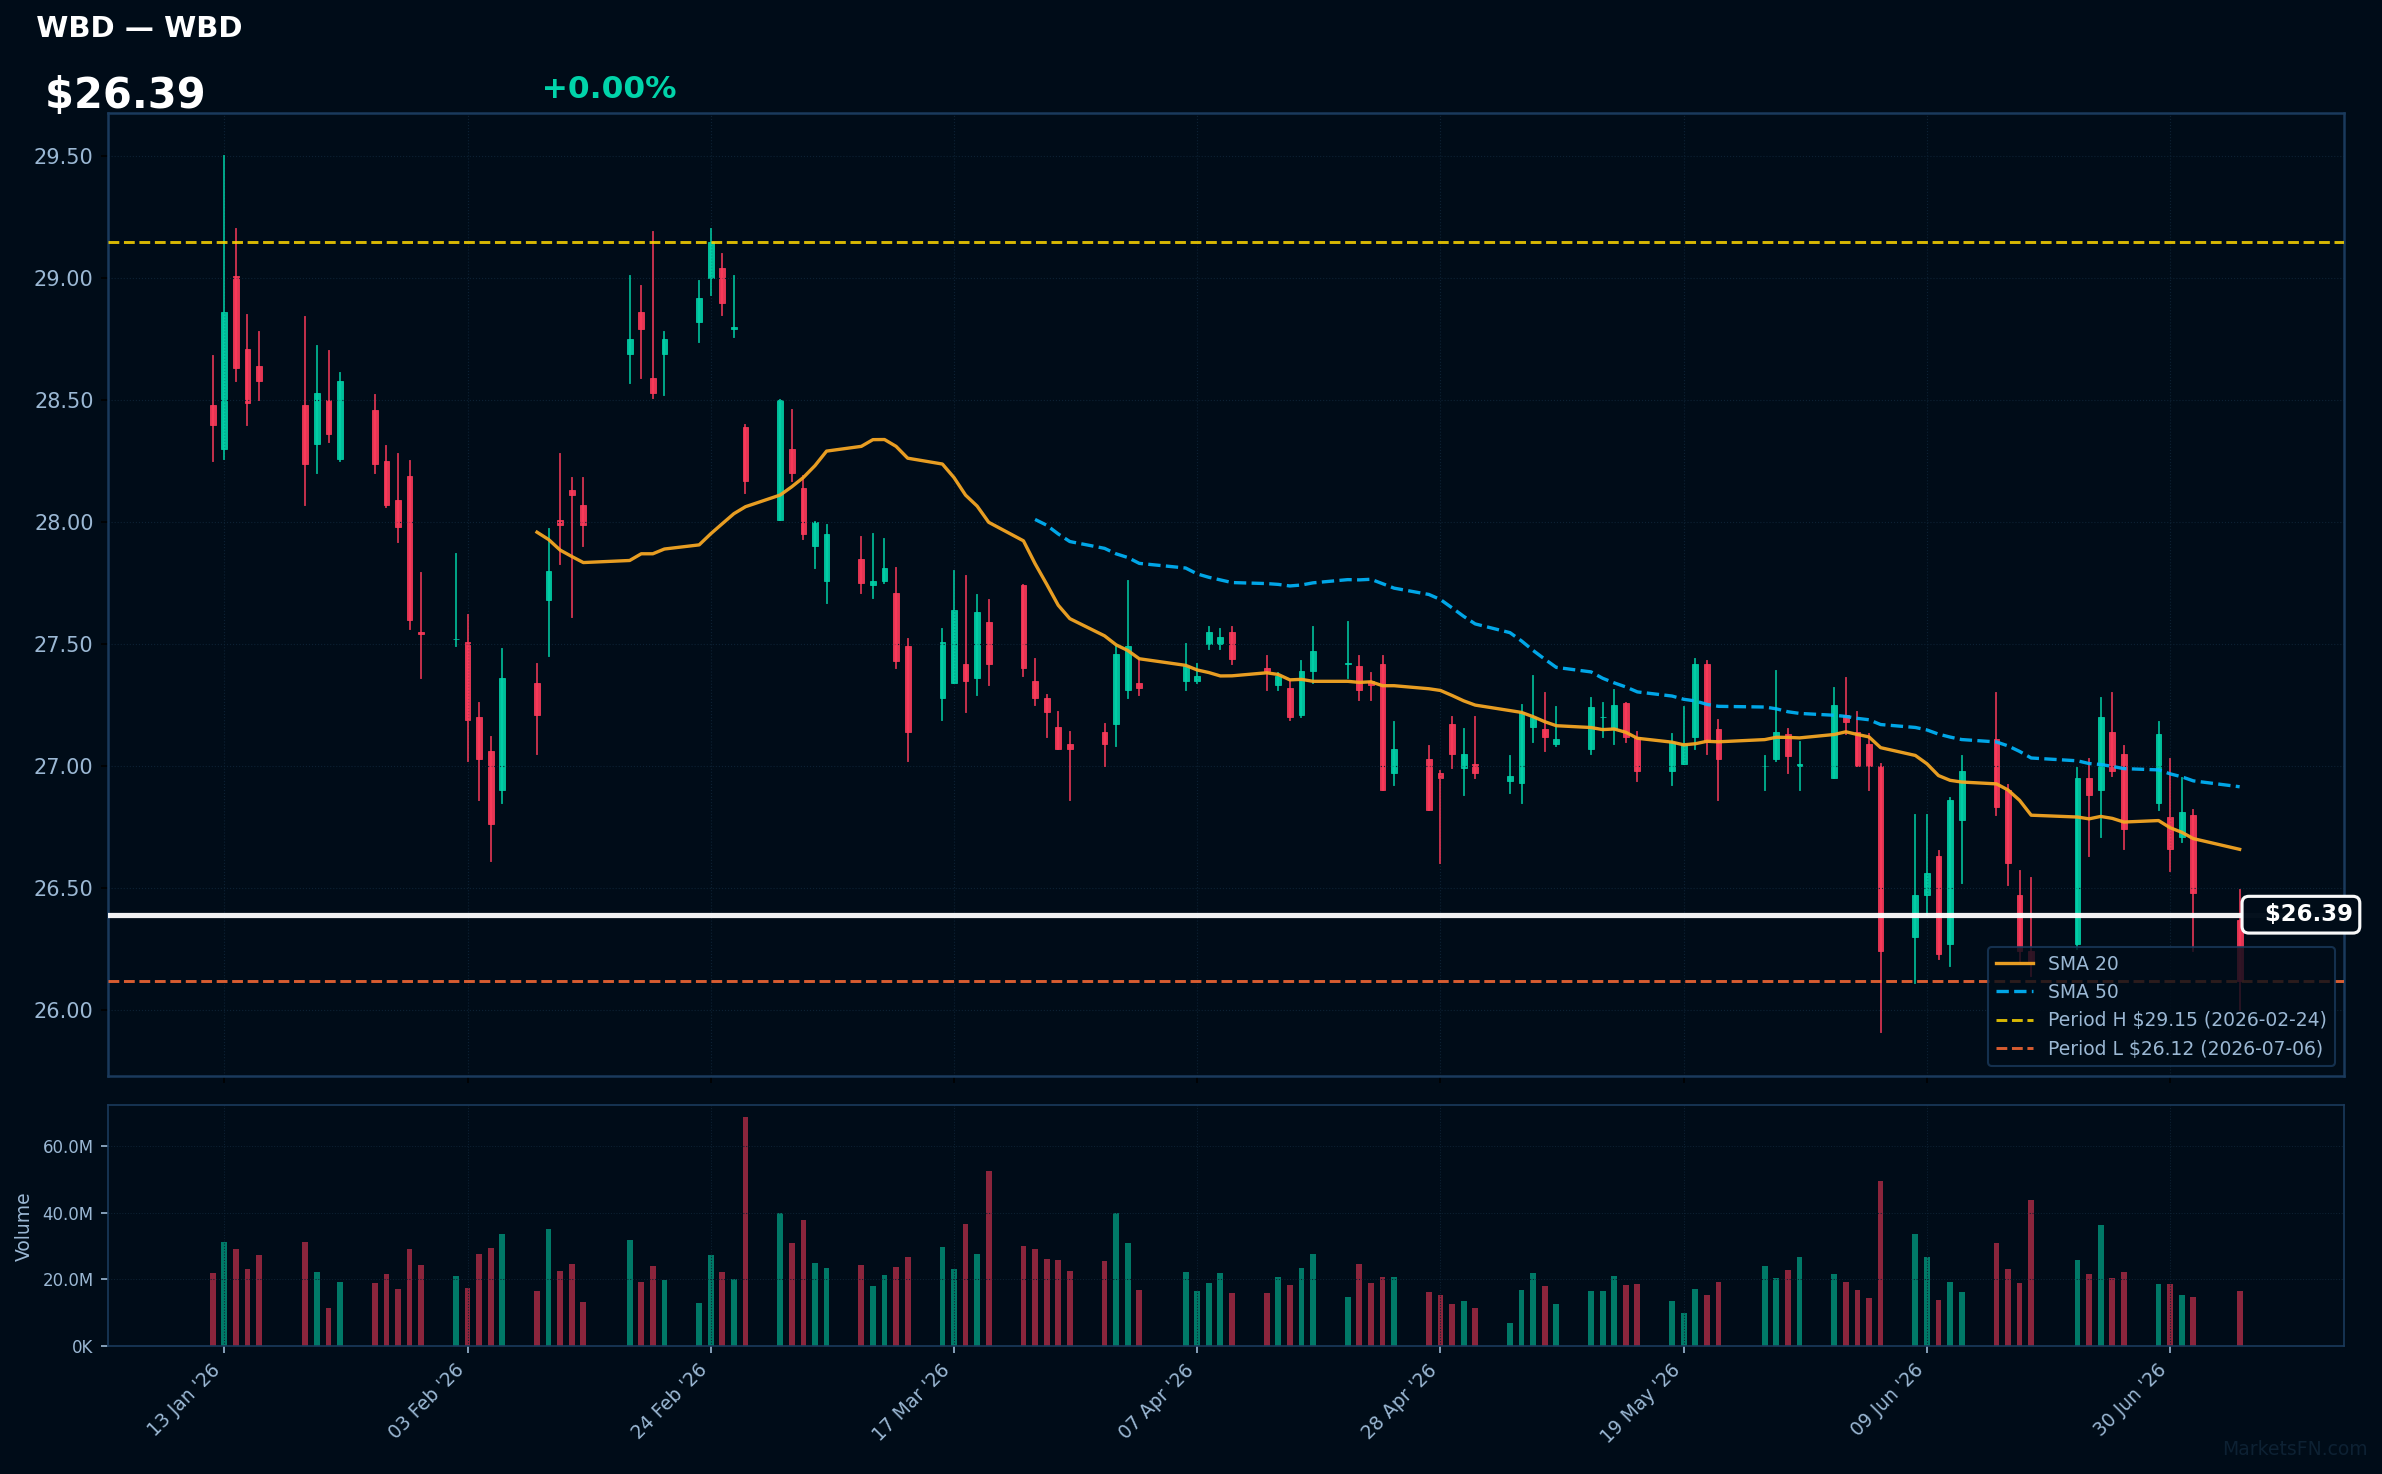
WBD | Warner Bros. Discovery Inc | Communication Services | Price Last: $26.12 | % Realized: -8.38% | RSI: 44.8 | % above MA200: +1.2% | Trend: Above MA200 · Below MA20, MA50
Warner Bros. Discovery Inc is a media conglomerate with a diverse portfolio of entertainment and news assets, including Warner Bros. film studio, HBO, and Discovery Channel, making it a significant player in content creation and distribution.
WBD's technicals indicate a warning sign: RSI(14) at 44.8 suggests neutral momentum, while price is below MA20/MA50 but above MA200, showing mixed signals; it's 0.0% above its 2026 YTD low, testing major support.
Related headlines
- Warner Bros. Slips on California Lawsuit Report
- Paramount's $110 Billion Warner Deal Nears EU Decision
- Paramount Skydance Offers Concessions to Facilitate EU Approval of $81 Billion Warner Bros Deal
- PSKY Stock Inches Higher Premarket: Paramount Reportedly Offers EU Concessions To Advance $110B Warner Bros Deal
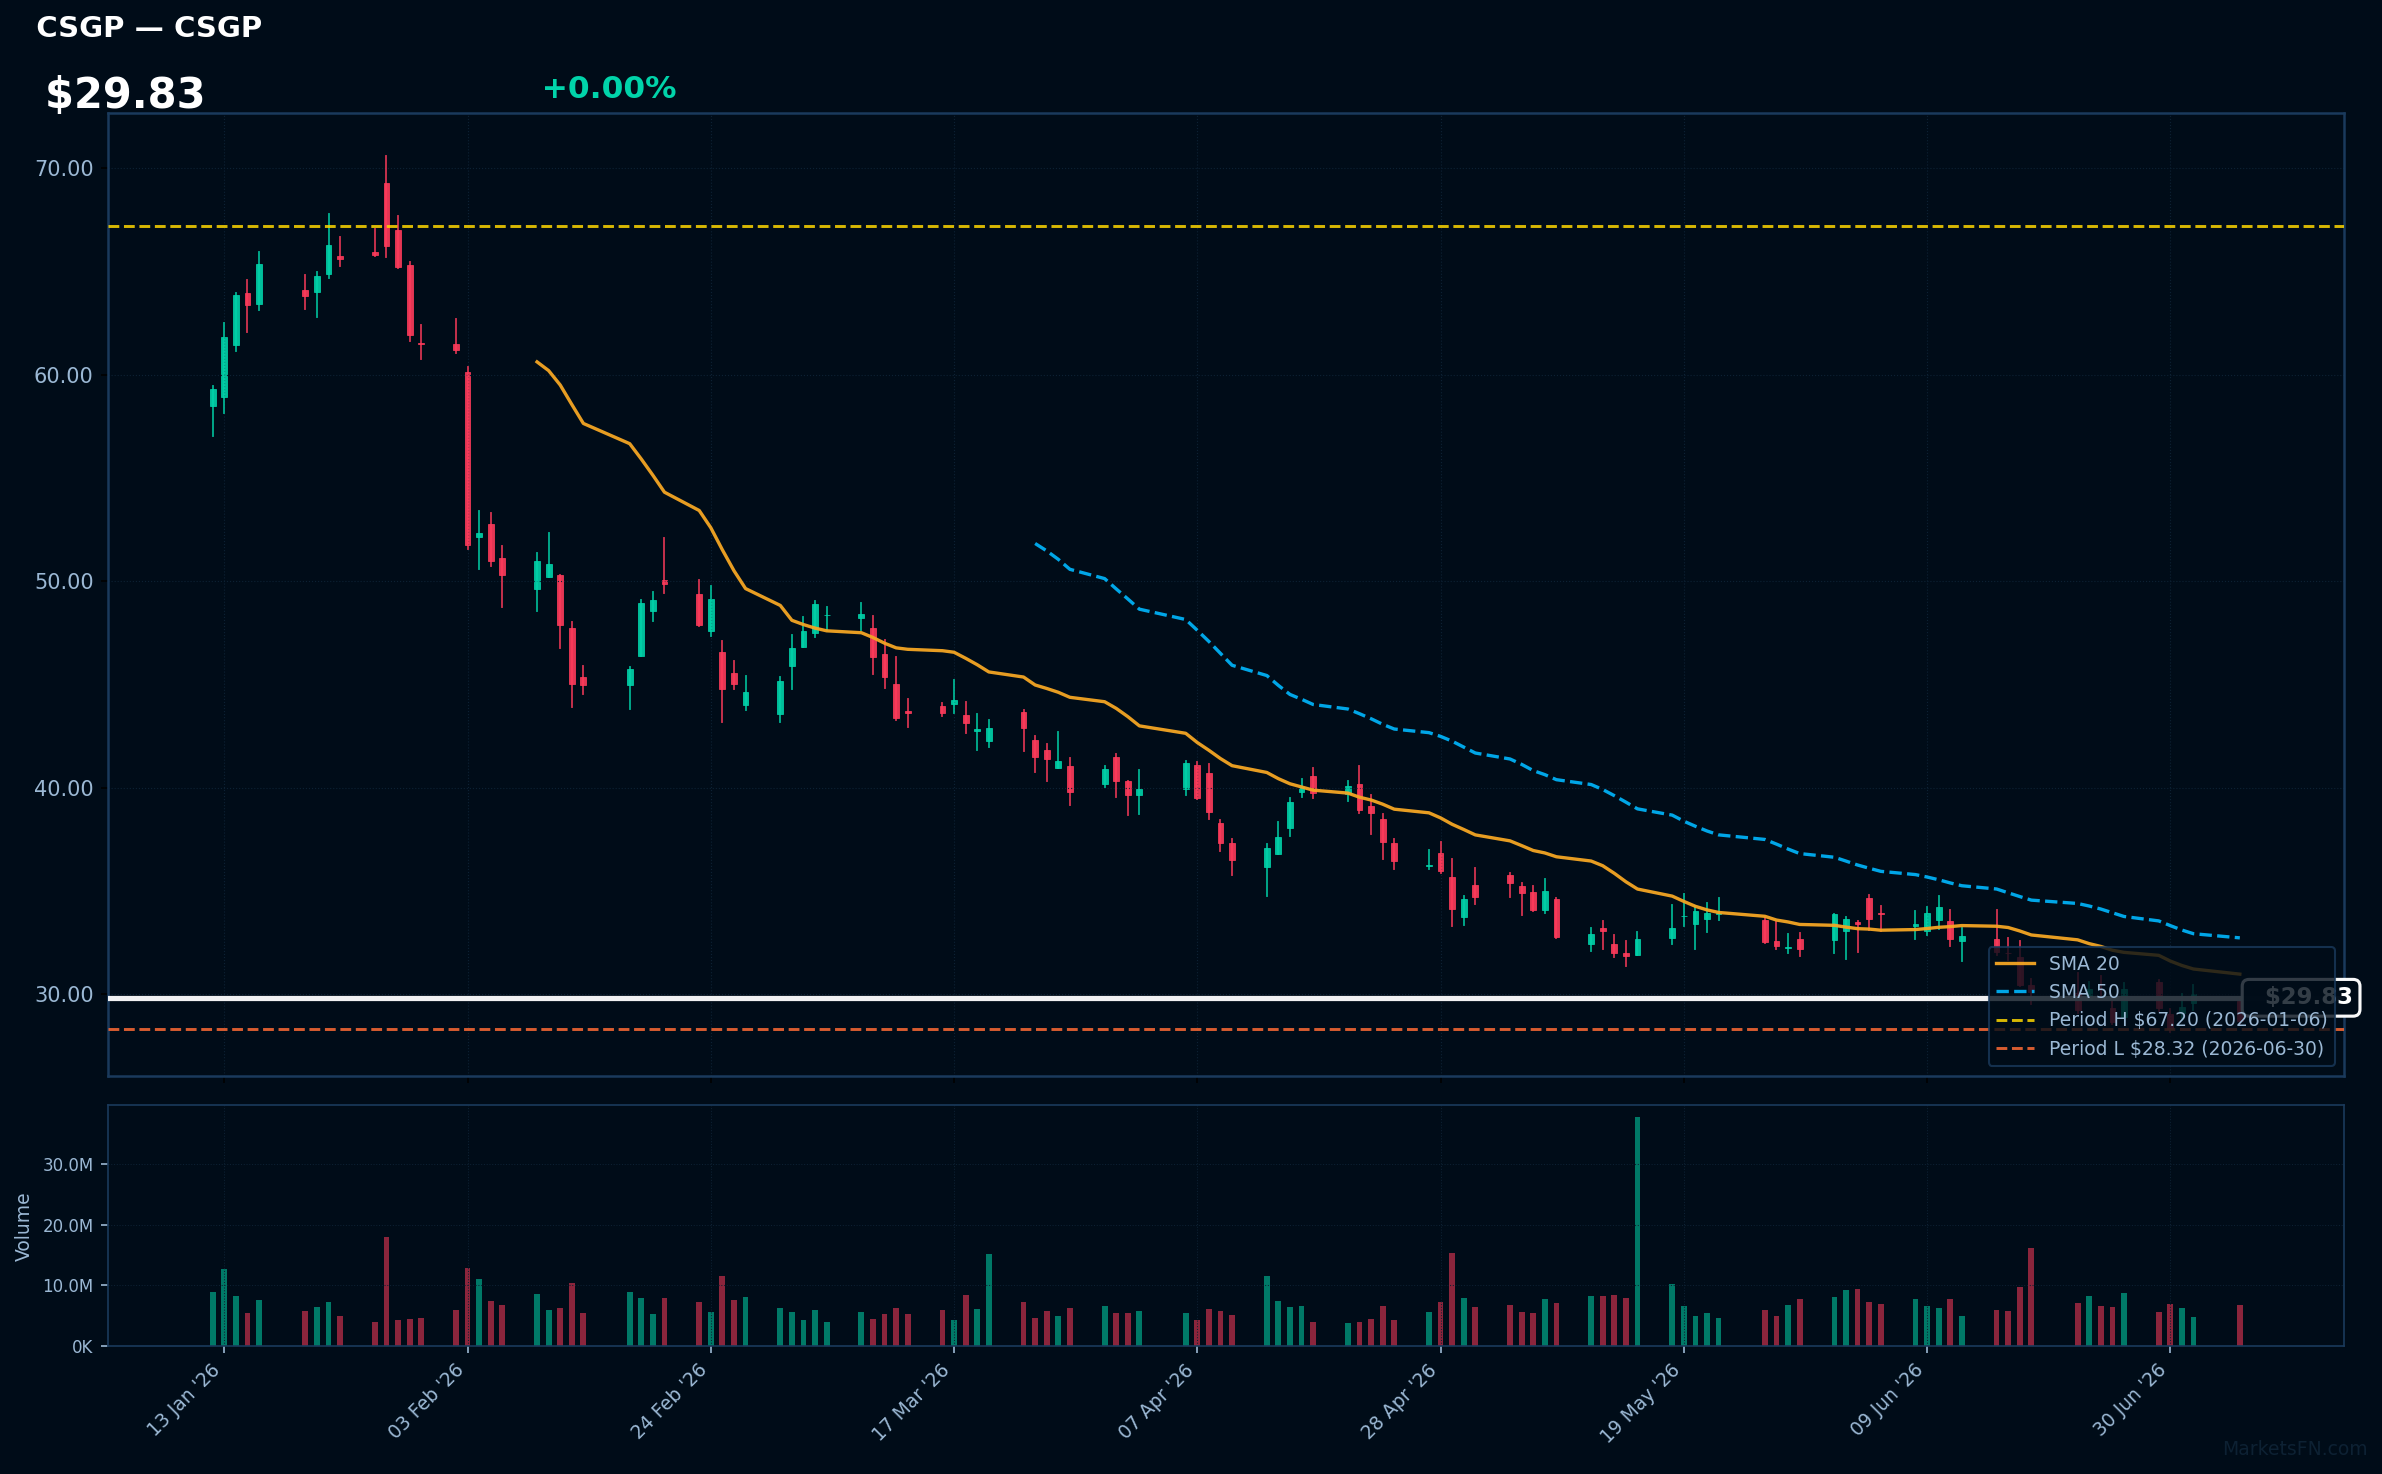
CSGP | Costar Group, Inc | Real Estate | Price Last: $28.70 | % Realized: -56.31% | RSI: 44.1 | % above MA200: -46.5% | Trend: Below MA20, MA50, MA200
Costar Group, Inc provides commercial real estate information, analytics, and marketplace services, enabling investors to assess market trends and make informed decisions. Its data-driven platform is crucial for understanding the commercial property landscape.
The stock's technical situation is bearish, with an RSI(14) of 44.1, price below MA20, MA50, and MA200, indicating a sustained downtrend. The stock is 1.3% above its 2026 YTD low, testing major support, and has returned -56.3% YTD.
Related headlines
- CoStar Group Announces Launch of CoStar Platform in France
- CoStar Group to Report Financial Results for Second Quarter on July 28, 2026
- CoStar Group Invests in Wikicasa, Italys Agent-Backed Real Estate Marketplace
- CoStar Group Stockholders Overwhelmingly Reelect Director Nominees and Support Say-on-Pay at Annual Meeting of Stockholders
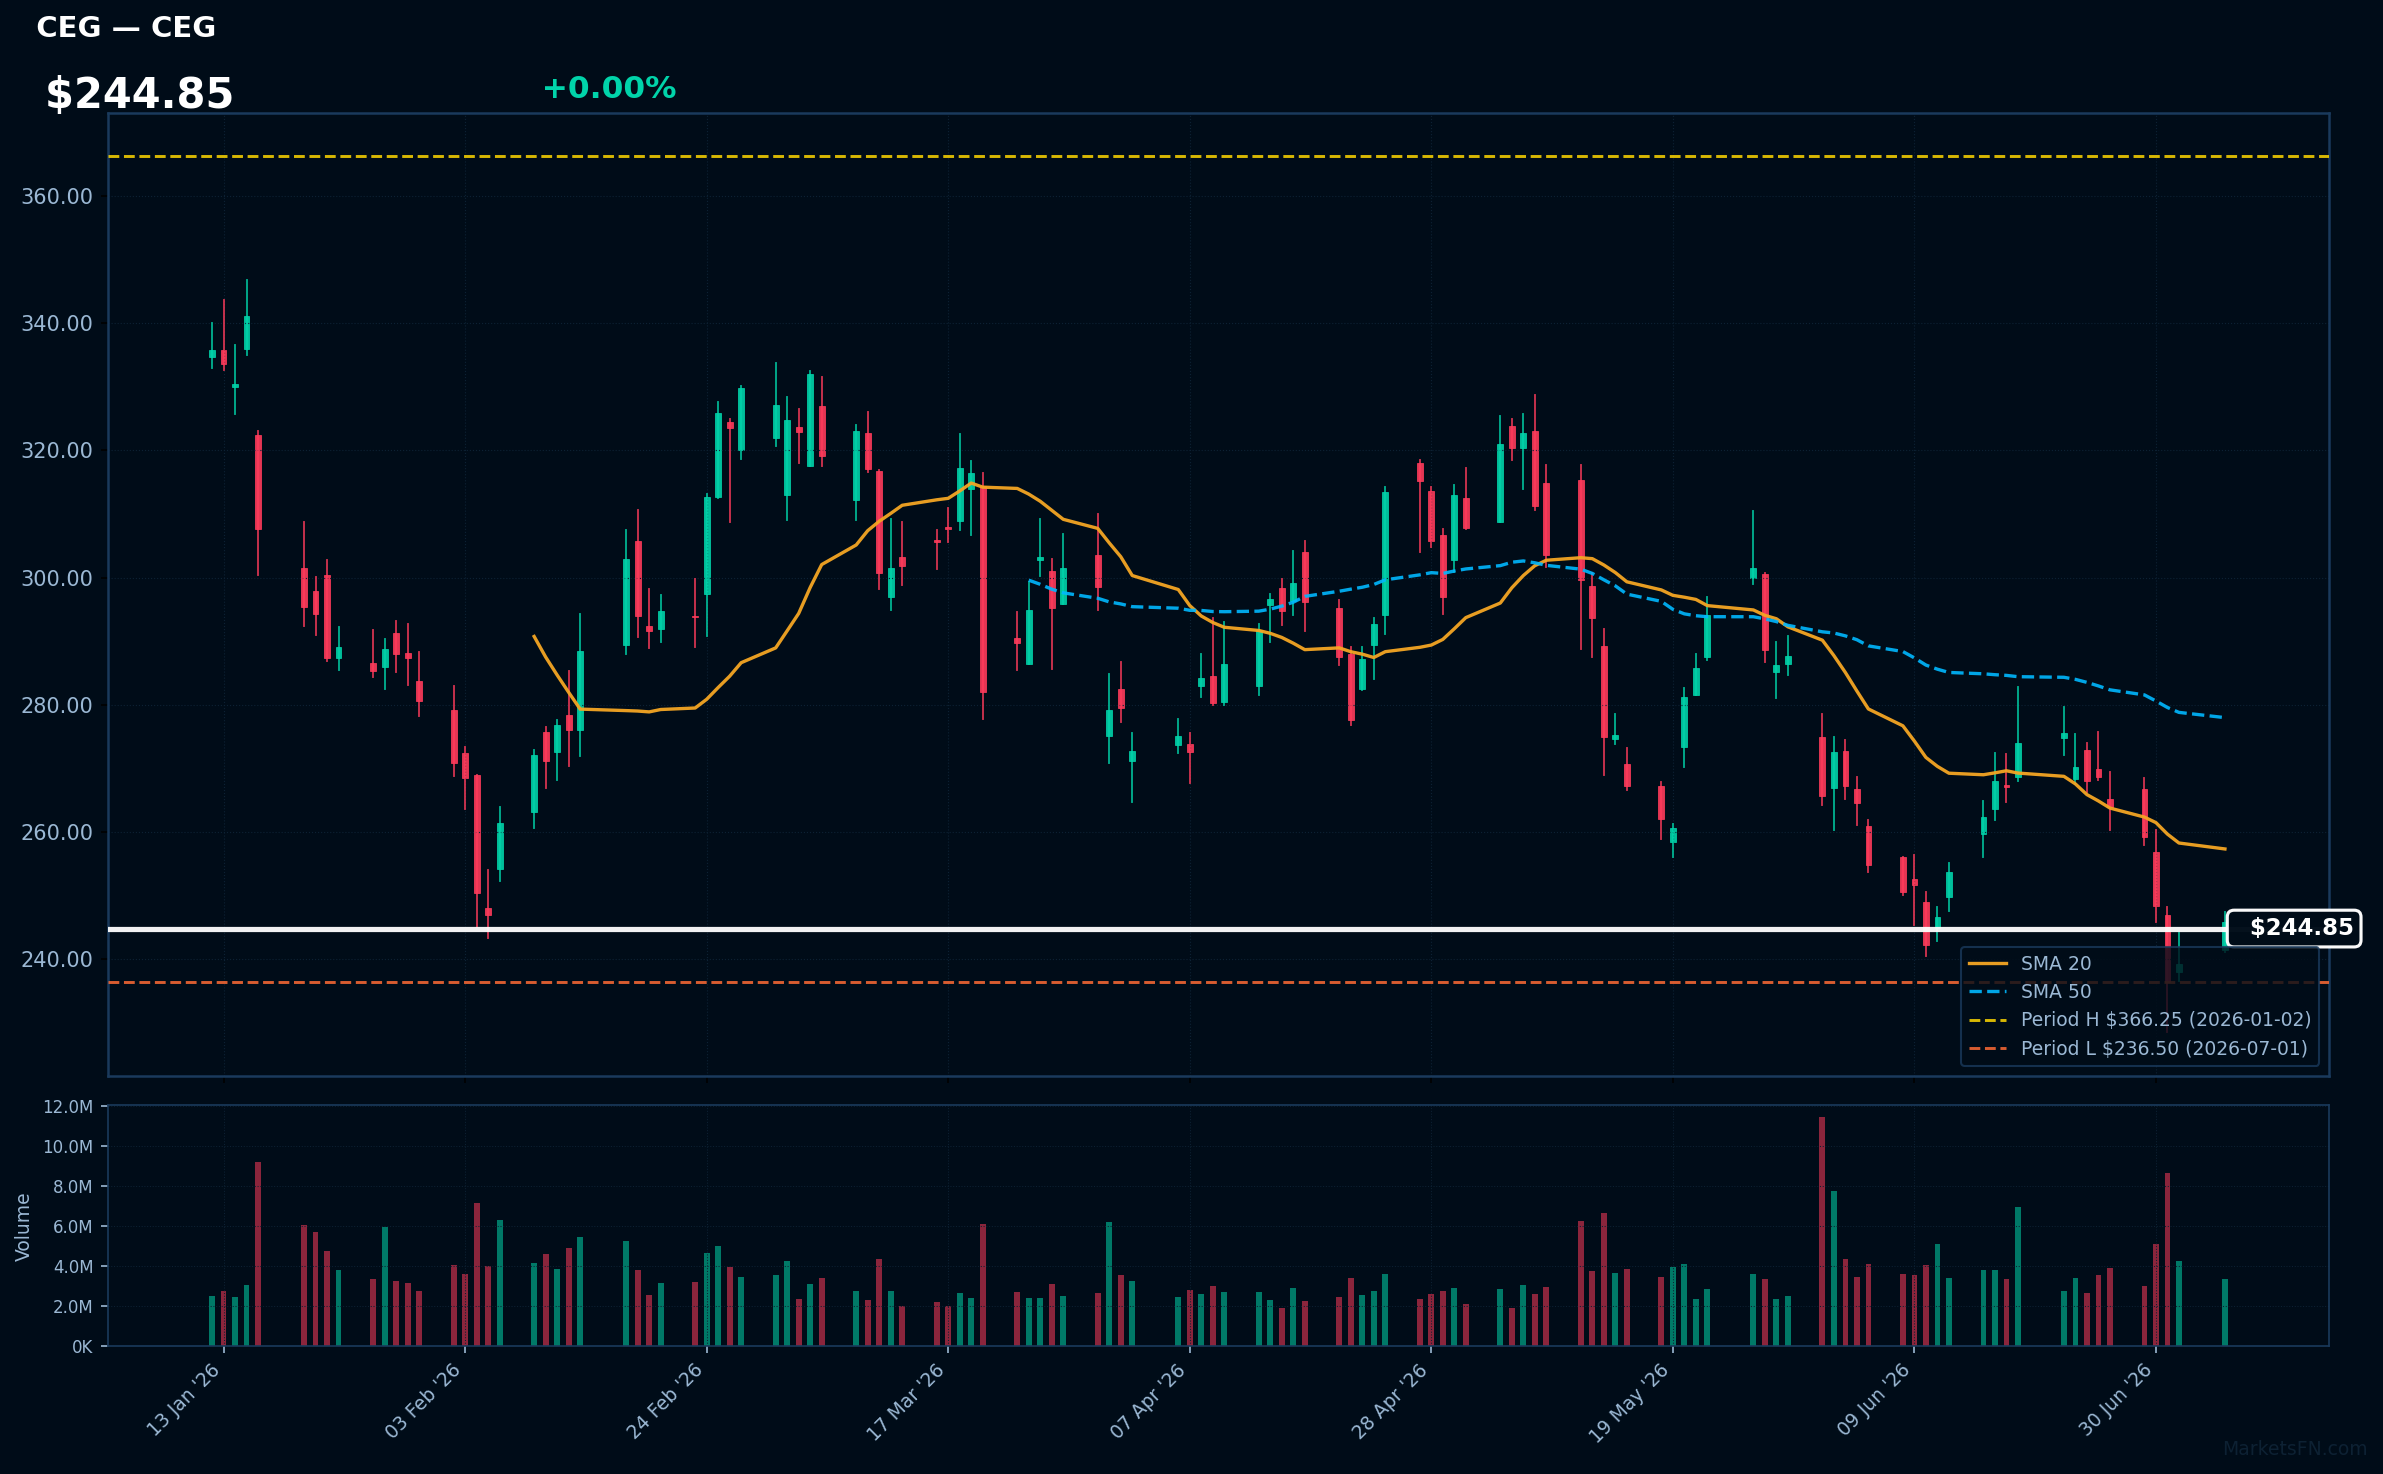
CEG | Constellation Energy Corporation | Utilities | Price Last: $245.87 | % Realized: -32.87% | RSI: 38.8 | % above MA200: -22.2% | Trend: Below MA20, MA50, MA200
Constellation Energy Corporation is a leading energy company that generates and supplies electricity, with a significant nuclear generation capacity. Investors should care due to its critical role in the US energy market and potential impact from nuclear energy policy changes.
Constellation Energy's technical situation is bearish, with an RSI(14) of 38.8 indicating oversold conditions, and a sustained downtrend as price ($244.85) remains below MA20, MA50, and MA200, with the stock only 4.0% above its 2026 YTD low.
Related headlines
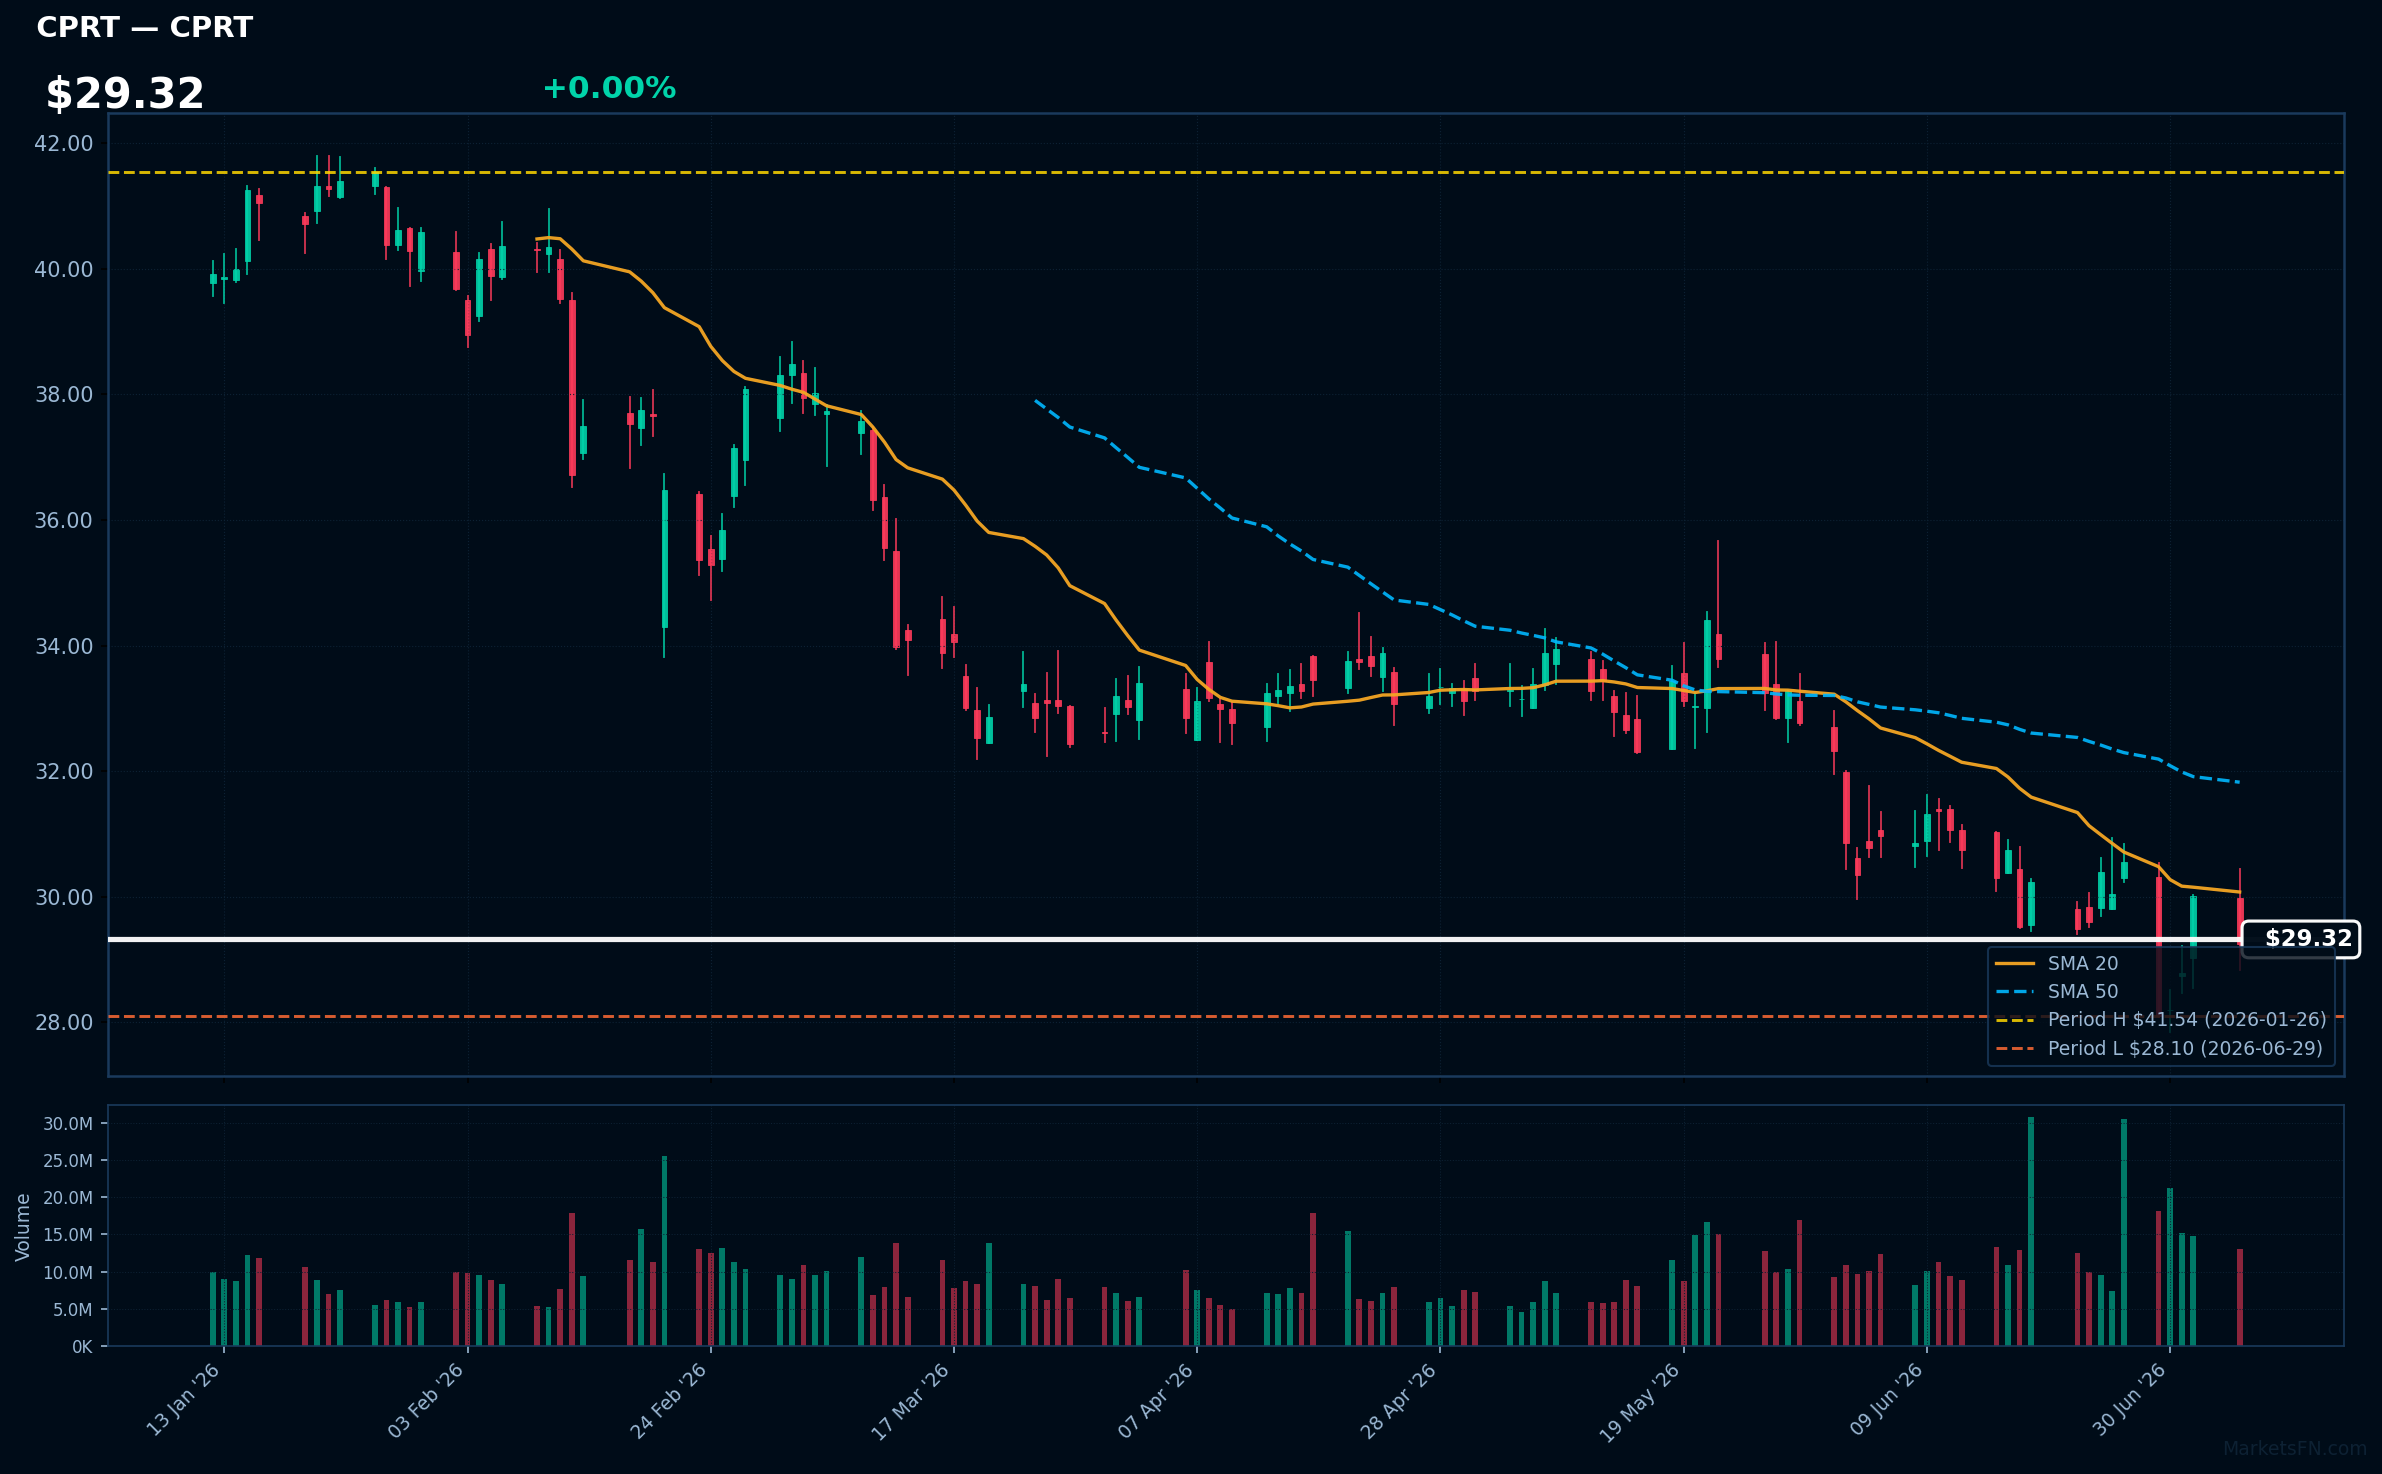
CPRT | Copart, Inc | Industrials | Price Last: $29.24 | % Realized: -22.58% | RSI: 43.3 | % above MA200: -21.7% | Trend: Below MA20, MA50, MA200
Copart, Inc (CPRT) operates an online vehicle auction and remarketing platform, connecting buyers and sellers of used vehicles. Investors should care because its market position and pricing power impact profitability.
Copart's technical situation is bearish: RSI(14) is 43.3, indicating neutral momentum, but MA alignment shows a sustained downtrend with price ($29.32) < MA20 < MA50 < MA200, and the stock is 4.1% above its 2026 YTD low.
Related headlines
Market Commentary
The Nasdaq 100 stocks listed are near their 2026 year-to-date (YTD) extremes, with some at their highs and others at their lows. Stocks like PANW, VRTX, CRWD, FTNT, and TTWO are at their 2026 YTD highs, indicating strong performance, while ORLY and WBD are at their 2026 YTD lows, showing weakness.
The technology sector themes driving these moves include cybersecurity, with PANW, CRWD, and FTNT at their YTD highs, suggesting investor confidence in this area. The gaming sector is also performing well, as evidenced by TTWO's YTD high. In contrast, WBD's low may be related to challenges in the media and entertainment sector. Macro conditions, such as investor sentiment and economic outlook, are likely influencing these trends.
Investors and traders should watch the performance of these stocks relative to their YTD extremes and monitor sector-specific news and macroeconomic indicators. The proximity of these stocks to their YTD highs and lows may indicate potential for breakout or reversal, making them worth watching for trading opportunities or portfolio adjustments.
Methodology: All 101 Nasdaq 100 constituents screened. Close prices downloaded from 2026-01-01. Period high = highest close since Jan 1 2026; period low = lowest close since Jan 1 2026. Distance = (current price / period extreme − 1) × 100. Technical indicators computed on up to 1 year of daily OHLCV data.
Disclaimer: For informational purposes only. Not investment advice. Past performance is not indicative of future results.

