S&P 500 52-Week Highs & Lows Radar: JPMorgan Chase & (JPM), Ulta Beauty (ULTA) and more
MarketsFN Team

S&P 500 52-Week Highs & Lows Radar: JPMorgan Chase & (JPM), Ulta Beauty (ULTA) and more
Screening all 503 S&P 500 constituents for stocks nearest to their 52-week high and their 52-week low. Data as of July 07, 2026. % Realized = 52-week total return.
Legend: RSI > 70 = overbought · RSI < 30 = oversold · Green % Realized = positive 52W return · Red = negative.
📈 Nearest to 52-Week High
Sectors represented: Financial (2), Healthcare (2), Consumer Defensive (1)
| Ticker | Company | Sector | Price Last | % Realized | 52-Week High Date | RSI | % above MA200 | Trend |
|---|---|---|---|---|---|---|---|---|
| JPM | JPMorgan Chase & Co | Financial | $341.15 | +16.84% | 2026-07-07 | 68.4 | +10.5% | Above MA20, MA50, MA200 |
| LLY | Lilly(Eli) & Co | Healthcare | $1236.28 | +59.96% | 2026-07-07 | 68.6 | +24.9% | Above MA20, MA50, MA200 |
| JNJ | Johnson & Johnson | Healthcare | $268.36 | +72.83% | 2026-07-07 | 72.9 | +22.1% | Above MA20, MA50, MA200 |
| BAC | Bank Of America Corp | Financial | $60.63 | +24.61% | 2026-07-07 | 76.5 | +15.1% | Above MA20, MA50, MA200 |
| KO | Coca-Cola Co | Consumer Defensive | $85.43 | +20.31% | 2026-07-07 | 64.8 | +14.7% | Above MA20, MA50, MA200 |
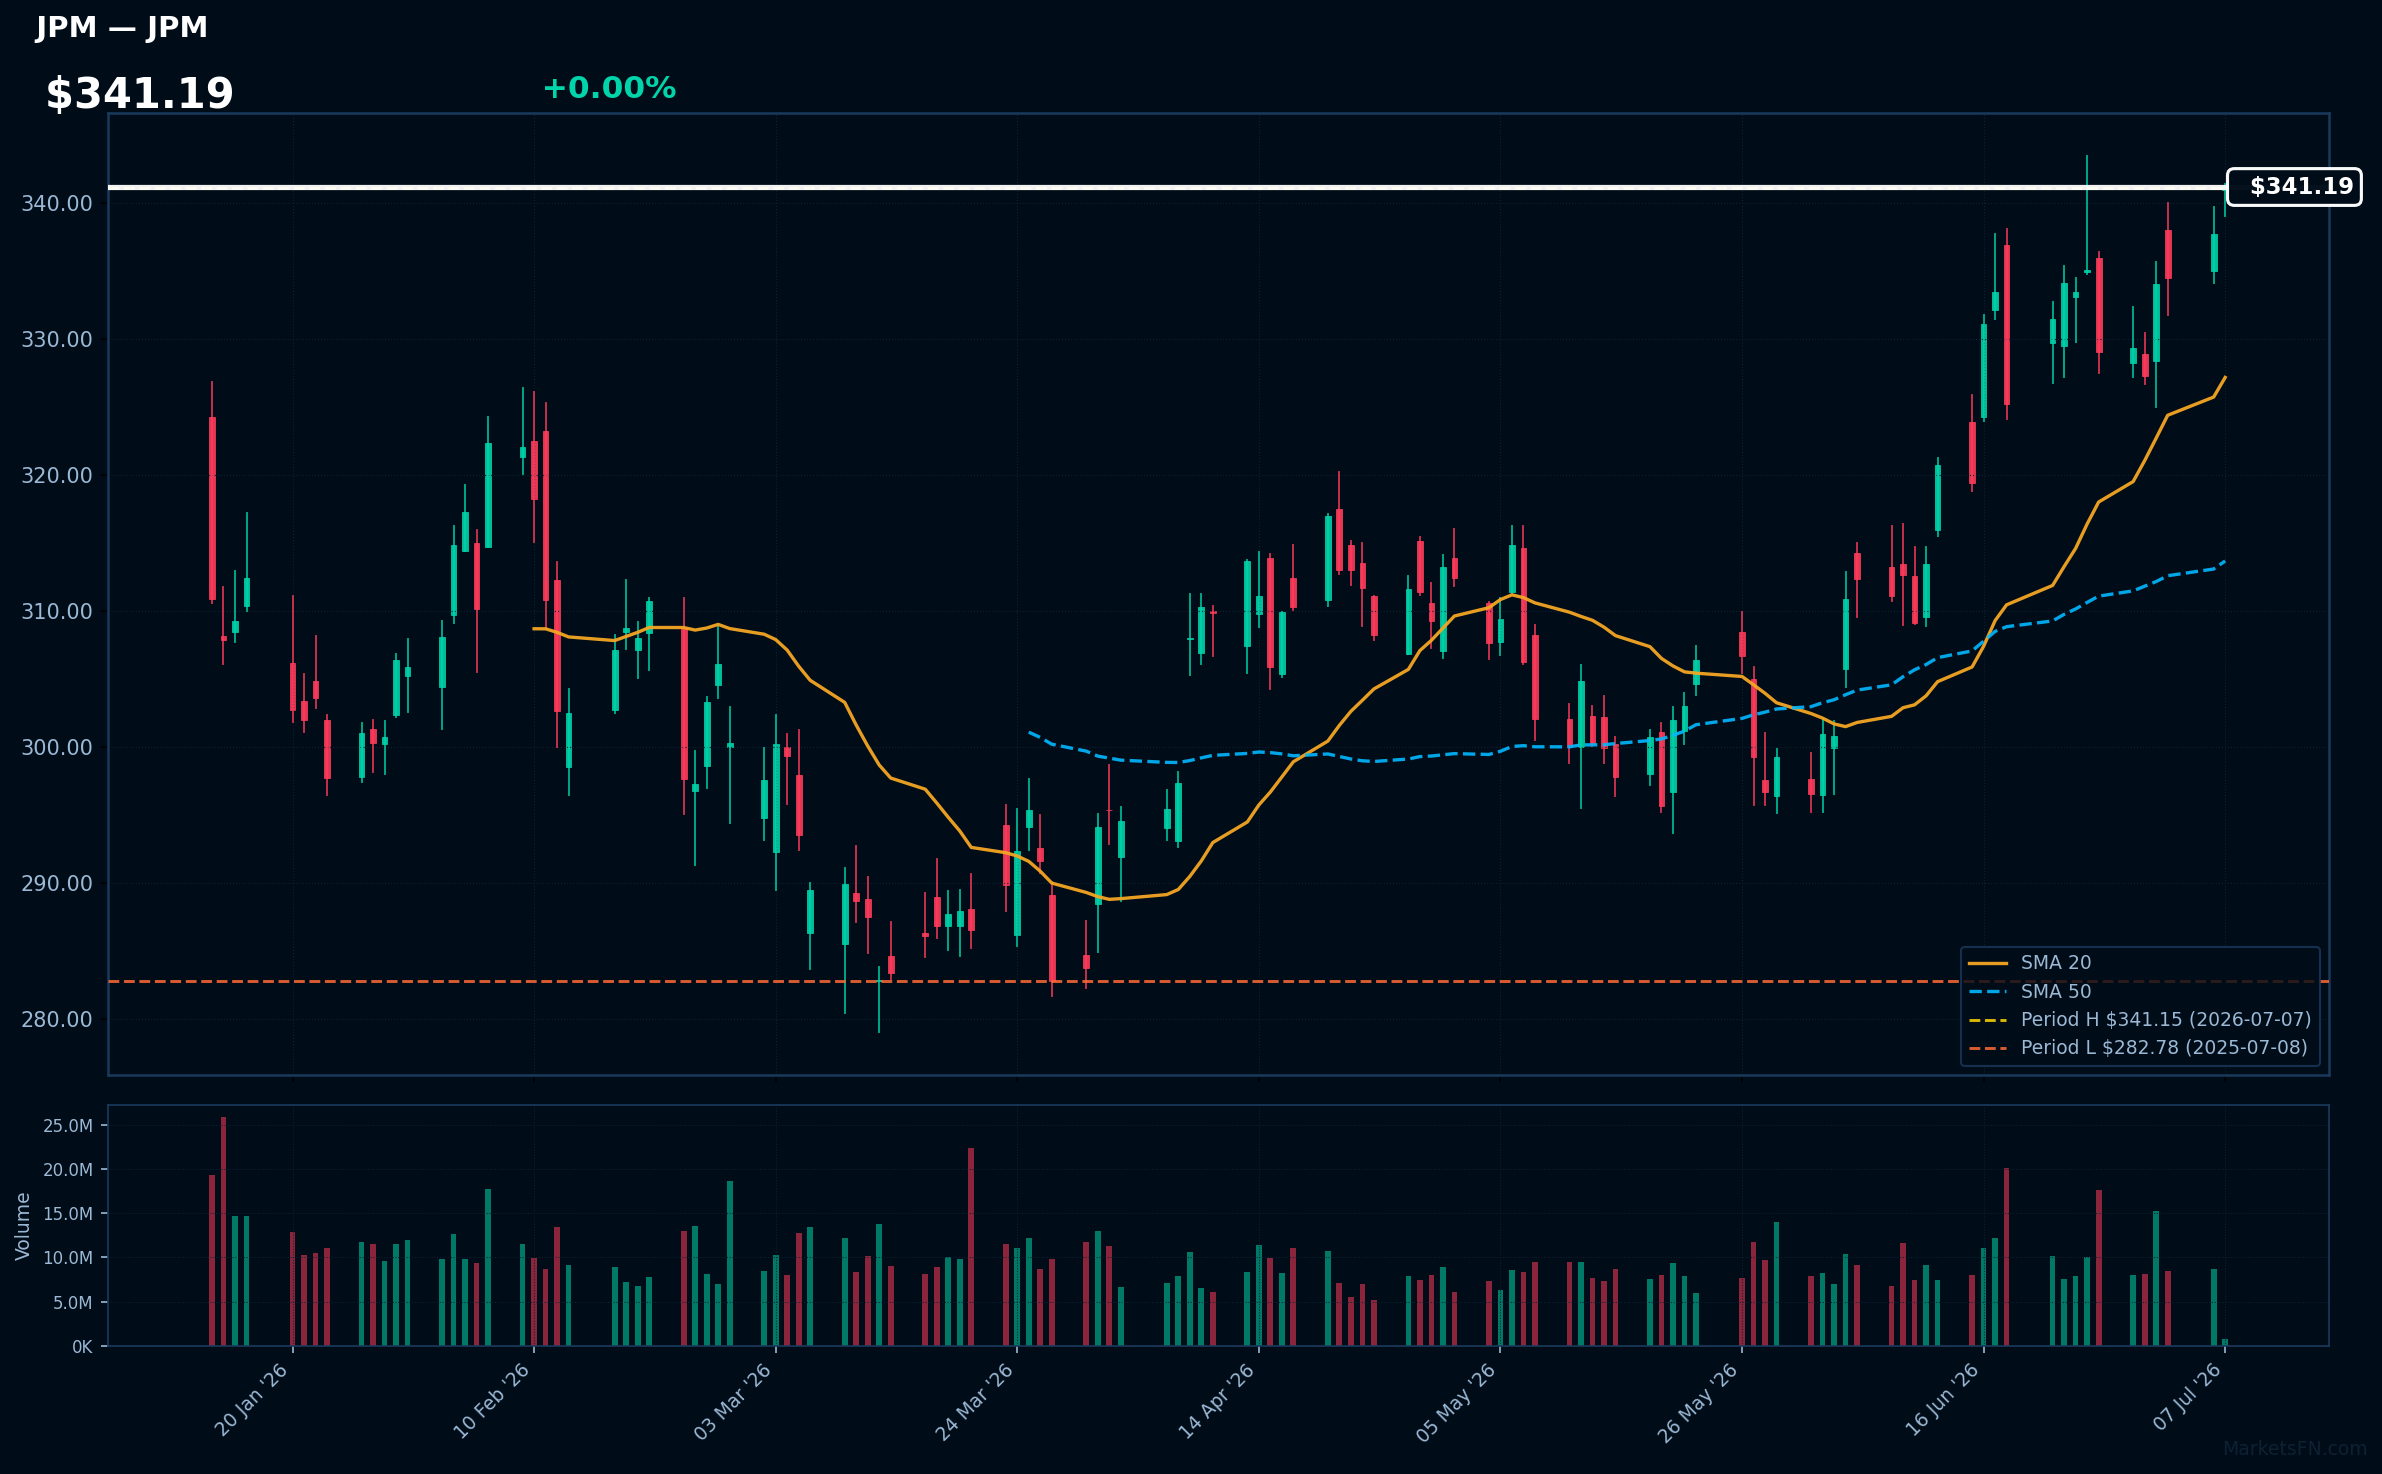
JPM | JPMorgan Chase & Co | Financial | Price Last: $341.15 | % Realized: +16.84% | RSI: 68.4 | % above MA200: +10.5% | Trend: Above MA20, MA50, MA200
JPMorgan Chase & Co is a global financial institution offering a wide range of financial services including consumer and community banking, corporate and investment banking, and asset management, making it a significant player in the global economy.
JPMorgan Chase & Co is near a potential breakout at $341.19, being 0.0% below its 52-Week high with an RSI(14) of 68.4, indicating strong momentum; its price > MA20 > MA50 > MA200 alignment confirms a sustained uptrend.
Related headlines
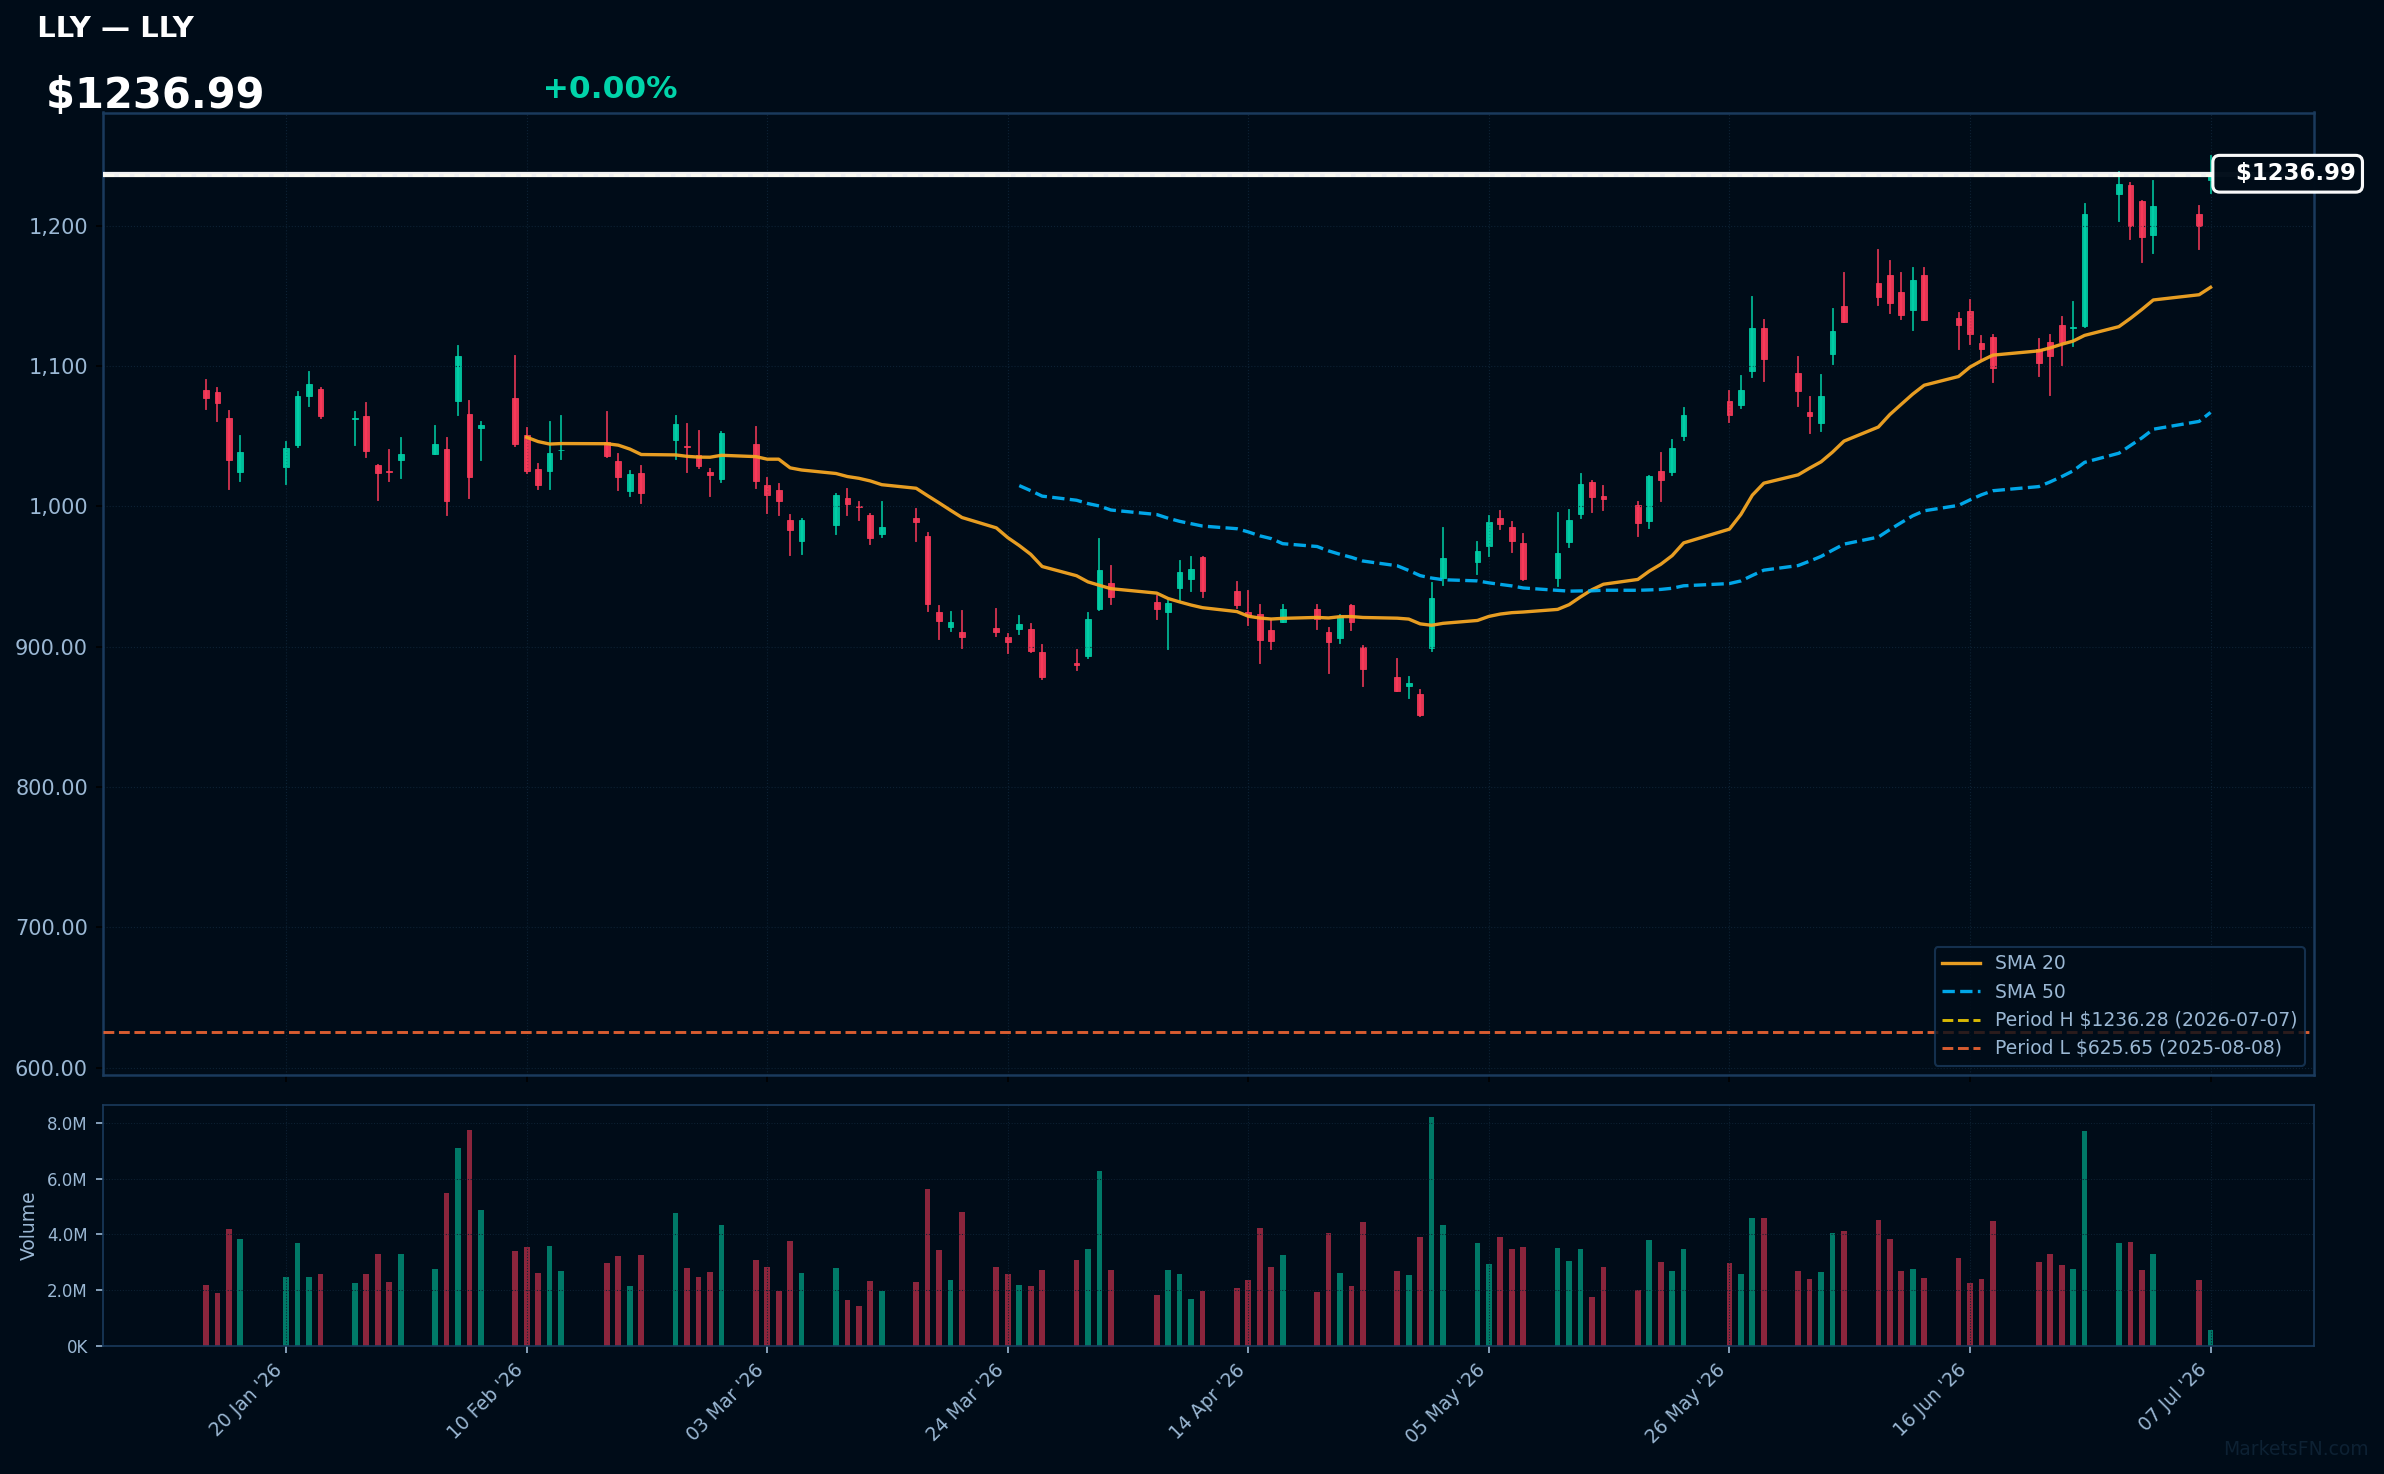
LLY | Lilly(Eli) & Co | Healthcare | Price Last: $1236.28 | % Realized: +59.96% | RSI: 68.6 | % above MA200: +24.9% | Trend: Above MA20, MA50, MA200
Eli Lilly is a pharmaceutical company developing and marketing medicines, with a focus on diabetes, obesity, and Alzheimer's treatments. Investors should care about its pipeline progress and regulatory approvals, which drive revenue growth.
Lilly's technicals indicate sustained uptrend with price > MA20 > MA50 > MA200, RSI(14) at 68.6, nearing a 52-Week high. This suggests momentum, not a warning sign, with 60.0% 52-Week return and 0.0% below the high, indicating potential breakout level.
Related headlines
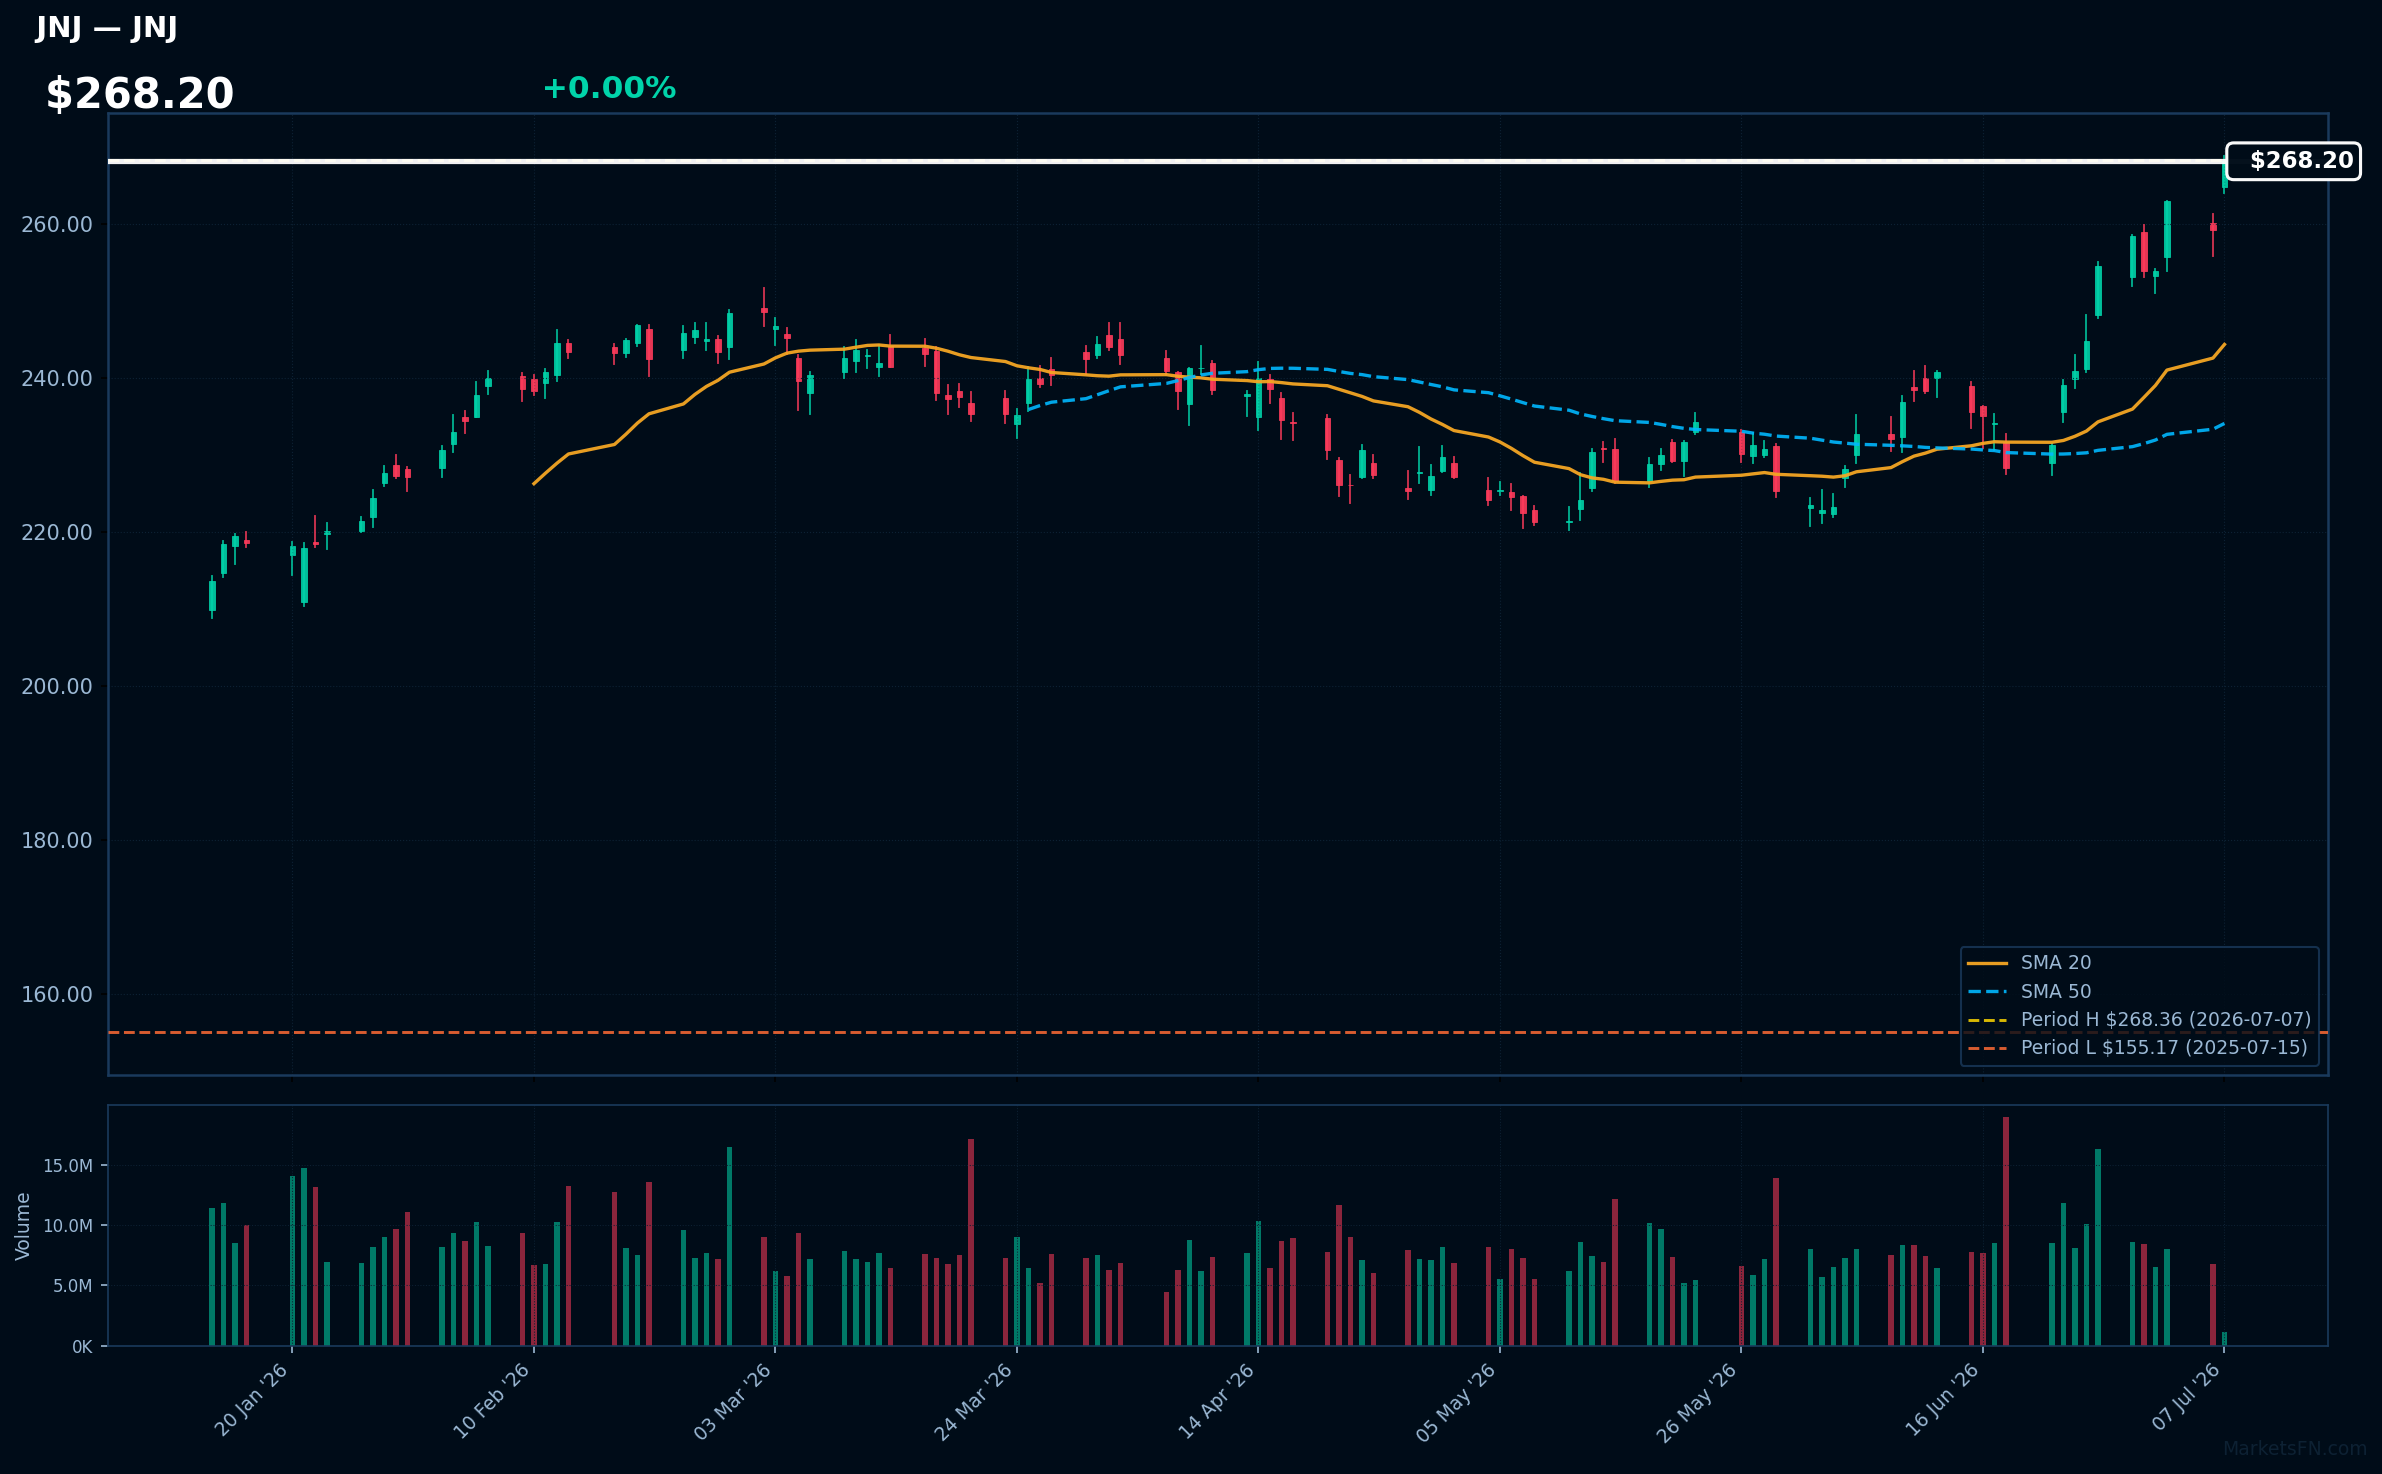
JNJ | Johnson & Johnson | Healthcare | Price Last: $268.36 | % Realized: +72.83% | RSI: 72.9 | % above MA200: +22.1% | Trend: Above MA20, MA50, MA200
Johnson & Johnson is a diversified healthcare company with significant presence in pharmaceuticals, medical devices, and consumer products. Investors should care due to its broad portfolio and history of innovation, providing relatively stable returns.
JNJ's RSI(14) is 72.9, nearing overbought territory. The MA alignment (price > MA20 > MA50 > MA200) indicates a sustained uptrend. With the stock 0.0% below its 52-Week high, it suggests potential for further momentum, having returned 72.8% over the 52-Week period.
Related headlines
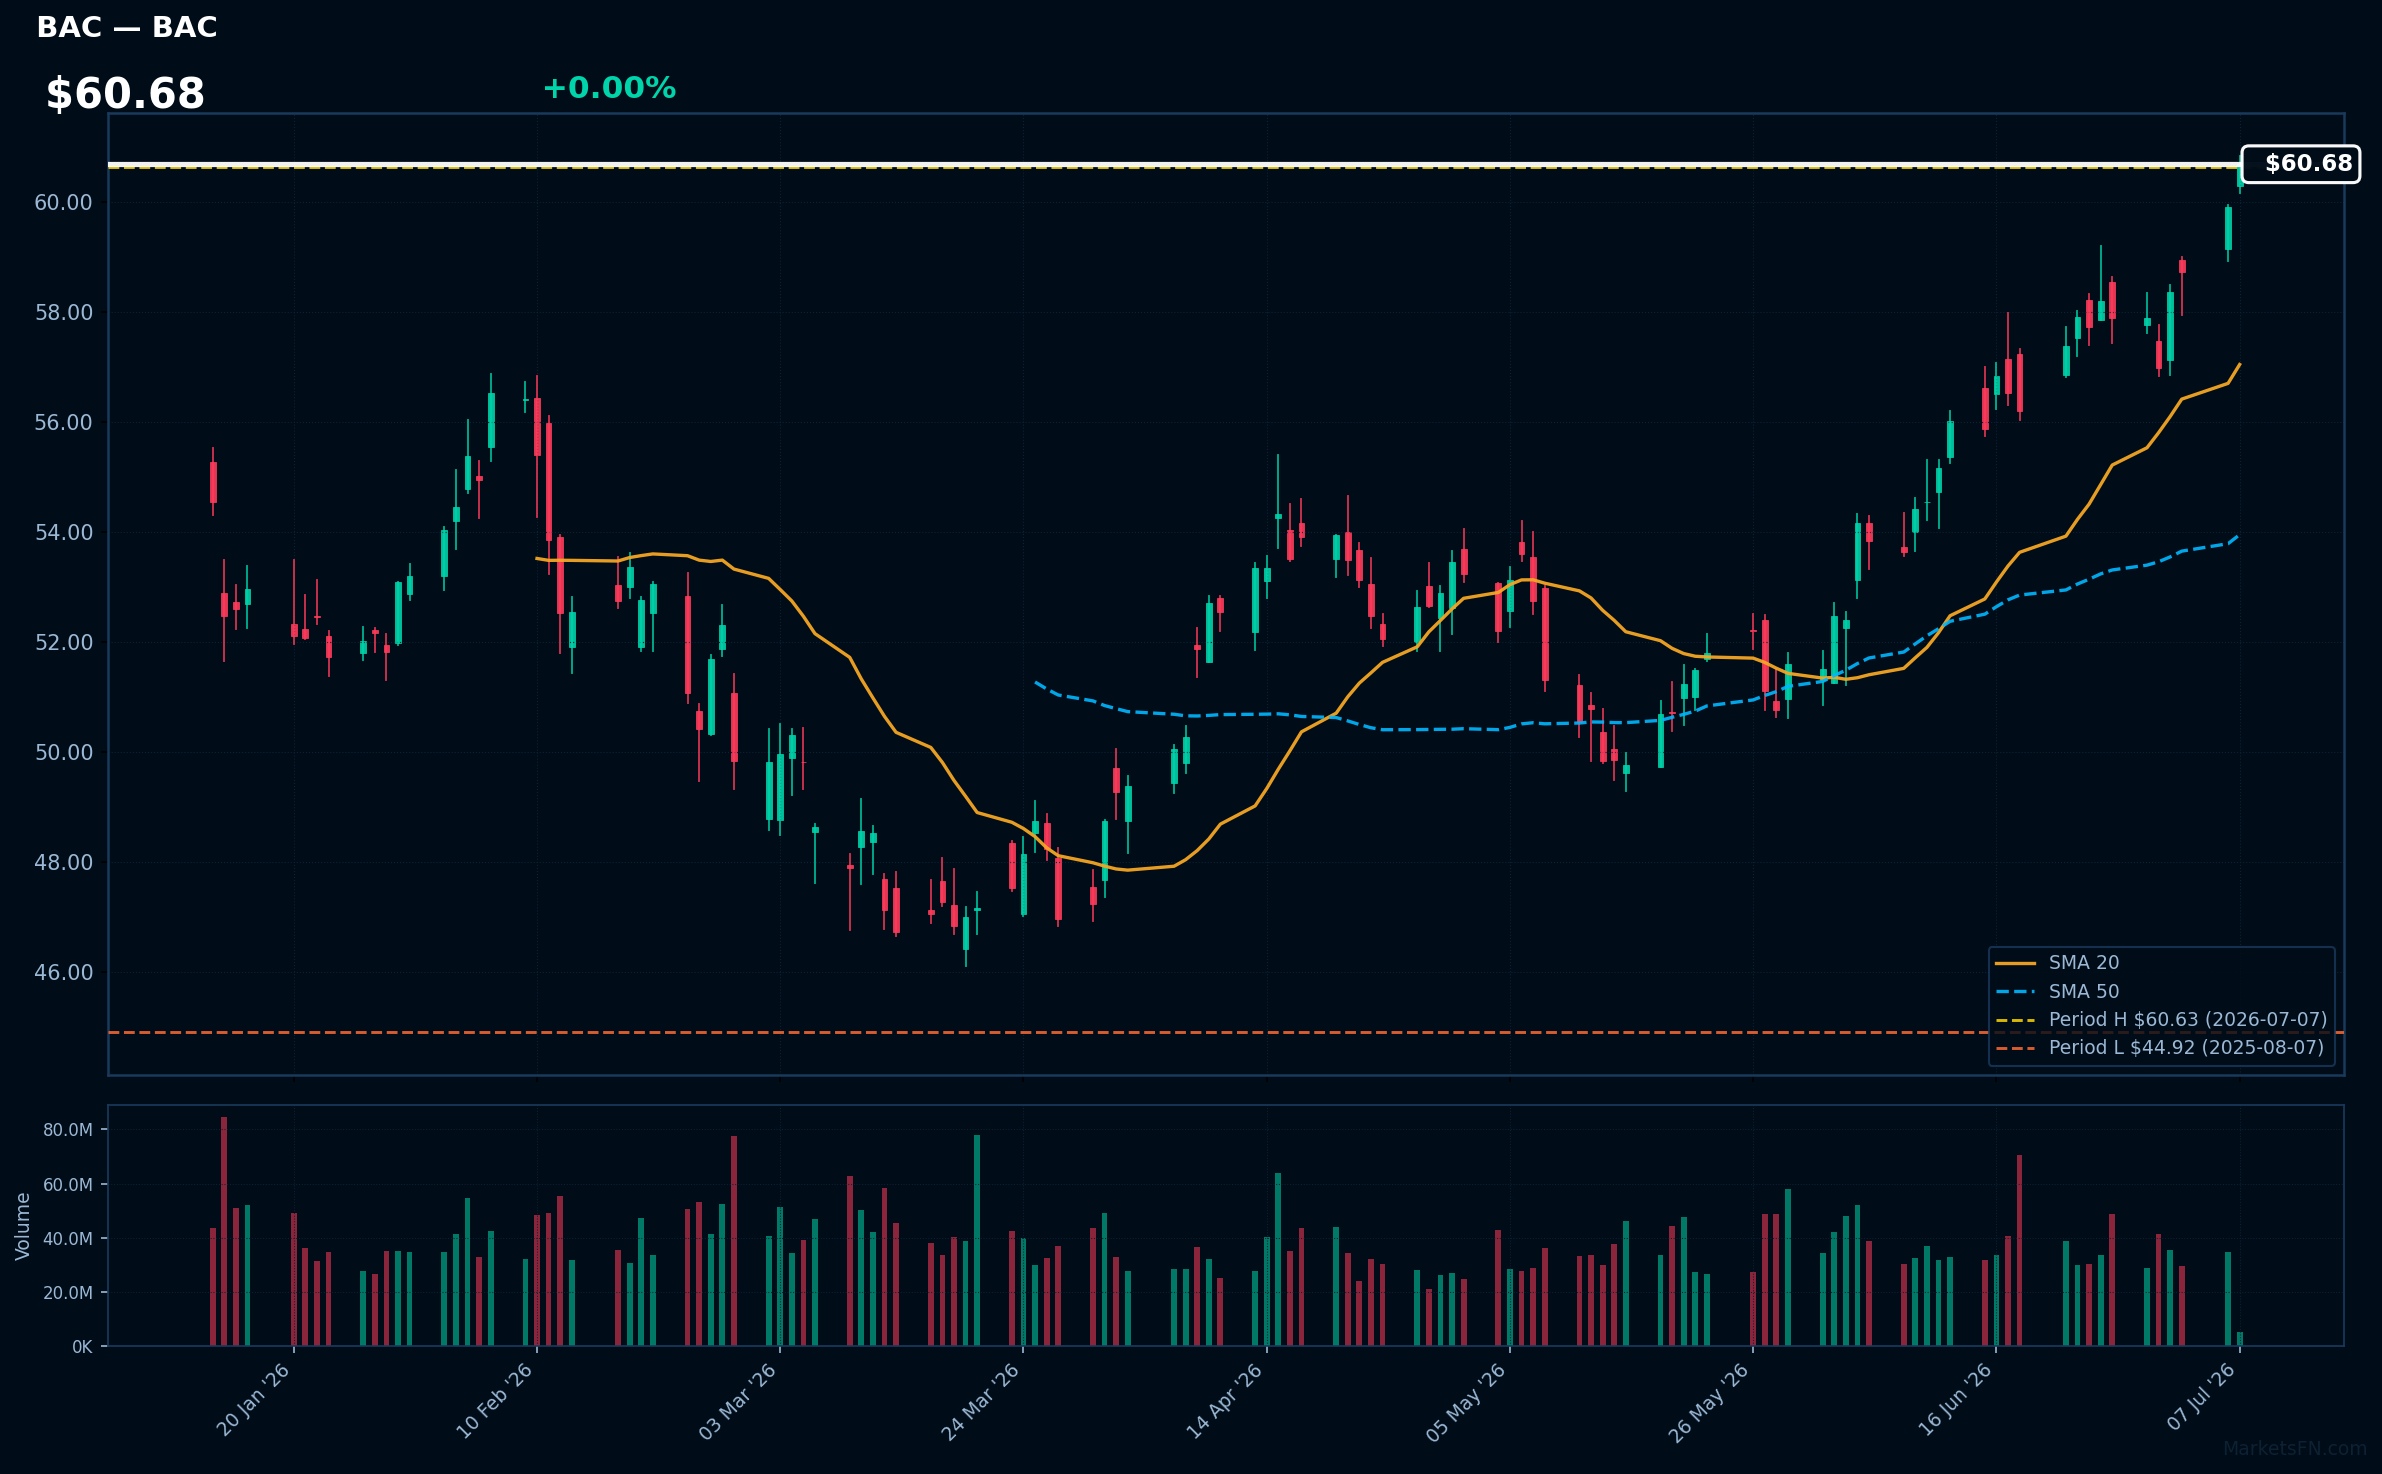
BAC | Bank Of America Corp | Financial | Price Last: $60.63 | % Realized: +24.61% | RSI: 76.5 | % above MA200: +15.1% | Trend: Above MA20, MA50, MA200
Bank Of America Corp is a multinational banking and financial services corporation. Investors should care because its performance reflects the overall health of the US consumer and corporate lending markets, with implications for the broader economy.
The stock exhibits strong bullish momentum with an RSI(14) of 76.5 and a sustained uptrend as price > MA20 > MA50 > MA200. It's near a potential breakout, 0.0% below its 52-Week high, having returned 24.6% over the 52-Week period.
Related headlines
- Visa shares slip as banks reportedly consider acquiring Fiserv debit network (V)
- Fiserv Stock Jumps on Report Big U.S. Banks Explore Buying Its Debit Card Network
- Fiserv discusses potential sale of debit payments network with major US banks (FISV)
- Intel-Backed AI Chip and Software Maker Syntiant Files for IPO
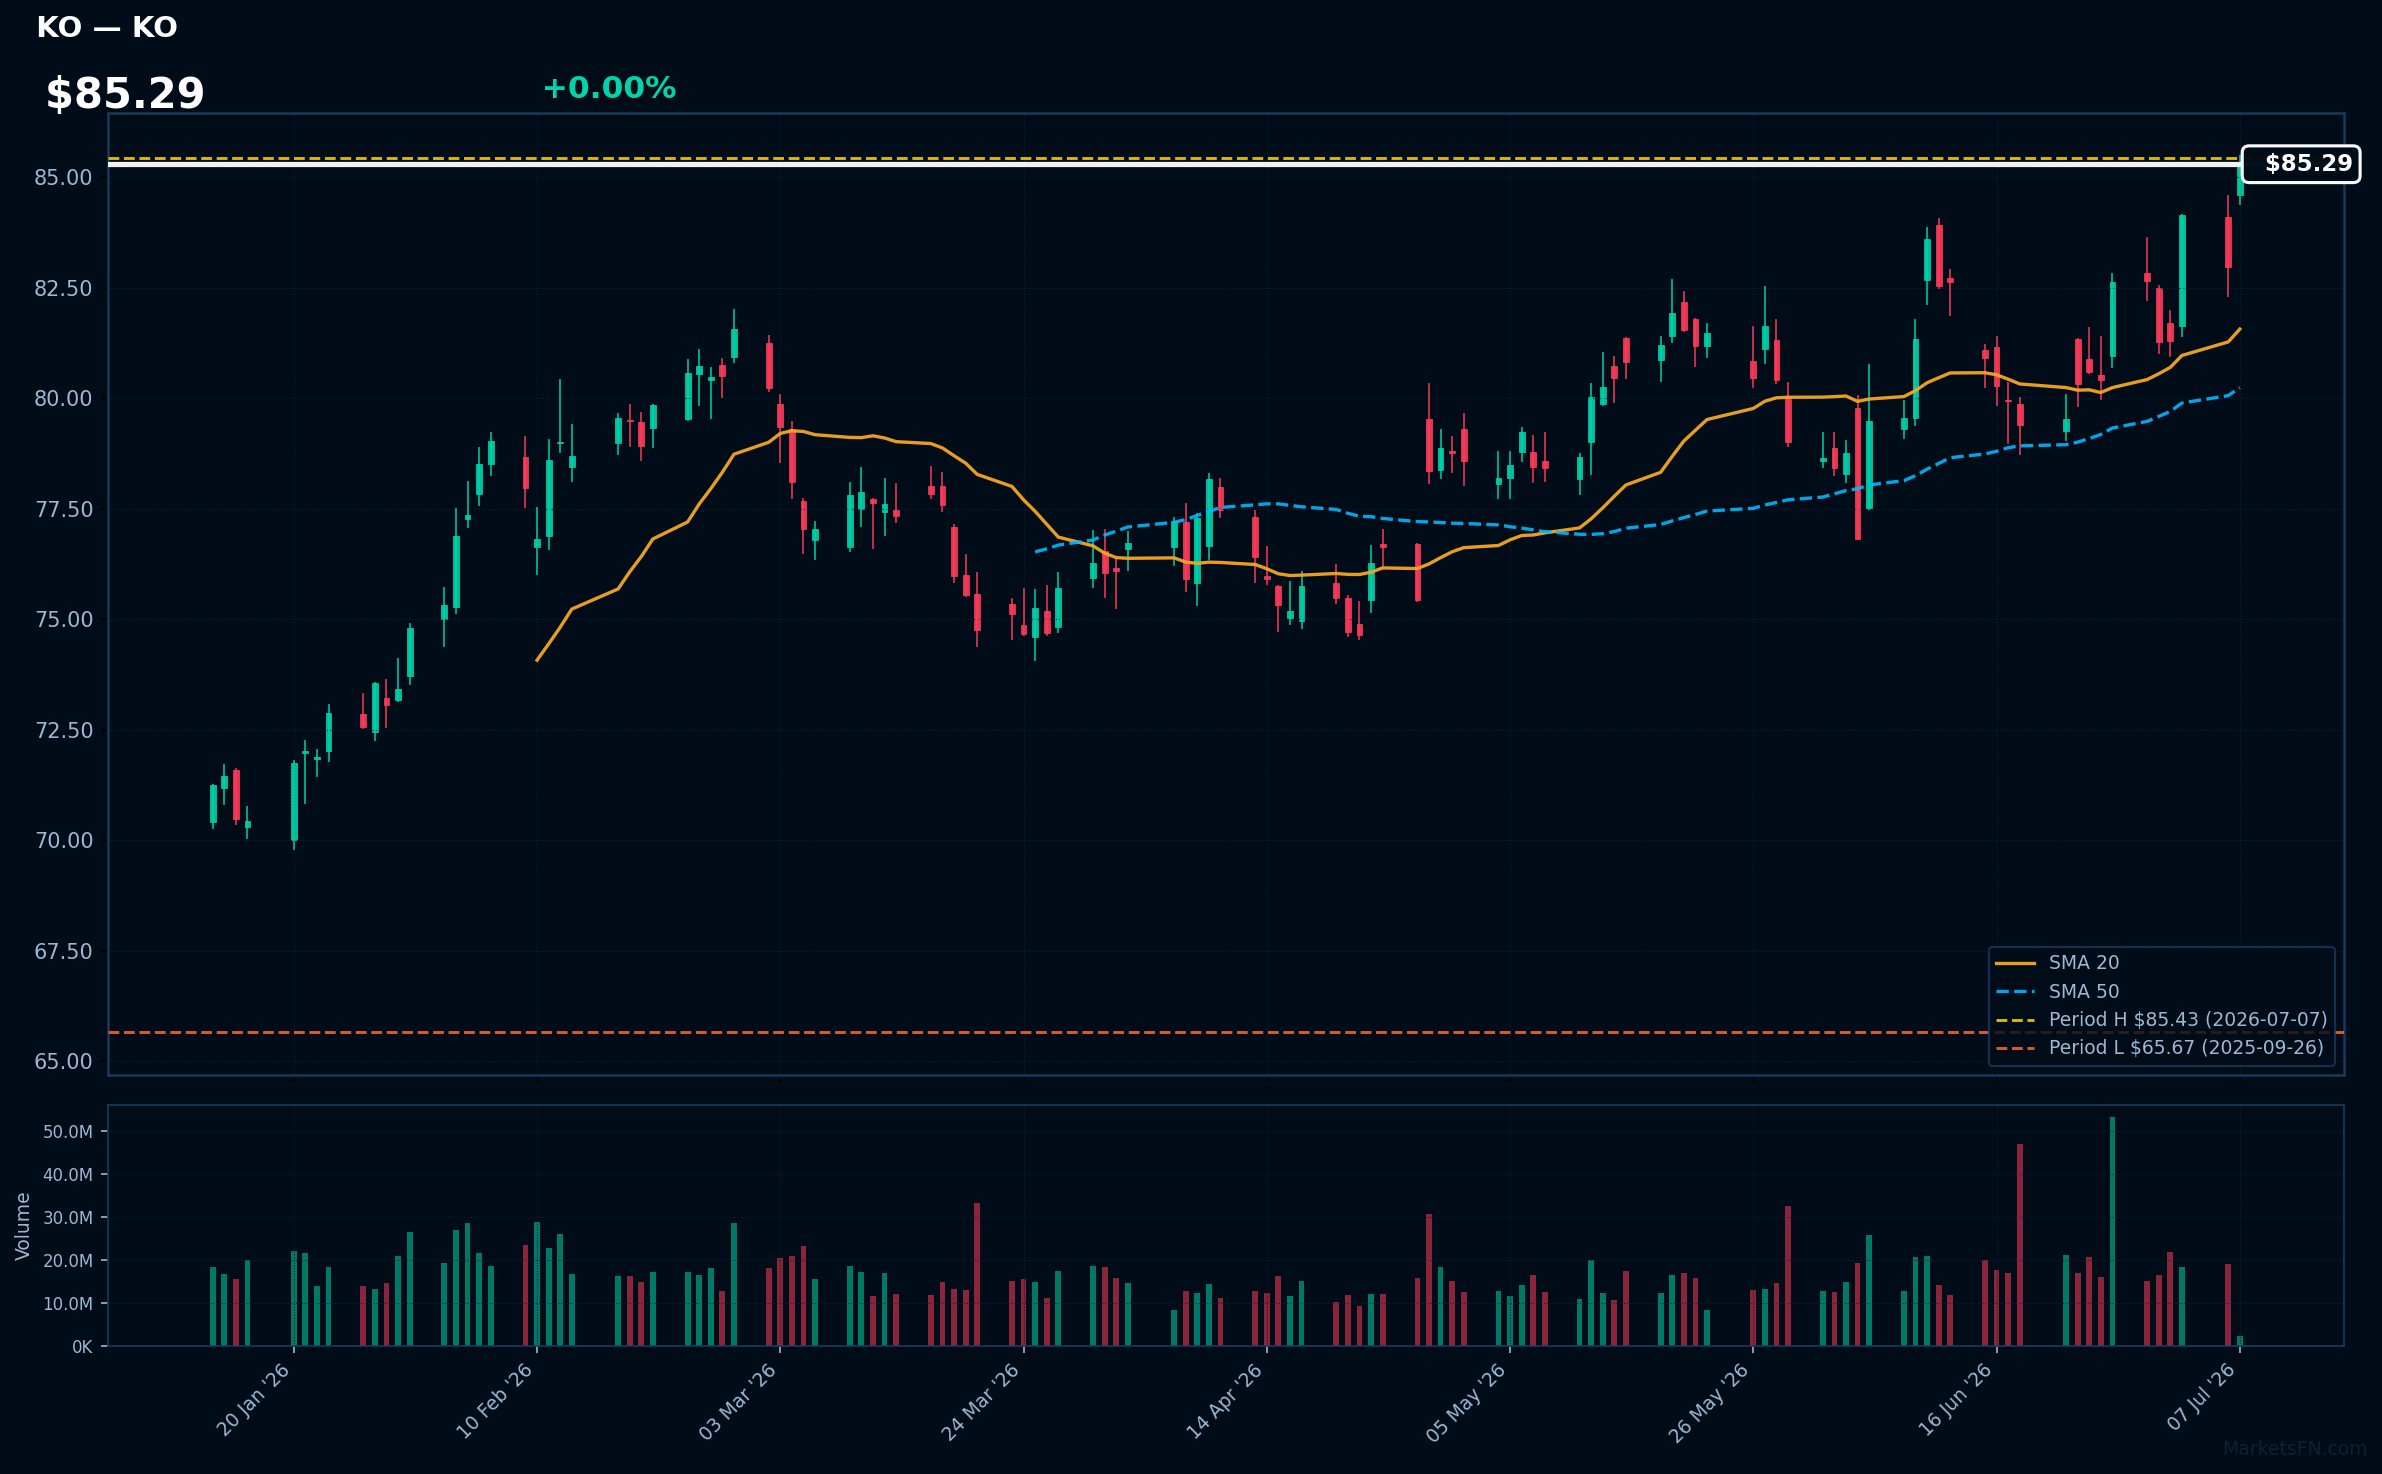
KO | Coca-Cola Co | Consumer Defensive | Price Last: $85.43 | % Realized: +20.31% | RSI: 64.8 | % above MA200: +14.7% | Trend: Above MA20, MA50, MA200
Coca-Cola Co is a beverage company that generates revenue primarily through the sale of its iconic soft drinks and other beverages. Investors should care because its brand portfolio and global distribution network drive consistent cash flows.
Coca-Cola Co's technicals indicate sustained uptrend with price > MA20 > MA50 > MA200, RSI(14) at 64.8, near its 52-Week high. This suggests momentum, with a potential breakout; MA alignment and RSI level indicate continued upward pressure.
Related headlines
📉 Nearest to 52-Week Low
Sectors represented: Consumer Cyclical (4), Energy (1)
| Ticker | Company | Sector | Price Last | % Realized | 52-Week Low Date | RSI | % above MA200 | Trend |
|---|---|---|---|---|---|---|---|---|
| ULTA | Ulta Beauty Inc | Consumer Cyclical | $454.72 | -4.47% | 2026-06-17 | 41.9 | -18.9% | Below MA20, MA50, MA200 |
| LVS | Las Vegas Sands Corp | Consumer Cyclical | $46.64 | -3.52% | 2026-06-30 | 37.3 | -17.3% | Below MA20, MA50, MA200 |
| ORLY | O'Reilly Automotive, Inc | Consumer Cyclical | $85.40 | -7.85% | 2026-07-06 | 41.1 | -9.8% | Below MA20, MA50, MA200 |
| EXE | Expand Energy Corp | Energy | $88.71 | -18.54% | 2026-06-18 | 44.2 | -14.6% | Above MA20 · Below MA50, MA200 |
| WYNN | Wynn Resorts Ltd | Consumer Cyclical | $96.79 | -10.93% | 2026-05-19 | 38.7 | -14.1% | Below MA20, MA50, MA200 |
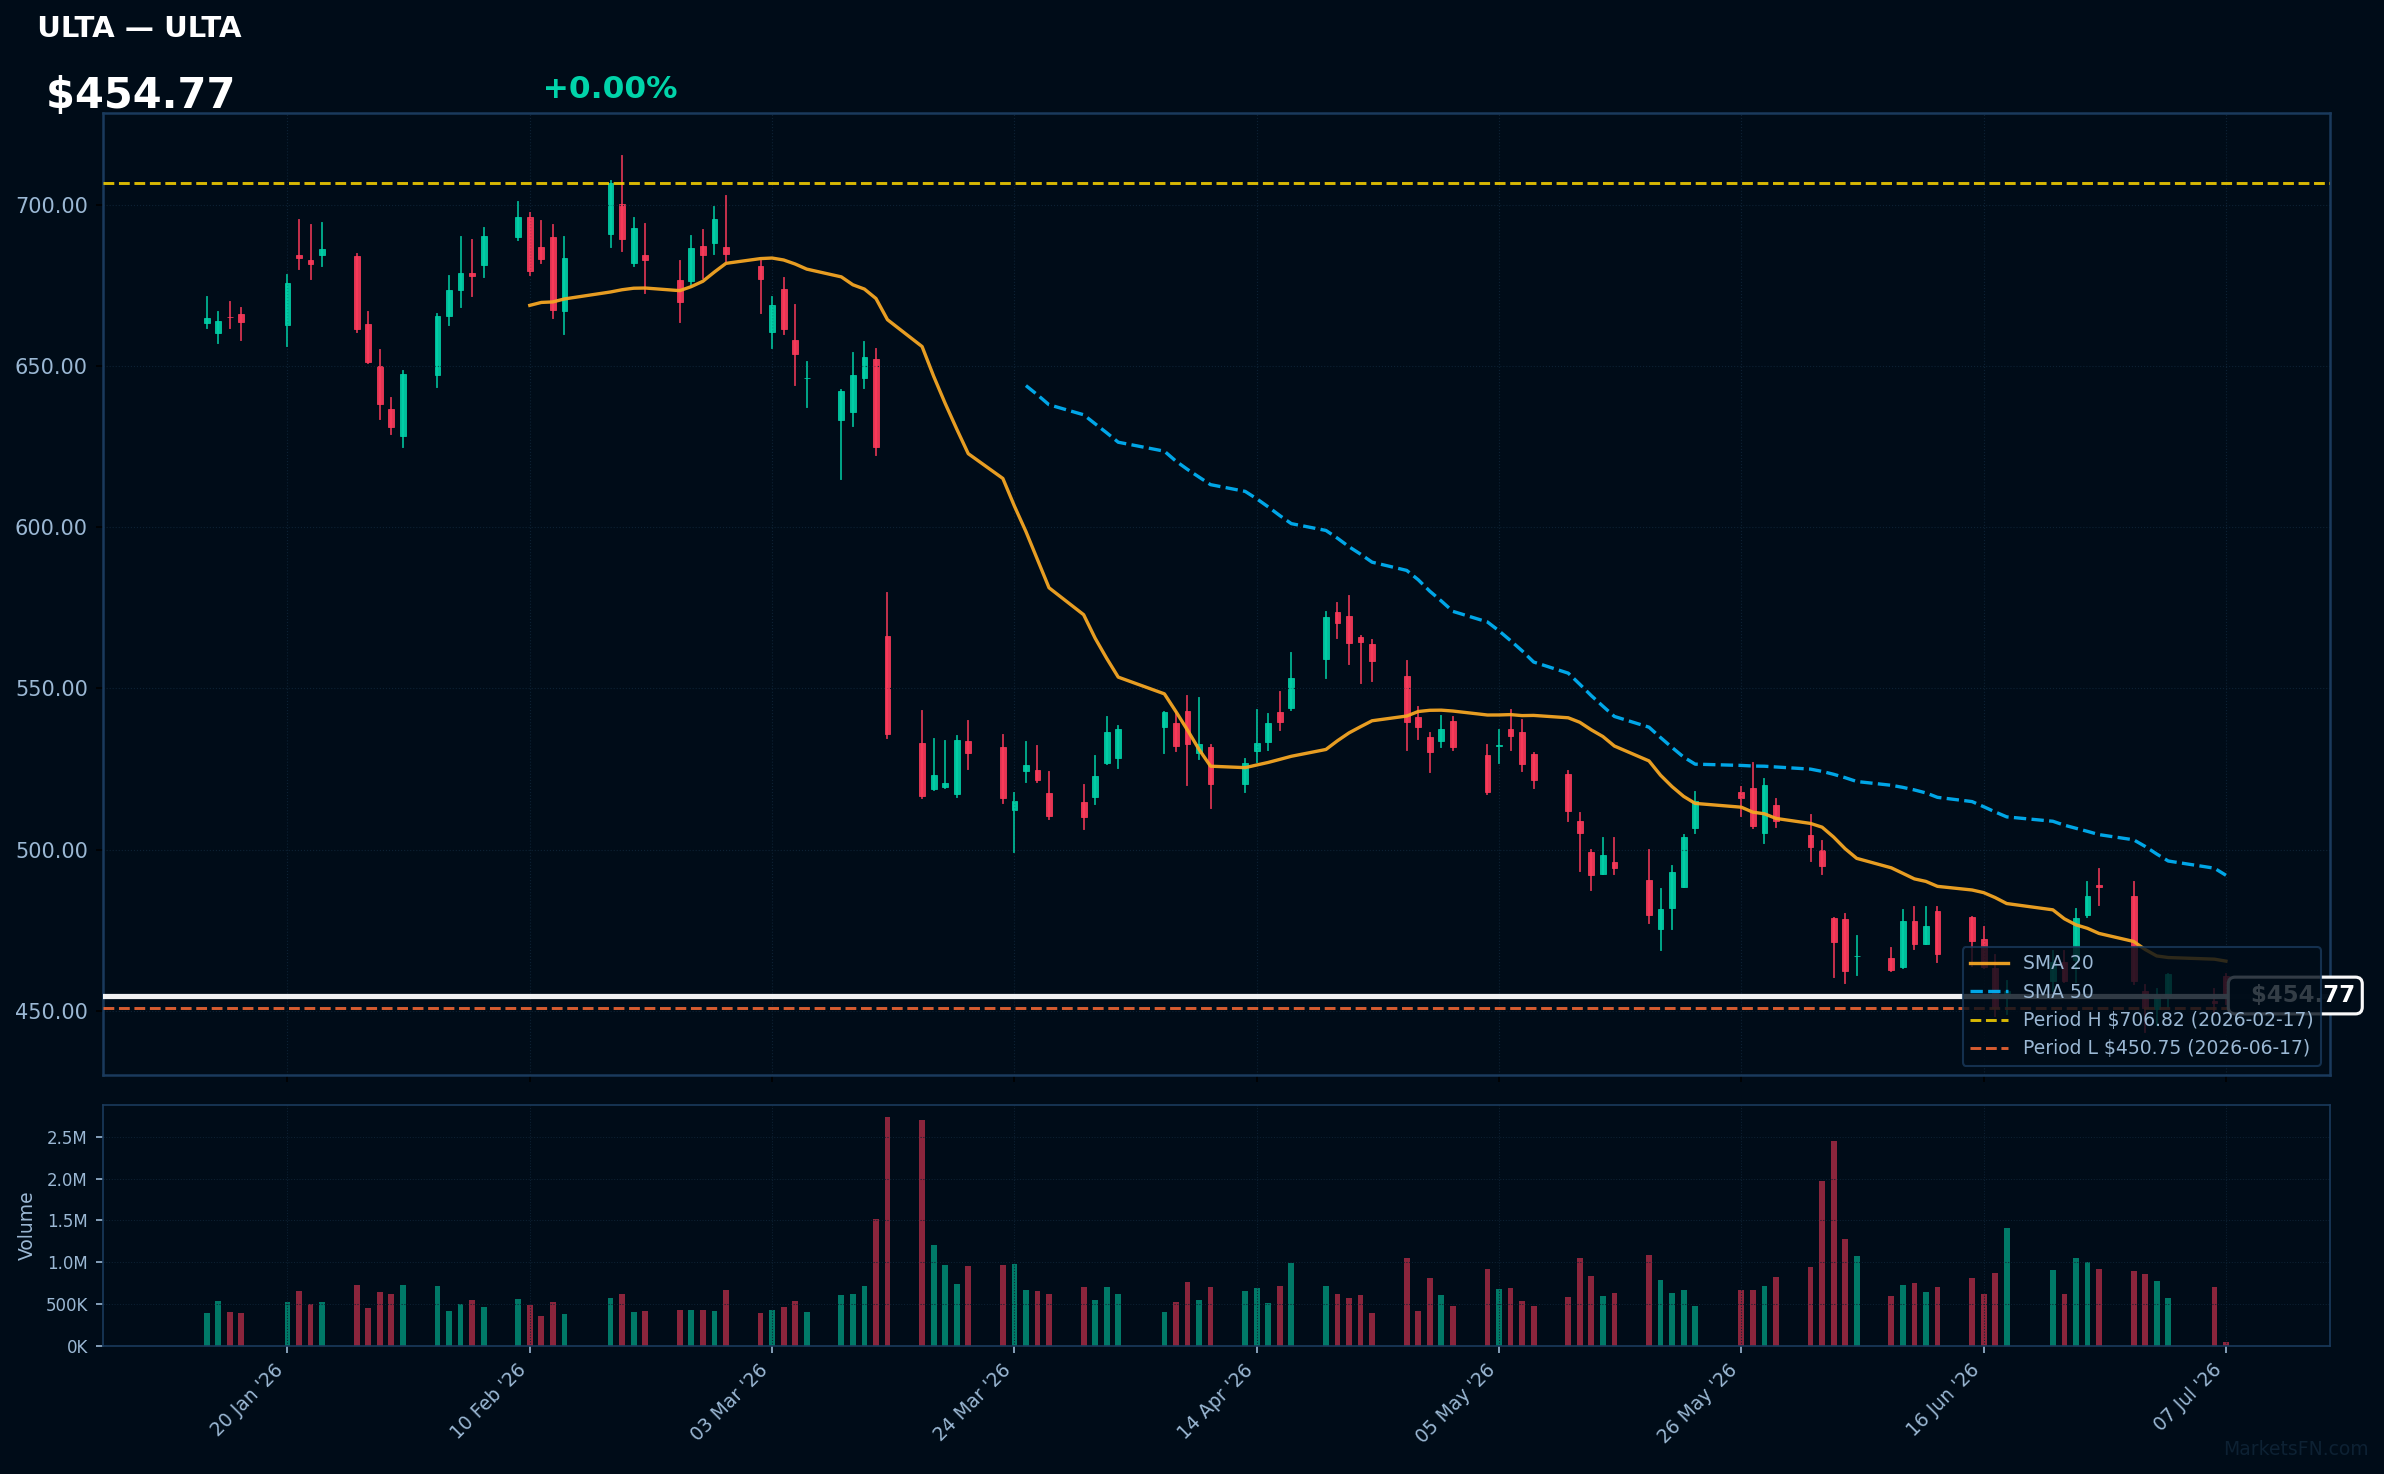
ULTA | Ulta Beauty Inc | Consumer Cyclical | Price Last: $454.72 | % Realized: -4.47% | RSI: 41.9 | % above MA200: -18.9% | Trend: Below MA20, MA50, MA200
Ulta Beauty Inc operates as a beauty retailer offering cosmetics, fragrances, and skincare products across over 1,300 stores. Investors should care due to its significant market presence and growth potential in the beauty industry.
Ulta Beauty Inc's technicals indicate a sustained downtrend with price ($454.77) below MA20, MA50, and MA200. The RSI(14) at 41.9 suggests bearish momentum, and the stock is near its 52-Week low, testing major support.
Related headlines
- Target to replace Ulta shops in 600+ stores with its in-house Beauty Studio
- Bath & Body Works Ulta Beauty launch may expand reach, but channel shift risks remain: Jefferies
- Ulta Beauty CMO on Evolving a 47 Million-Member Loyalty Program into a Relationship Engine
- Bath & Body Works is bringing its products to 600 Ulta Beauty stores
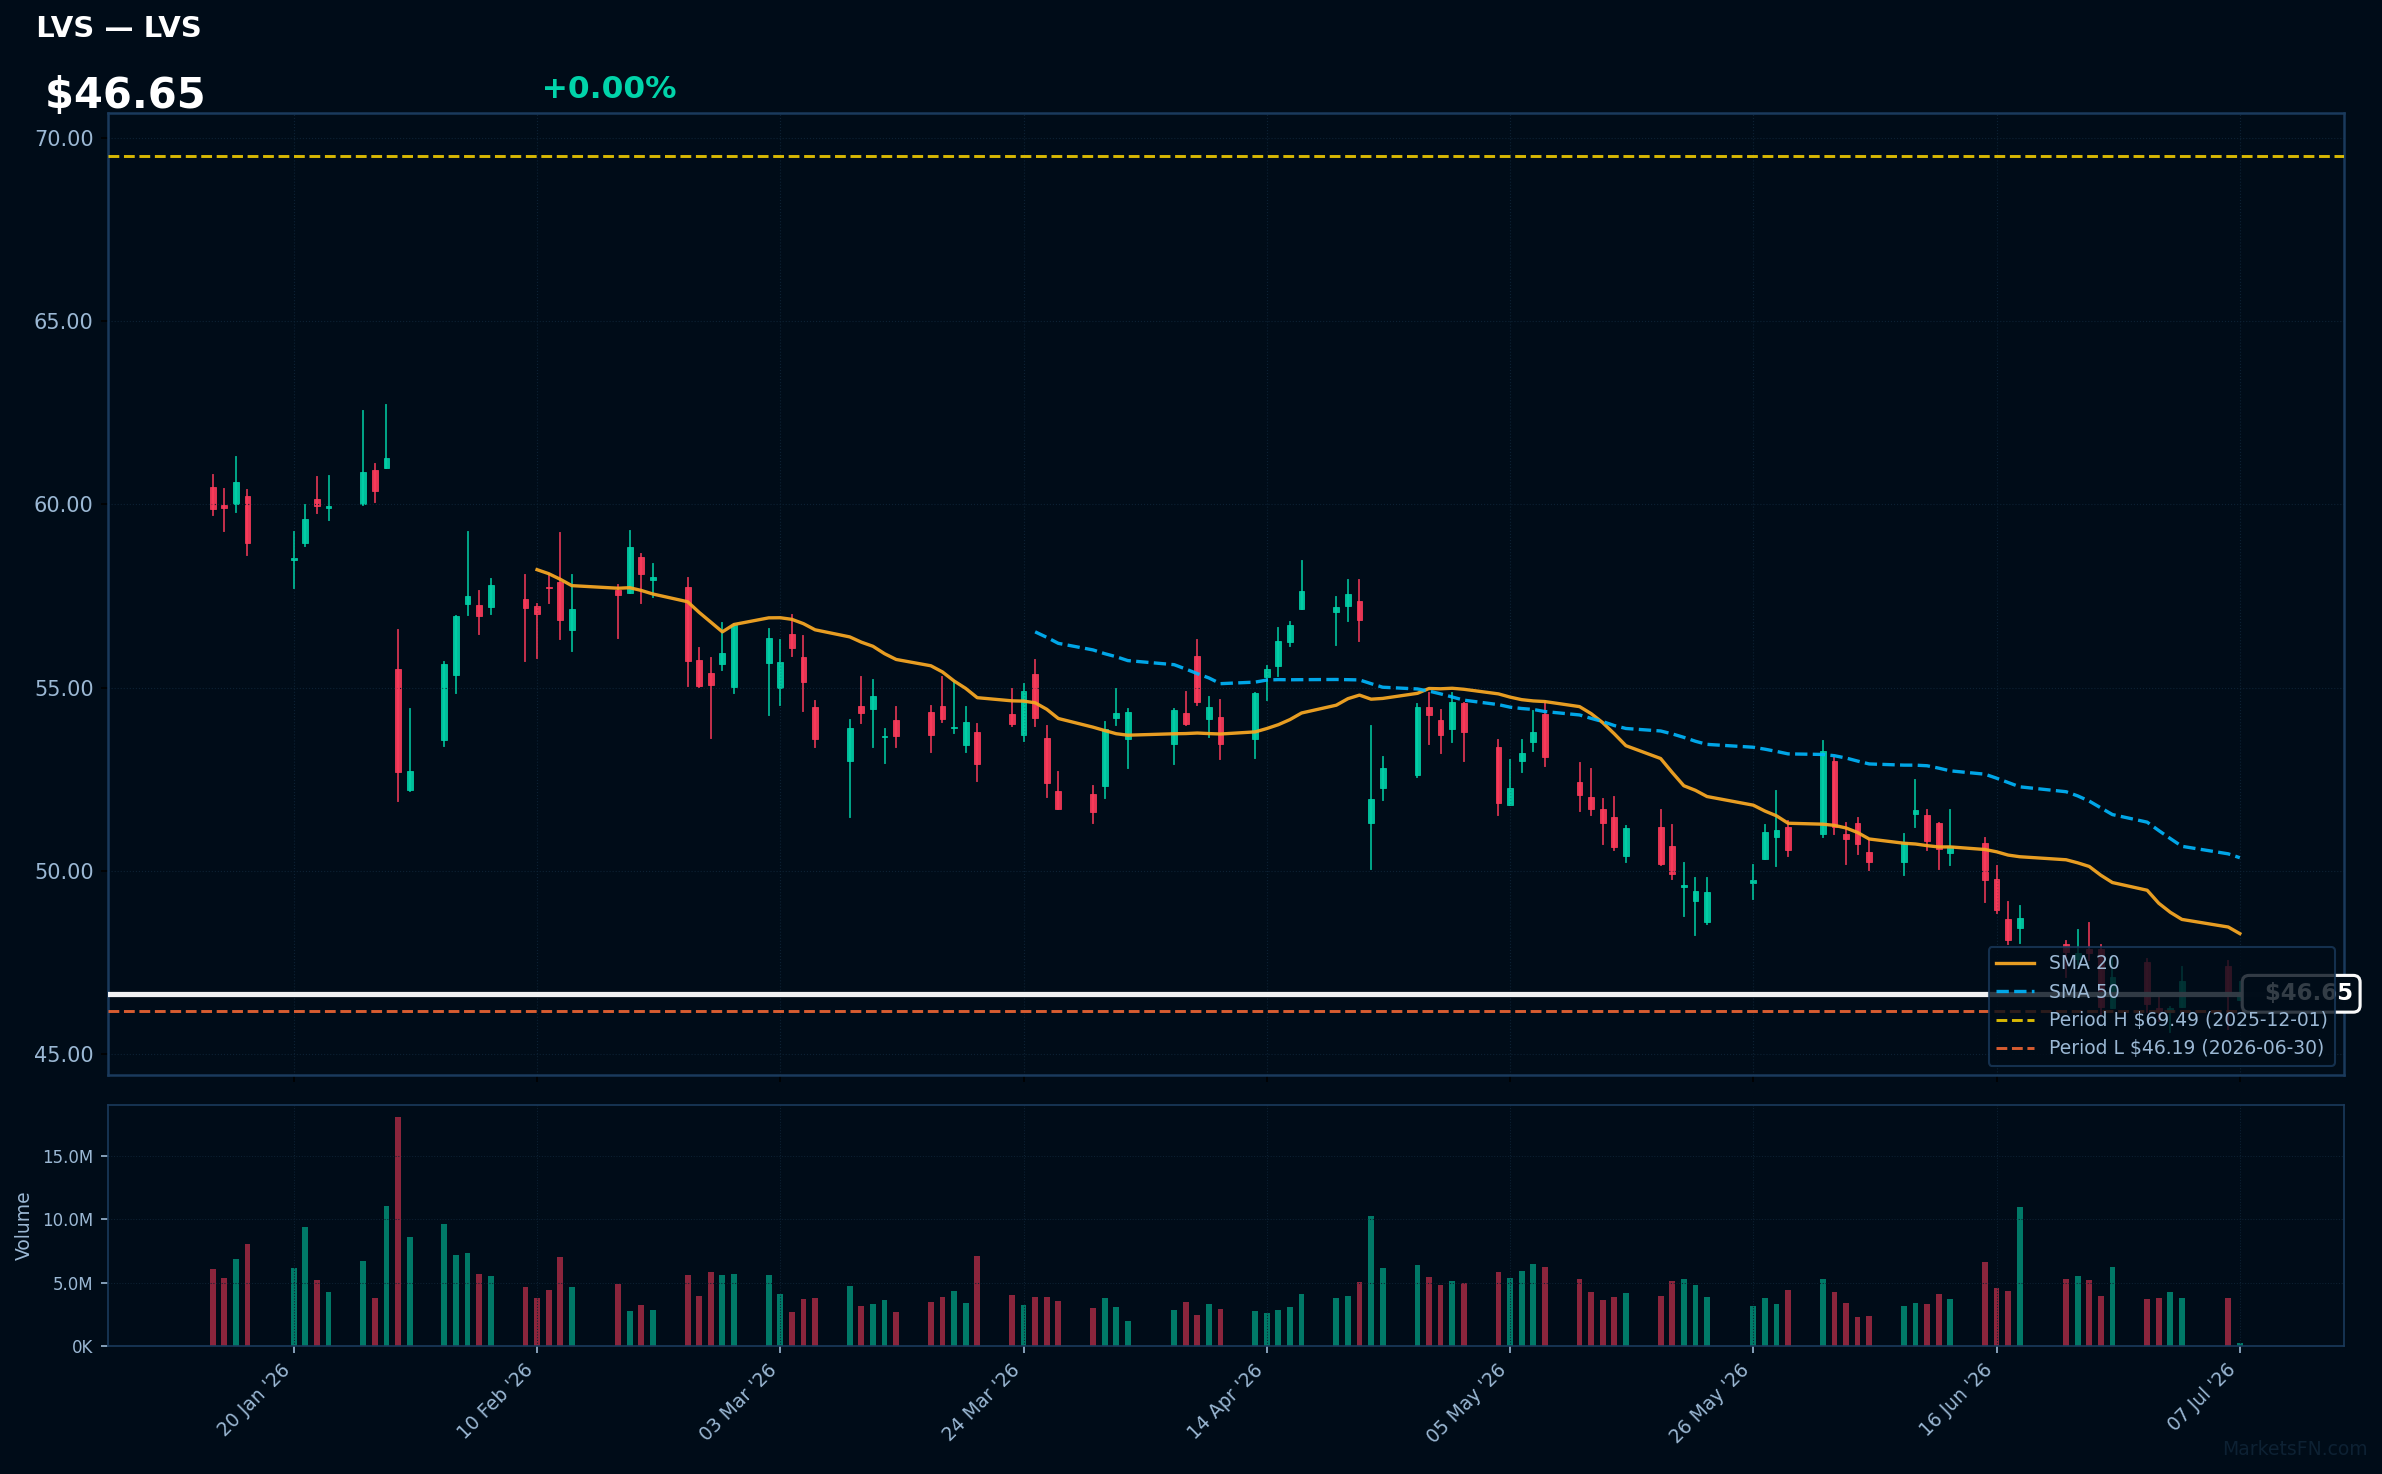
LVS | Las Vegas Sands Corp | Consumer Cyclical | Price Last: $46.64 | % Realized: -3.52% | RSI: 37.3 | % above MA200: -17.3% | Trend: Below MA20, MA50, MA200
Las Vegas Sands Corp operates integrated resorts, including casinos and entertainment venues, generating revenue primarily from gaming and hospitality services. Investors should care about its performance as it reflects demand for luxury leisure and travel.
The stock is in a sustained downtrend with price ($46.65) below MA20, MA50, and MA200. RSI(14) is 37.3, nearing oversold territory, and is 1.0% above its 52-Week low, indicating potential support testing.
Related headlines
- Las Vegas Sands Continues its Commitment to Ending Youth Homelessness in Nevada with a $300,000 Donation to Nevada Partnership for Homeless Youth
- Las Vegas Sands Donates $150,000 to The LGBTQ+ Center of Las Vegas for a Workforce Development Program Supporting Housing-Insecure Youth
- MGMs $18B Bid Proves Las Vegas Sands Is Undervalued
- Las Vegas Sands Continues on the Dow Jones Best-in-Class Indices for World and North America
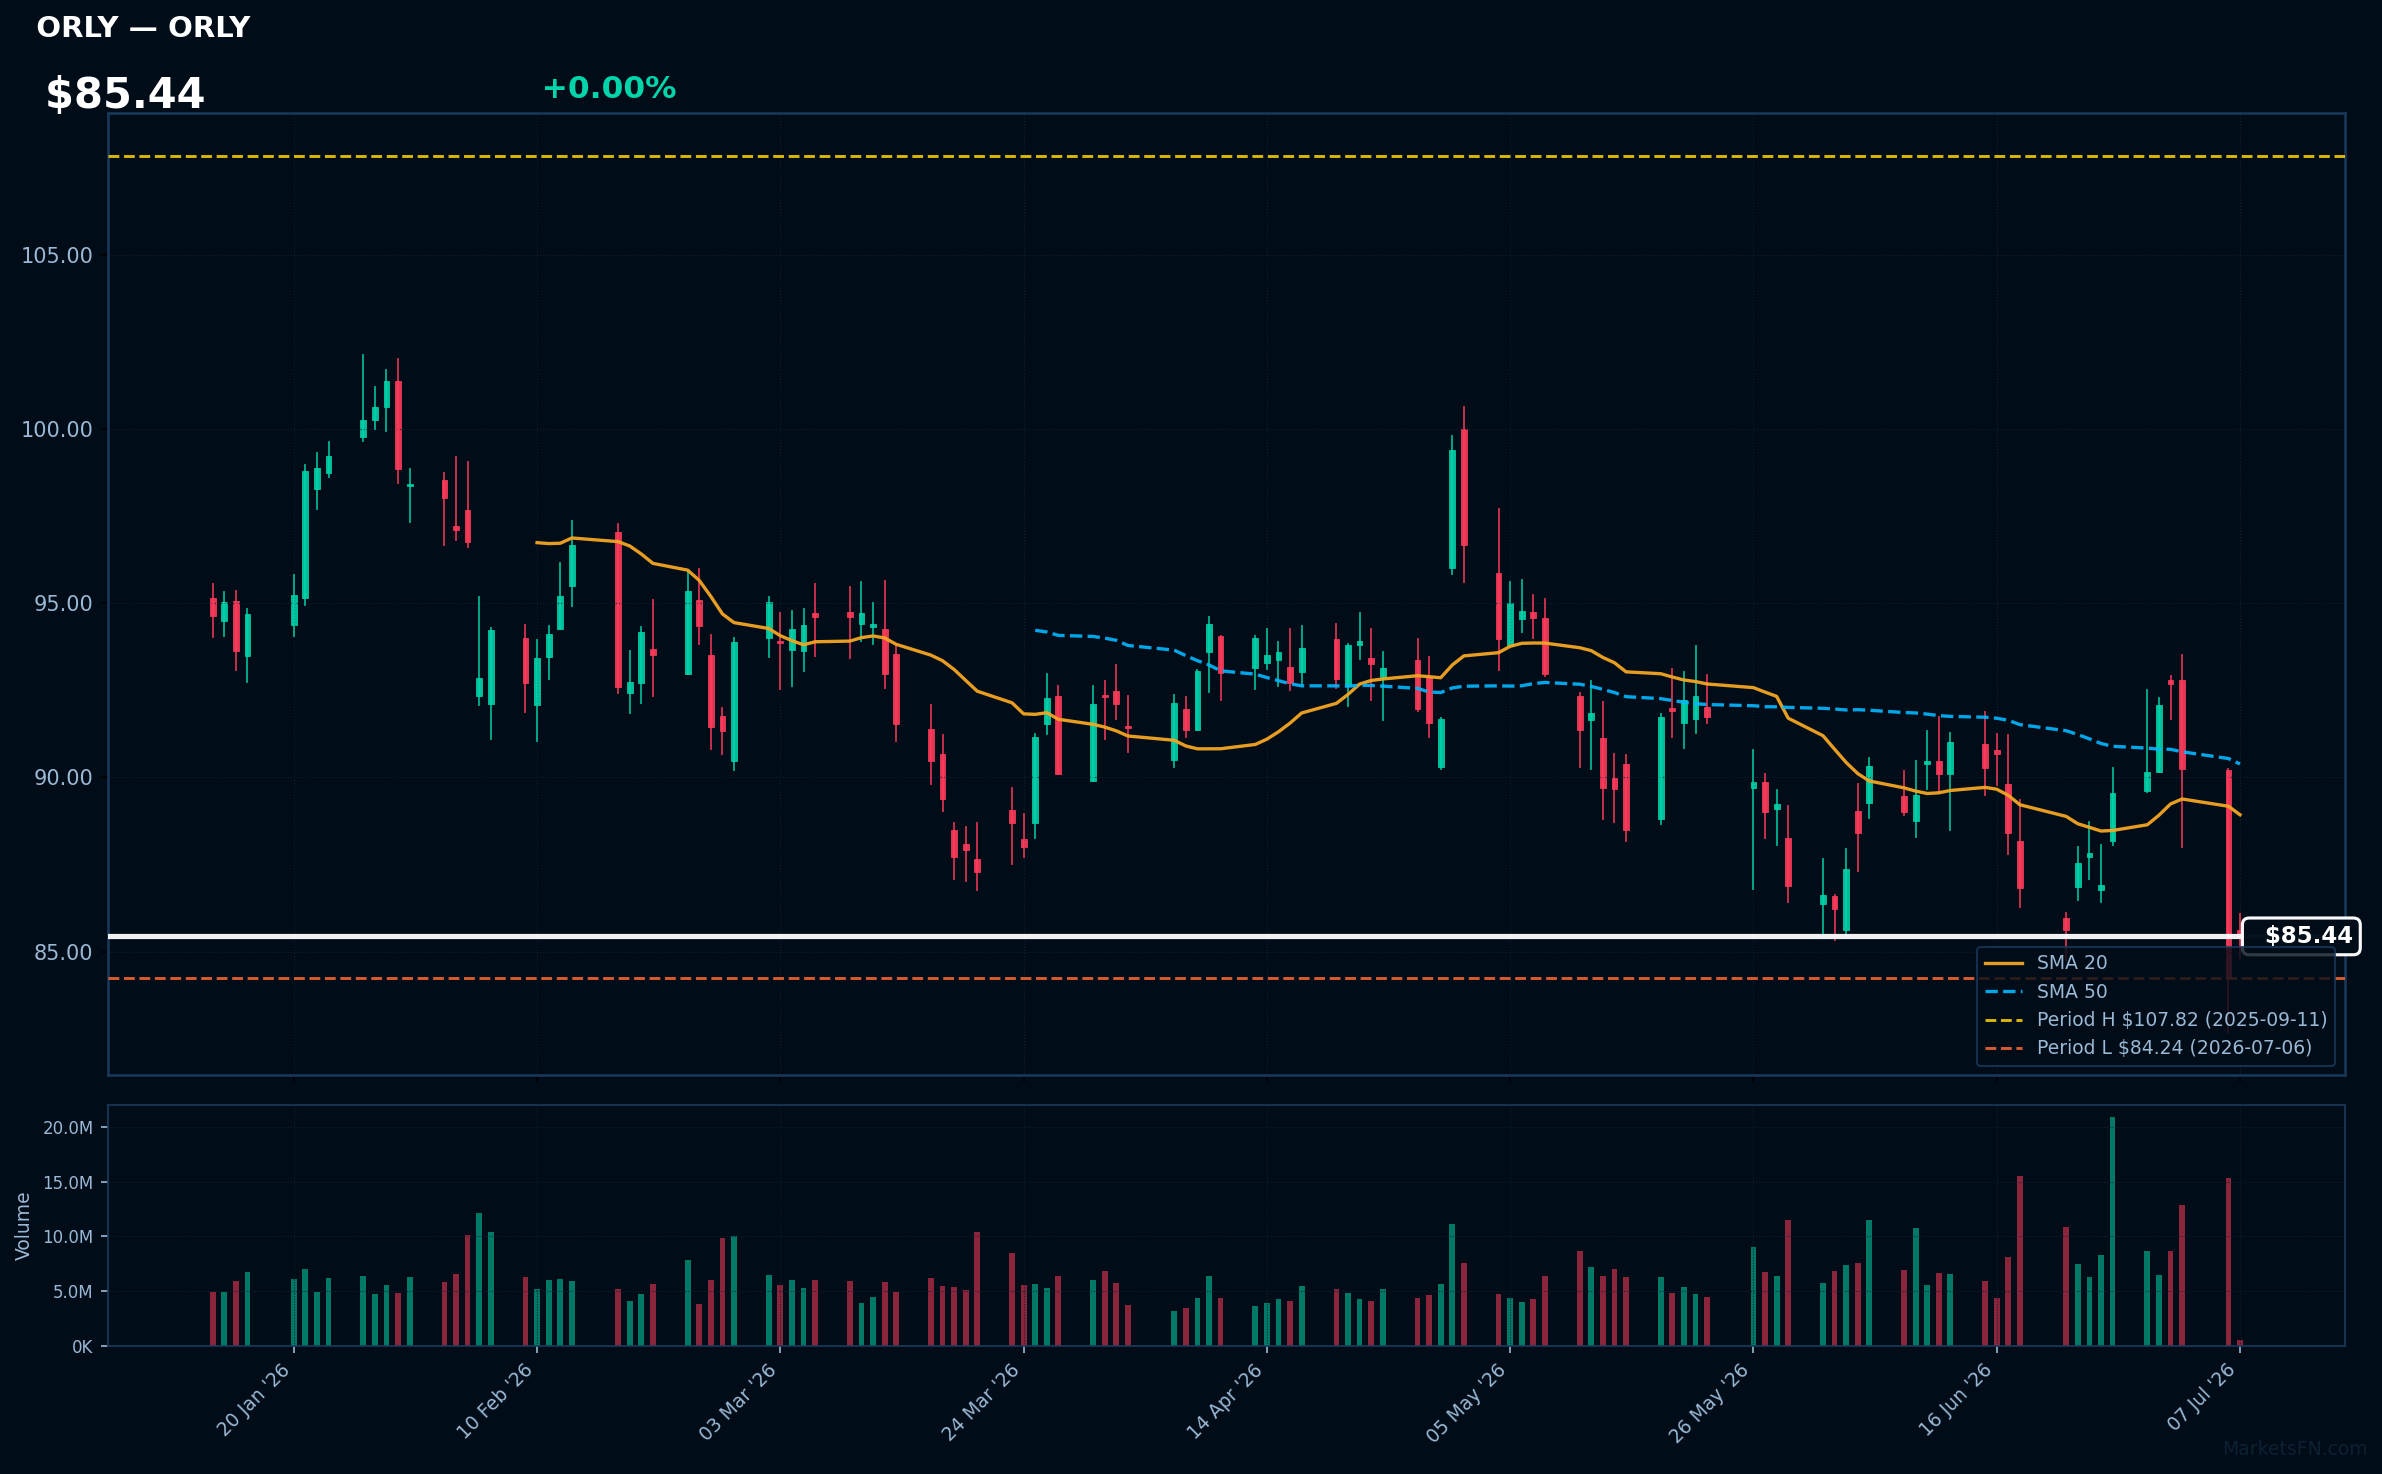
ORLY | O'Reilly Automotive, Inc | Consumer Cyclical | Price Last: $85.40 | % Realized: -7.85% | RSI: 41.1 | % above MA200: -9.8% | Trend: Below MA20, MA50, MA200
O'Reilly Automotive, Inc (ORLY) operates a network of retail stores selling automotive parts and accessories. Investors should care because its performance reflects the health of the aftermarket auto parts industry, influenced by factors like vehicle age and DIY repair trends.
ORLY's technicals indicate a sustained downtrend with price ($85.44) below MA20, MA50, and MA200. The RSI(14) is 41.1, nearing oversold territory. The stock is 1.4% above its 52-Week low, testing major support, with a -7.8% 52-Week return, signaling potential further downside.
Related headlines
- Why Did REE, HTZ, ORLY Stocks Slump To 52-Week Lows Today?
- O'Reilly Stock Sinks on Report of Possible NAPA Bid
- GPC Stock Pops 13%, ORLY Falls 5% OReilly Makes Cash Bid For Genuine Parts $10B Auto Unit, Says Report
- O'Reilly Automotive, Inc. Announces Dates for Its Second Quarter 2026 Earnings Release and Conference Call
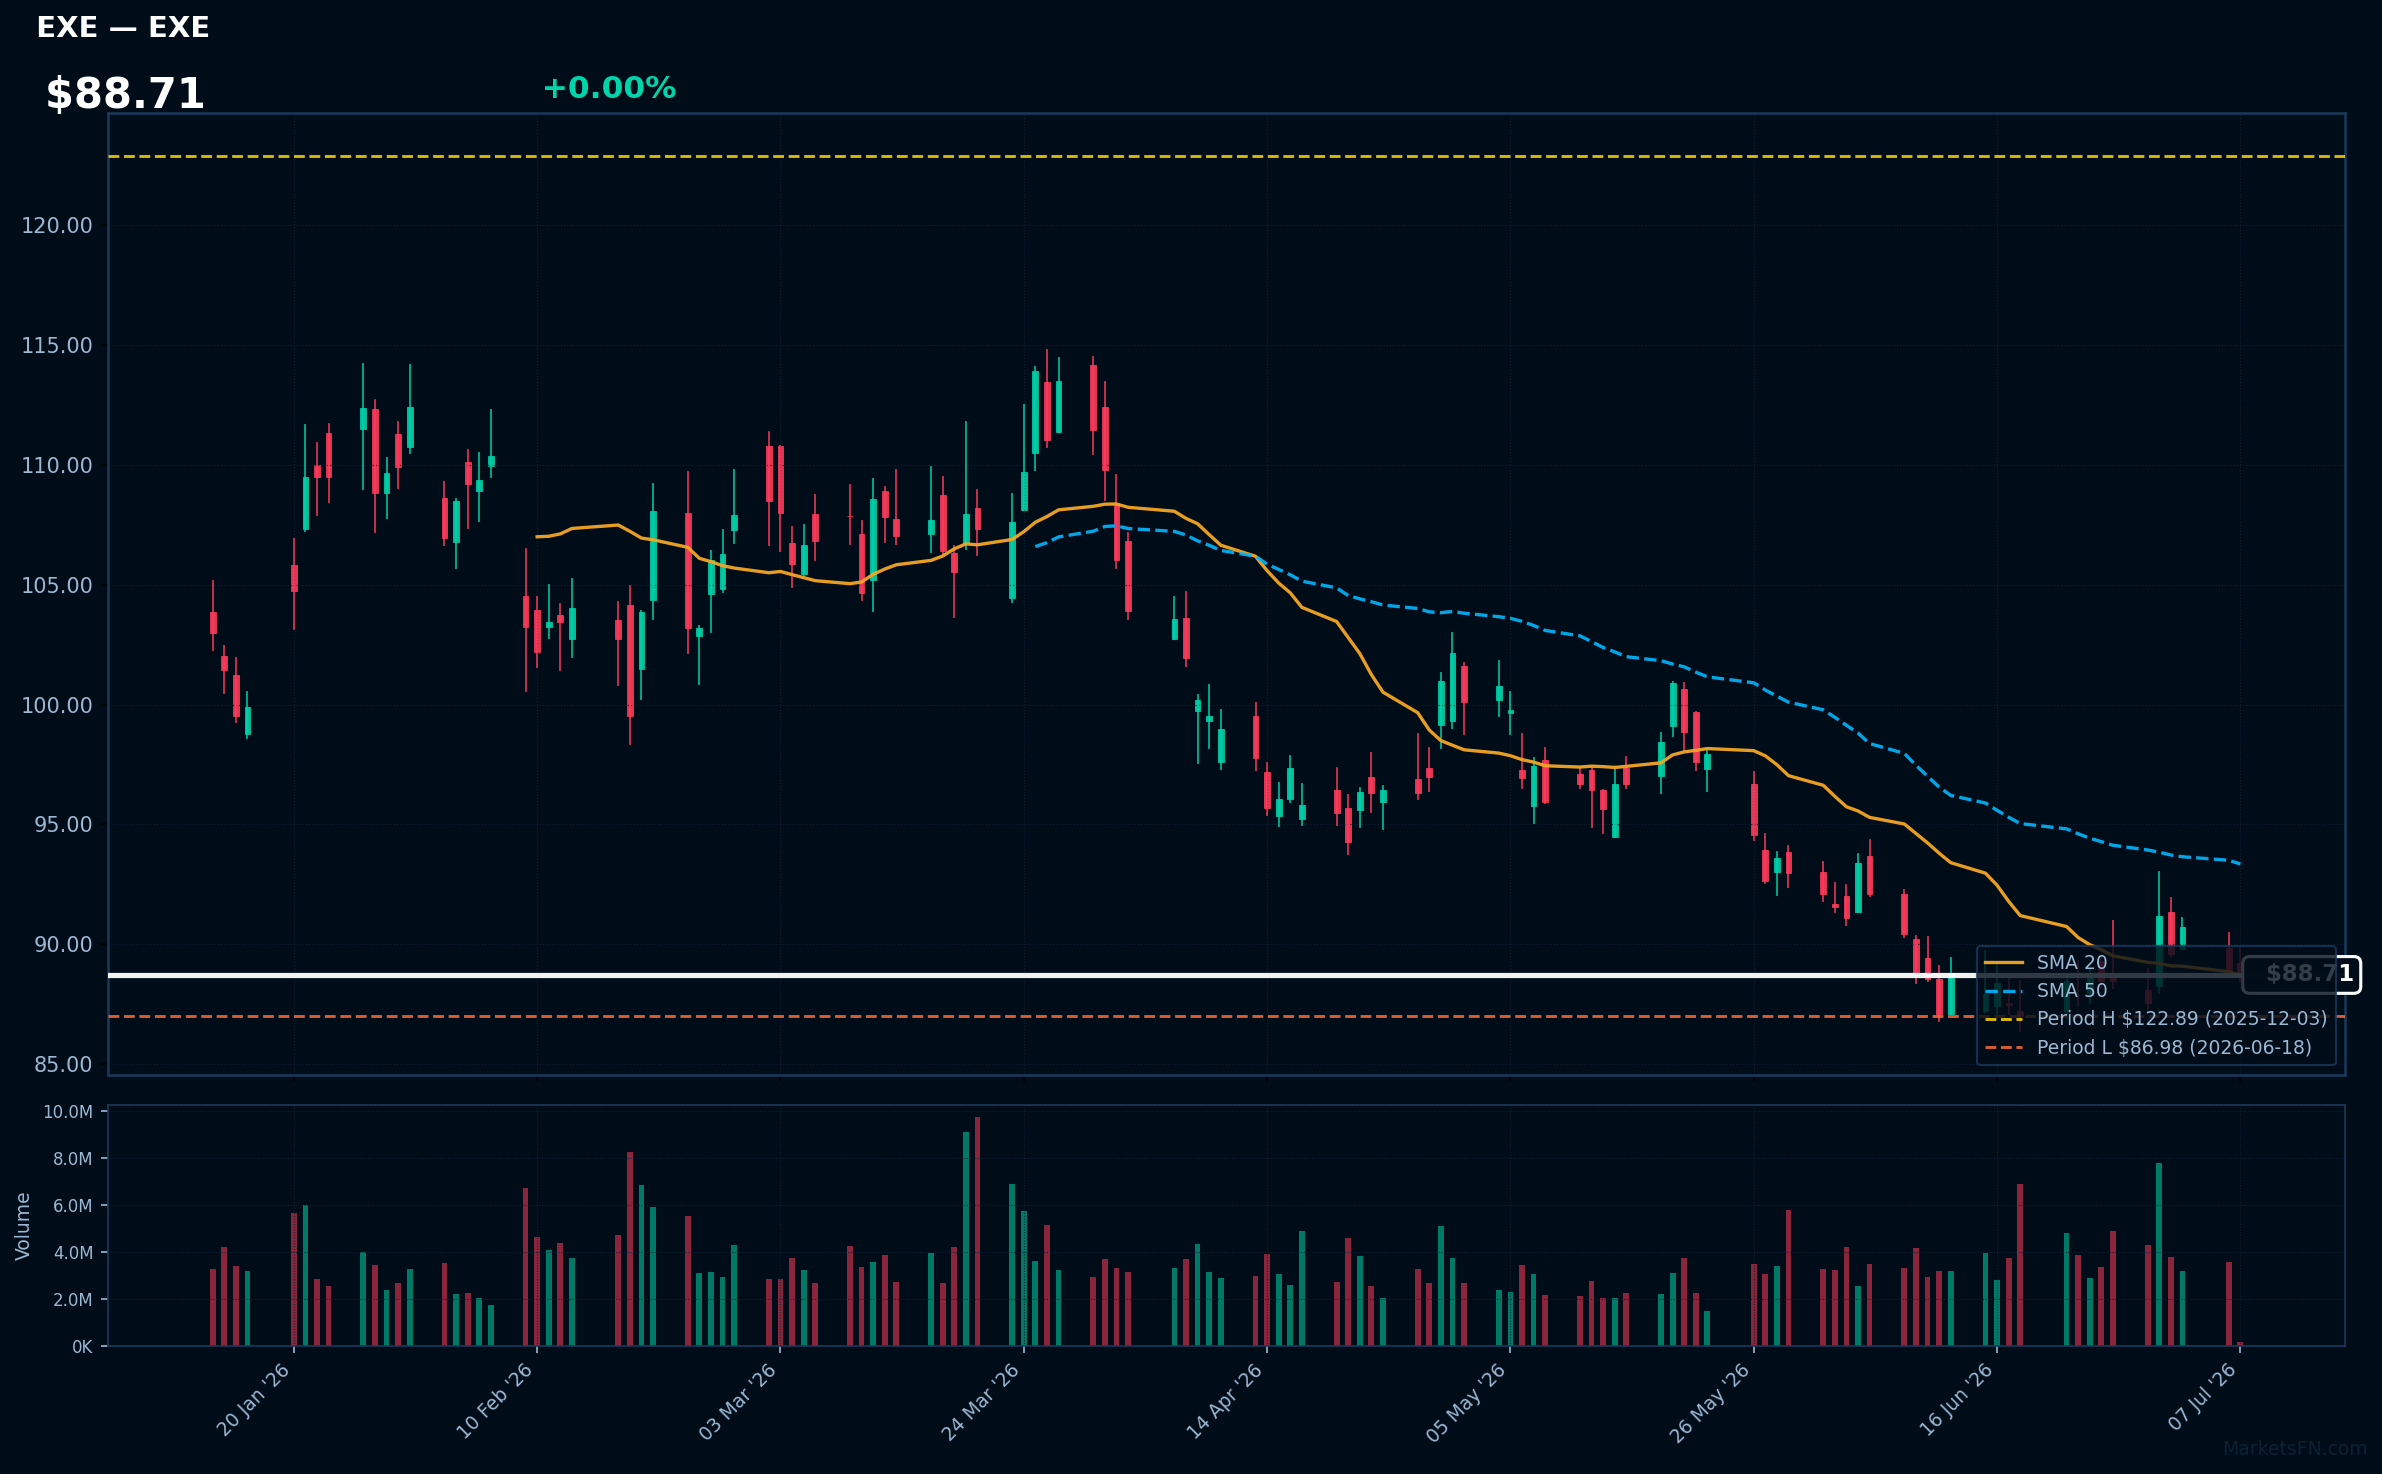
EXE | Expand Energy Corp | Energy | Price Last: $88.71 | % Realized: -18.54% | RSI: 44.2 | % above MA200: -14.6% | Trend: Above MA20 · Below MA50, MA200
Expand Energy Corp's business specifics are not provided, making it difficult to assess its investment appeal beyond technicals.
The stock is testing major support, 2.0% above its 52-Week low, with an RSI(14) of 44.2 and mixed MA signals (above MA20, below MA50/MA200), indicating a lack of clear momentum or fundamental strength, potentially a warning sign.
Related headlines
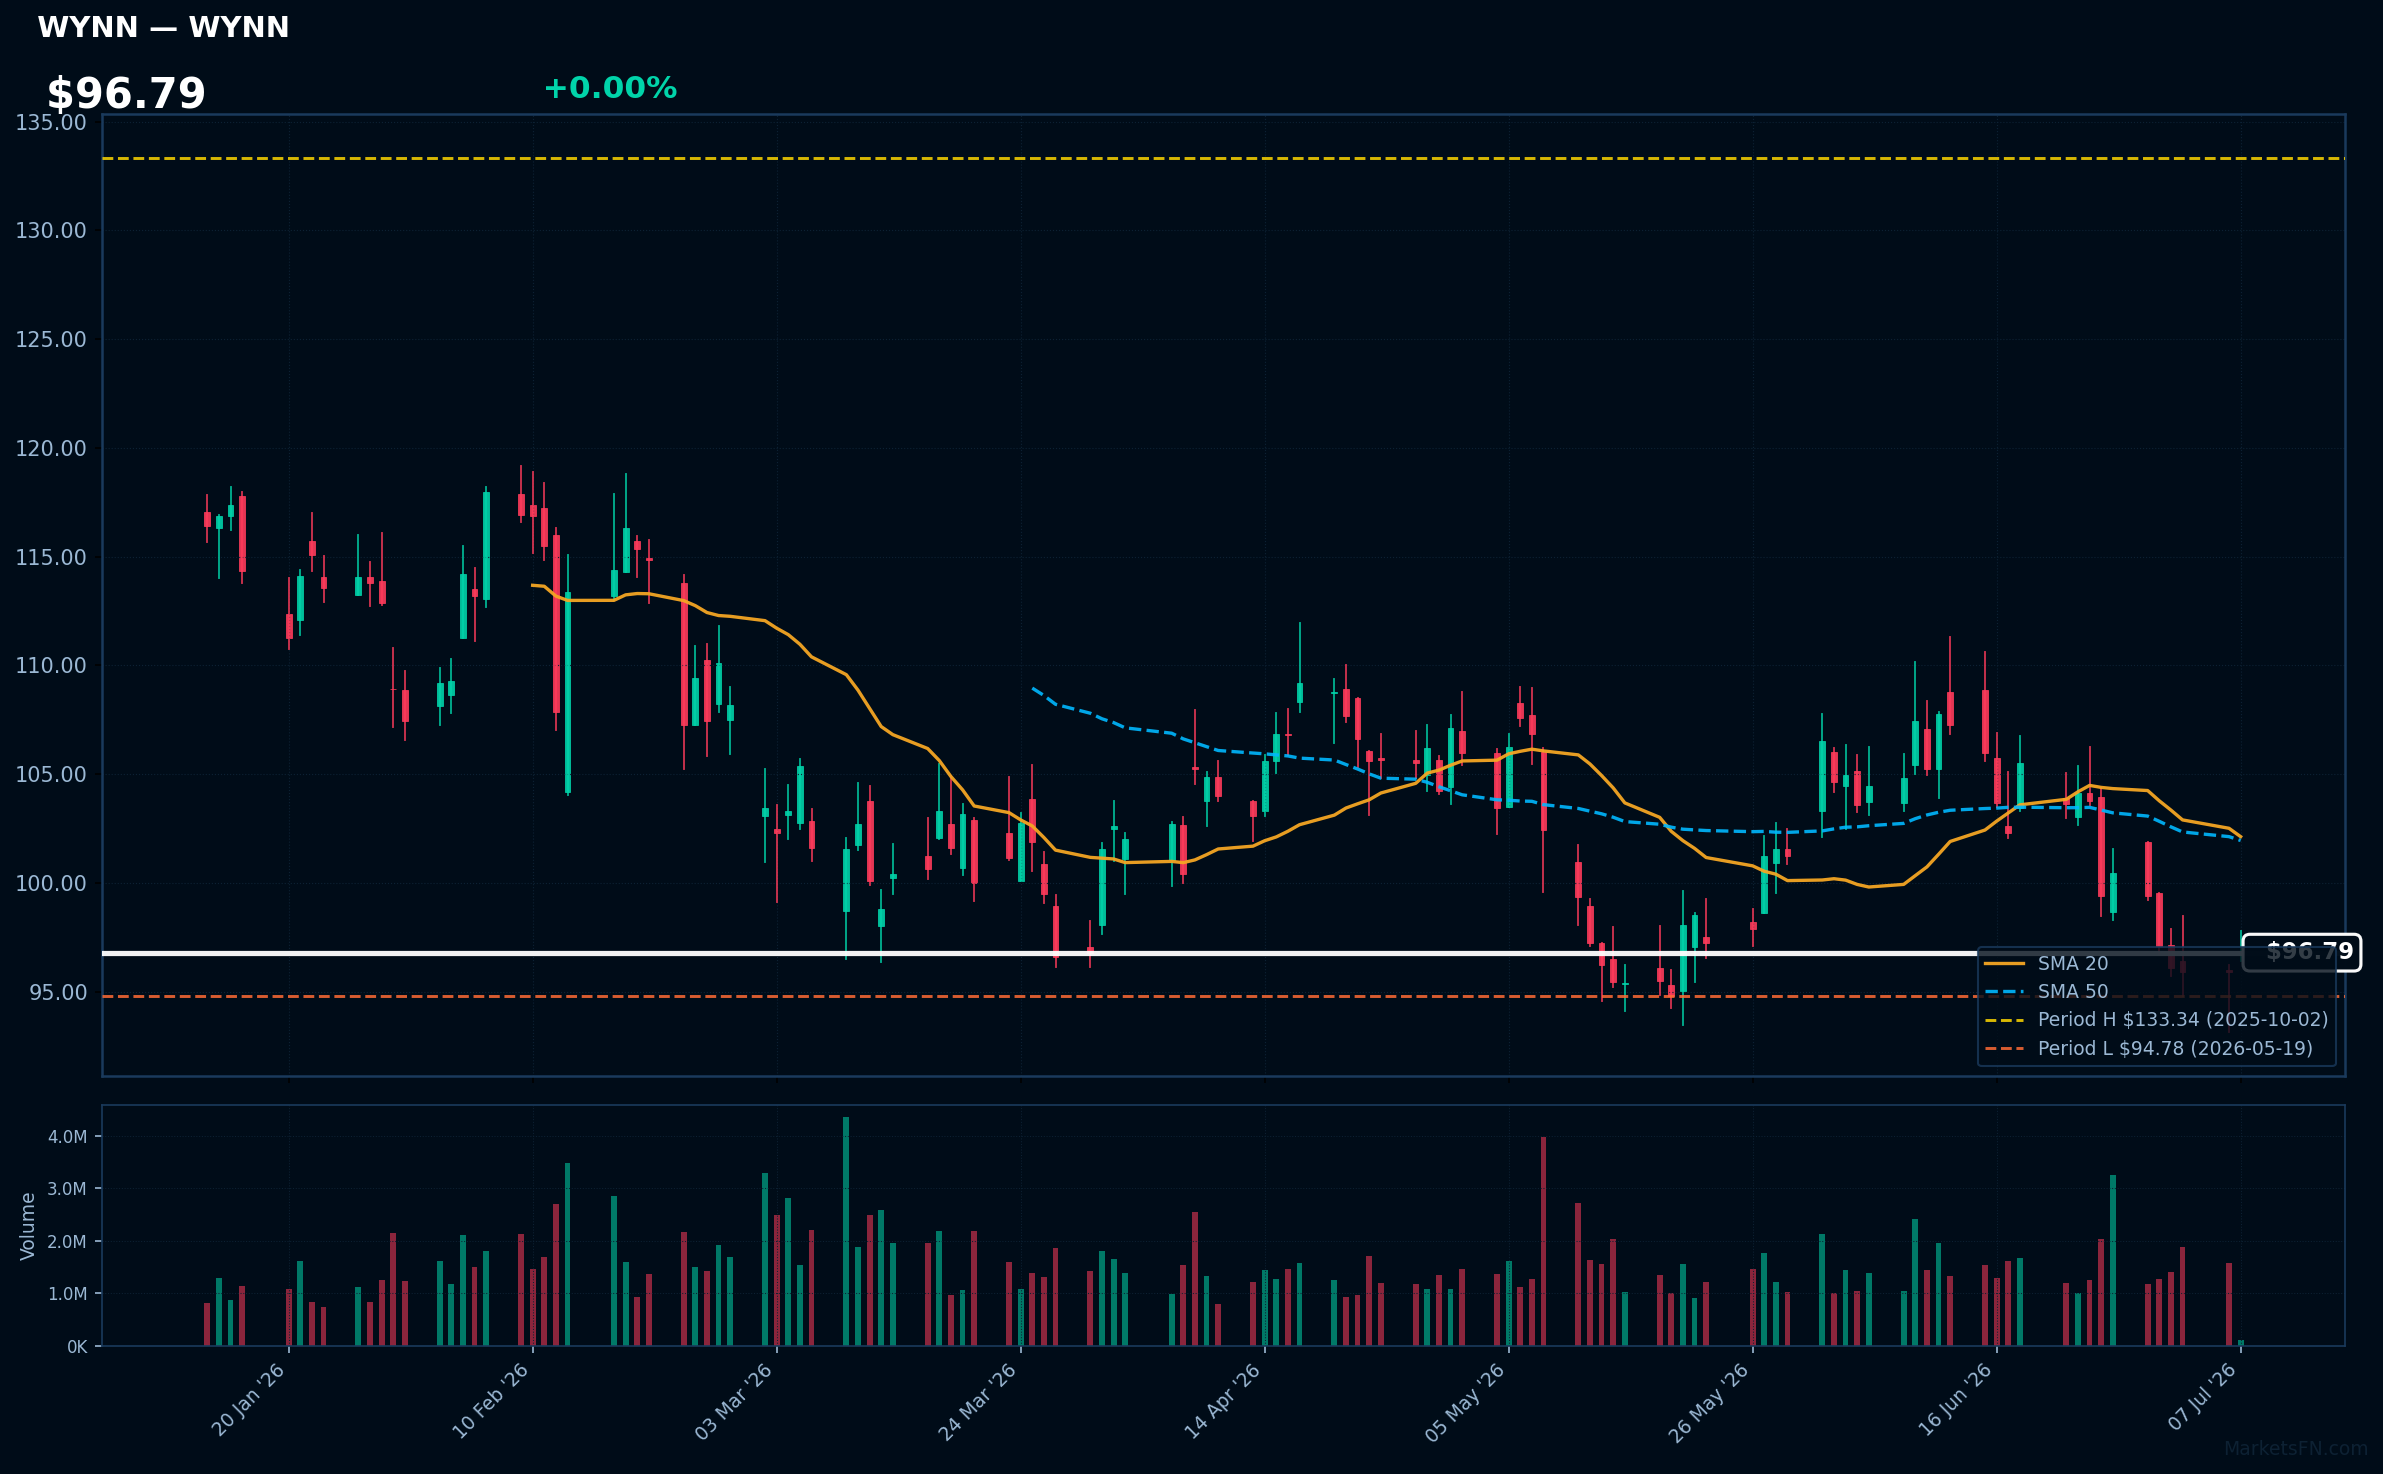
WYNN | Wynn Resorts Ltd | Consumer Cyclical | Price Last: $96.79 | % Realized: -10.93% | RSI: 38.7 | % above MA200: -14.1% | Trend: Below MA20, MA50, MA200
Wynn Resorts Ltd operates luxury casinos and hotels. Investors should care because its performance reflects demand for high-end leisure and hospitality services, with potential implications for the broader gaming and tourism sectors.
Wynn Resorts Ltd is testing major support, 2.1% above its 52-Week low, with an RSI(14) of 38.7, indicating oversold conditions, and is below MA20, MA50, and MA200, showing mixed signals and a potential warning sign for further downside.
Related headlines
Market Commentary
The S&P 500 stocks near 52-week extremes indicate a significant market trend. Stocks like JPM, LLY, JNJ, BAC, and KO are at their 52-week highs, while ULTA, LVS, ORLY, EXE, and WYNN are near their 52-week lows. This suggests a divergence in market performance, with certain sectors outperforming others.
The stocks at 52-week highs are primarily from the financial and healthcare sectors, indicating a potential rotation towards defensive and stable industries. In contrast, the stocks near 52-week lows are from the consumer discretionary and energy sectors, suggesting a potential slowdown in these areas. Macro themes such as interest rates, economic growth, and consumer spending may be driving these price levels.
Key levels to watch include the 52-week highs and lows for these stocks, as well as any catalysts that may drive them further. For the stocks at 52-week highs, a continued stable economic environment may support their current levels. For the stocks near 52-week lows, potential catalysts such as earnings reports or industry trends may trigger a rebound or further decline.
Methodology: All 503 S&P 500 constituents screened. 52-week high = highest daily close over the past 252 trading days (approx. 1 year). 52-week low = lowest daily close over the same period. Distance = (current price / extreme − 1) × 100. Technical indicators computed on up to 1 year of daily OHLCV data.
Disclaimer: For informational purposes only. Not investment advice. Past performance is not indicative of future results.

