S&P 500 2026 YTD Highs & Lows Radar: Microsoftoration (MSFT), NRG Energy (NRG) and more
MarketsFN Team

S&P 500 2026 YTD Highs & Lows Radar: Microsoftoration (MSFT), NRG Energy (NRG) and more
Screening all 503 S&P 500 constituents for stocks nearest to their 2026 year-to-date high and their 2026 YTD low. Data as of August 31, 2026. % Realized = total return since Jan 1 2026.
Legend: RSI > 70 = overbought · RSI < 30 = oversold · Green % Realized = positive YTD return · Red = negative.
📈 Nearest to 2026 High
Sectors represented: Technology (3), Energy (2)
| Ticker | Company | Sector | Price Last | % Realized | 2026 YTD High Date | RSI | % above MA200 | Trend |
|---|---|---|---|---|---|---|---|---|
| MSFT | Microsoft Corporation | Technology | $513.53 | +8.58% | 2026-08-28 | 69.1 | +19.1% | Above MA20, MA50, MA200 |
| PLTR | Palantir Technologies Inc | Technology | $186.29 | +10.98% | 2026-08-28 | 68.1 | +23.1% | Above MA20, MA50, MA200 |
| ADP | Automatic Data Processing Inc | Technology | $287.48 | +13.68% | 2026-08-28 | 68.3 | +21.6% | Above MA20, MA50, MA200 |
| MPC | Marathon Petroleum Corp | Energy | $368.83 | +123.34% | 2026-08-28 | 73.1 | +55.0% | Above MA20, MA50, MA200 |
| PSX | Phillips 66 | Energy | $244.01 | +86.88% | 2026-08-28 | 73.1 | +43.5% | Above MA20, MA50, MA200 |
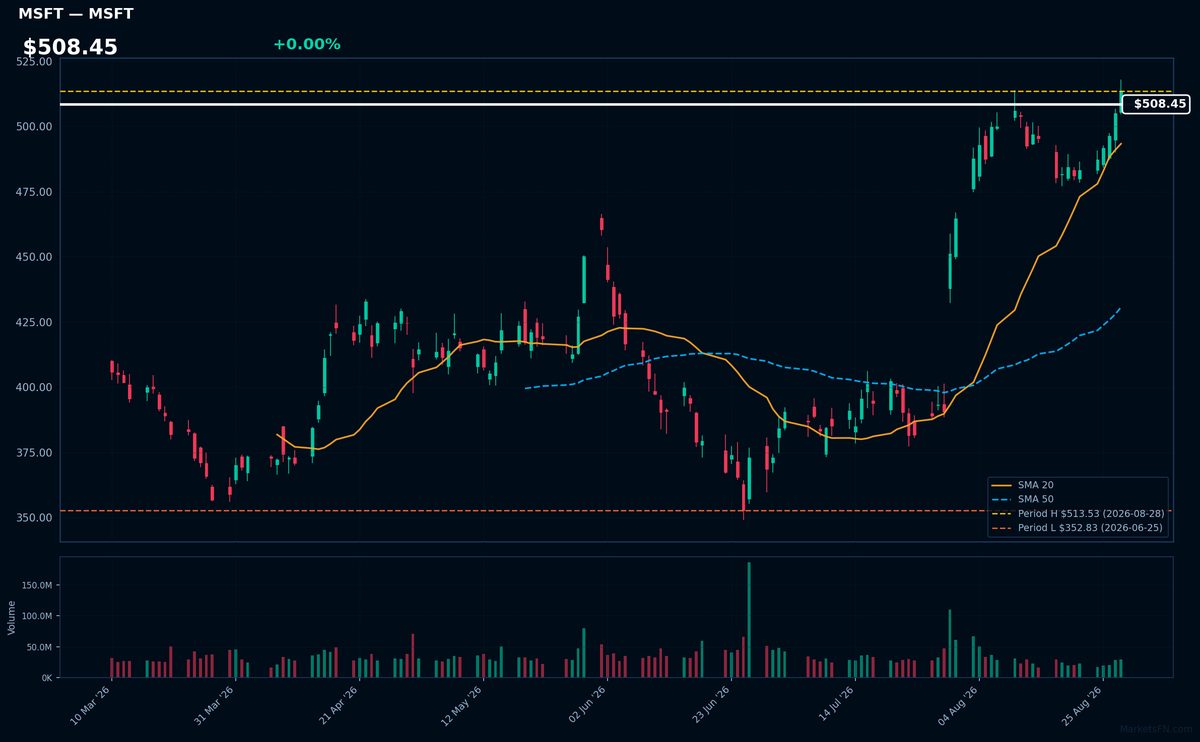
MSFT | Microsoft Corporation | Technology | Price Last: $513.53 | % Realized: +8.58% | RSI: 69.1 | % above MA200: +19.1% | Trend: Above MA20, MA50, MA200
Microsoft Corporation is a technology company that develops, licenses, and supports software, hardware, and services, including its Azure cloud platform and Office productivity suite, driving growth through enterprise software and cloud computing adoption.
Microsoft's current technical situation indicates sustained uptrend momentum with RSI(14) at 69.1 and bullish MA alignment (price > MA20 > MA50 > MA200). The stock is near its 2026 YTD high, 0.0% below, suggesting a potential breakout.
Related headlines
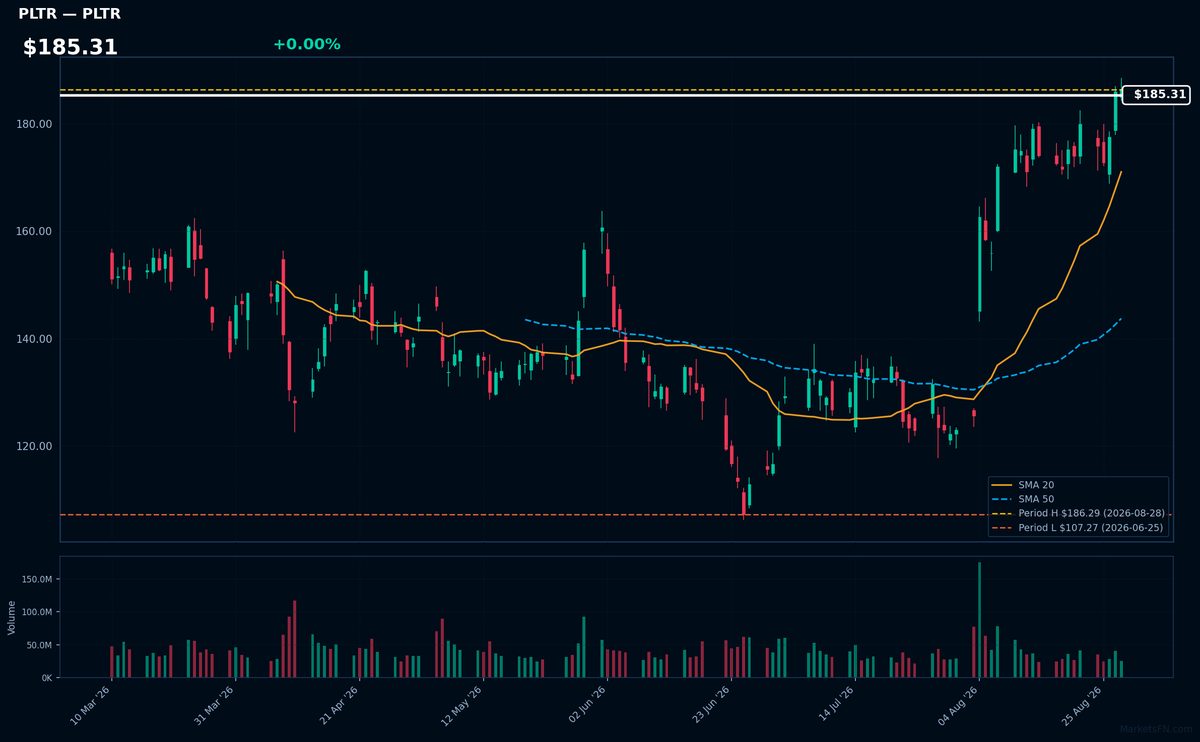
PLTR | Palantir Technologies Inc | Technology | Price Last: $186.29 | % Realized: +10.98% | RSI: 68.1 | % above MA200: +23.1% | Trend: Above MA20, MA50, MA200
Palantir Technologies Inc provides data analytics software to integrate, analyze, and visualize complex data for government and commercial clients, enabling informed decision-making. Investors should care as its software is used in critical applications such as defense, healthcare, and finance.
Palantir's current technical situation indicates momentum, with an RSI(14) of 68.1 and price above MA20, MA50, and MA200. The stock is near its 2026 YTD high, up 11.0% YTD, suggesting potential for further breakout.
Related headlines
- Can PLTR Stock Live Up To Its Multiple?
- As Palantir Stock Jumps, An Income-Generating Trade Aims For A Big Annualized Return
- Meta, Palantir, Paramount Skydance Hedge Trump Ties by Courting Democrats as Midterms Raise Prospect of House Flip: Report
- 3 Reasons Growth Investors Will Love Palantir Technologies (PLTR)
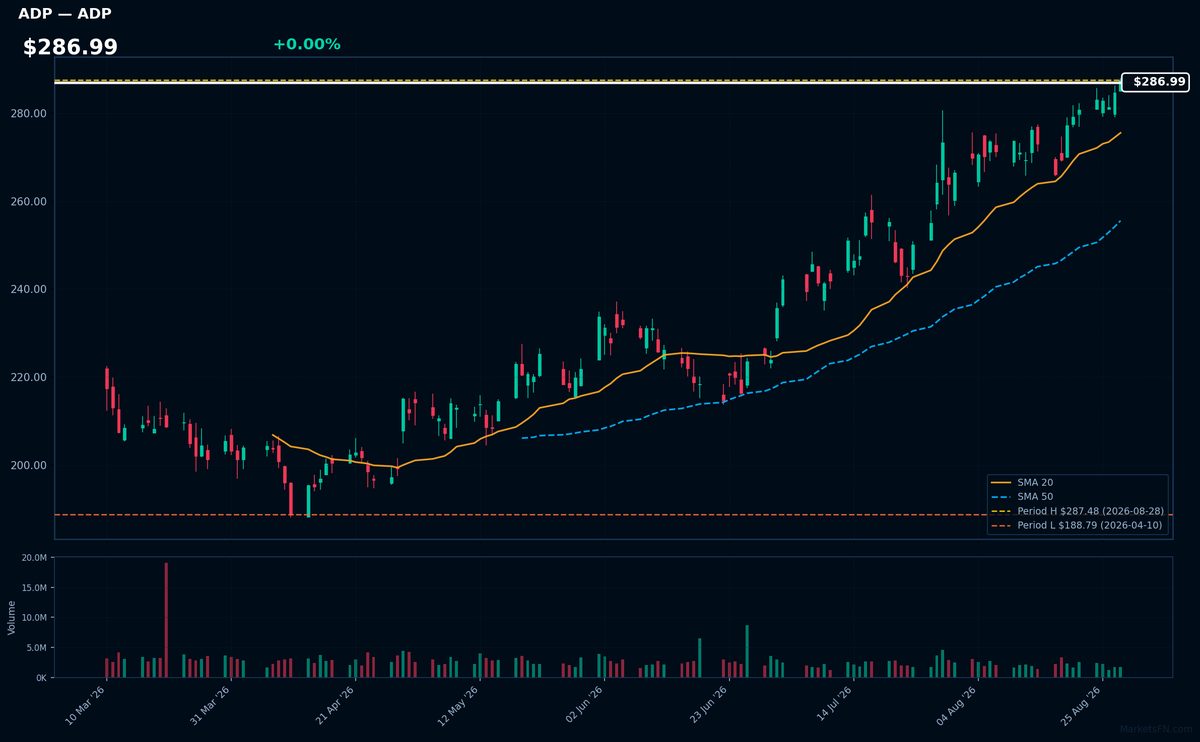
ADP | Automatic Data Processing Inc | Technology | Price Last: $287.48 | % Realized: +13.68% | RSI: 68.3 | % above MA200: +21.6% | Trend: Above MA20, MA50, MA200
Automatic Data Processing Inc provides payroll processing, human capital management, and data-driven solutions to businesses. Investors should care because its services are essential to companies, generating recurring revenue and stable cash flows.
ADP's technicals indicate sustained uptrend with price > MA20 > MA50 > MA200, RSI(14) at 68.3, near its 2026 YTD high. This suggests momentum, with 13.7% 2026 YTD return, but proximity to a potential breakout level warrants monitoring.
Related headlines
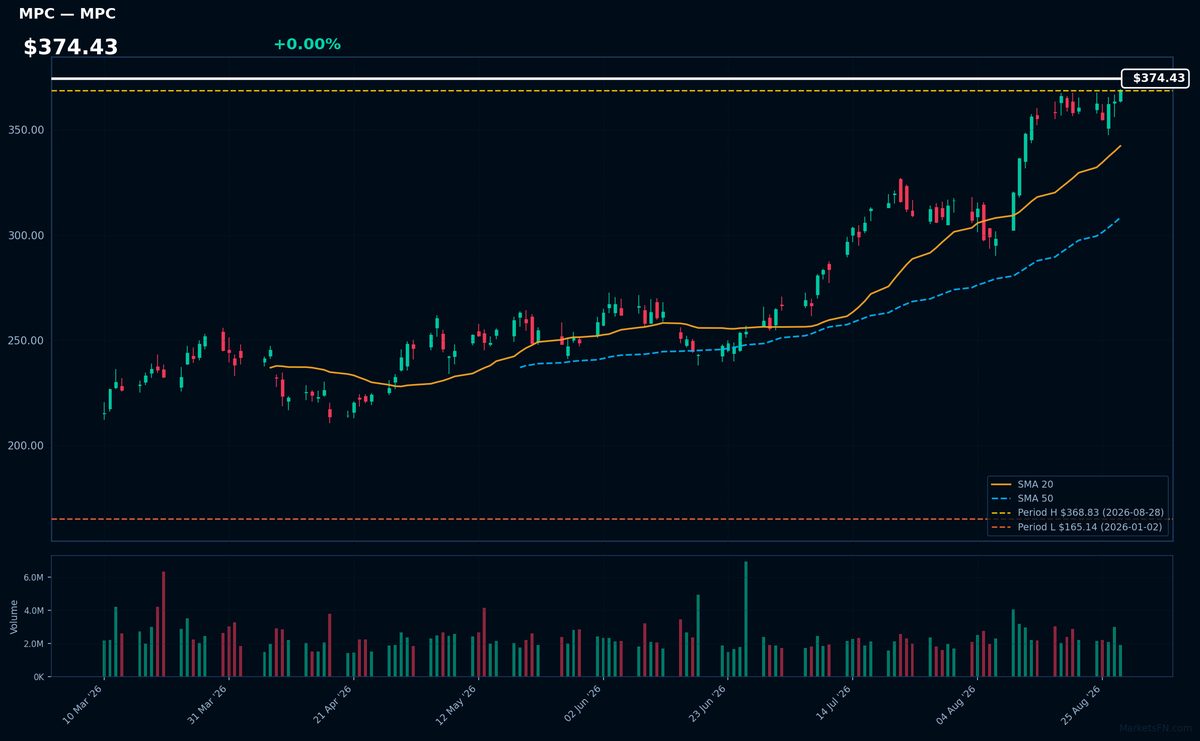
MPC | Marathon Petroleum Corp | Energy | Price Last: $368.83 | % Realized: +123.34% | RSI: 73.1 | % above MA200: +55.0% | Trend: Above MA20, MA50, MA200
Marathon Petroleum Corp is an energy company that refines, markets, and transports petroleum products. Investors should care because its performance is tied to energy demand and refining margins, impacting its profitability and stock performance.
Marathon Petroleum Corp shows strong technical momentum with RSI(14) at 73.1 and a bullish MA alignment (price > MA20 > MA50 > MA200). It's near its 2026 YTD high, up 123.3% YTD, indicating potential for further breakout.
Related headlines
- Marathon Petroleum Named a Top 100 Internship Program for the Third Consecutive Year
- PSX, MPC Reportedly Weighed A Giant Merger What Sank The $180B Deal Between Phillips 66 And Marathon Petroleum
- MPC, PSX Stocks Hit All-Time Highs Whats Driving The Rally In These Energy Stocks?
- Marathon Petroleum Corp. stock outperforms competitors on strong trading day
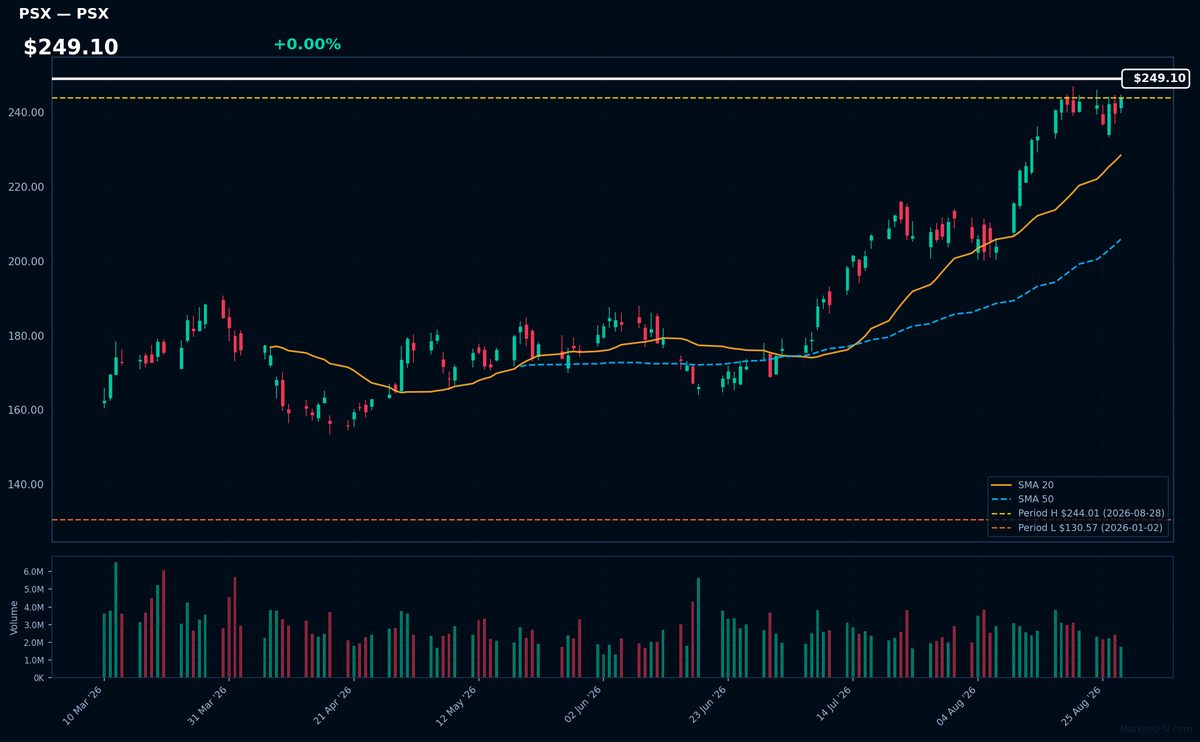
PSX | Phillips 66 | Energy | Price Last: $244.01 | % Realized: +86.88% | RSI: 73.1 | % above MA200: +43.5% | Trend: Above MA20, MA50, MA200
Phillips 66 is a diversified energy company with refining, midstream, and chemicals businesses. Investors should care about its refining margins, pipeline throughput, and chemicals demand, which drive its profitability and cash flow generation.
Phillips 66's RSI is 73.1, indicating strong momentum. With price > MA20 > MA50 > MA200 and 0.0% below its 2026 YTD high, it shows a sustained uptrend and potential breakout, suggesting continued momentum.
Related headlines
- Bill Nygren's Bold Q2 2026 Move: Trimming Phillips 66 for a -1.81% Portfolio Impact
- PSX, MPC Reportedly Weighed A Giant Merger What Sank The $180B Deal Between Phillips 66 And Marathon Petroleum
- Phillips 66 and partners approve $5bn Western Gateway Pipeline
- MPC, PSX Stocks Hit All-Time Highs Whats Driving The Rally In These Energy Stocks?
📉 Nearest to 2026 Low
Sectors represented: Utilities (3), Real Estate (1), Industrials (1)
| Ticker | Company | Sector | Price Last | % Realized | 2026 YTD Low Date | RSI | % above MA200 | Trend |
|---|---|---|---|---|---|---|---|---|
| NRG | NRG Energy Inc | Utilities | $111.12 | -33.12% | 2026-08-28 | 37.5 | -24.8% | Below MA20, MA50, MA200 |
| PPL | PPL Corp | Utilities | $34.20 | -2.59% | 2026-08-28 | 34.9 | -5.8% | Below MA20, MA50, MA200 |
| EQR | Equity Residential Properties Trust | Real Estate | $63.66 | -7.74% | 2026-08-17 | 21.2 | — | — |
| HUBB | Hubbell Inc | Industrials | $459.66 | -0.73% | 2026-08-28 | 37.0 | -5.3% | Below MA20, MA50, MA200 |
| CMS | CMS Energy Corporation | Utilities | $68.21 | -3.14% | 2026-08-28 | 31.3 | -7.4% | Below MA20, MA50, MA200 |
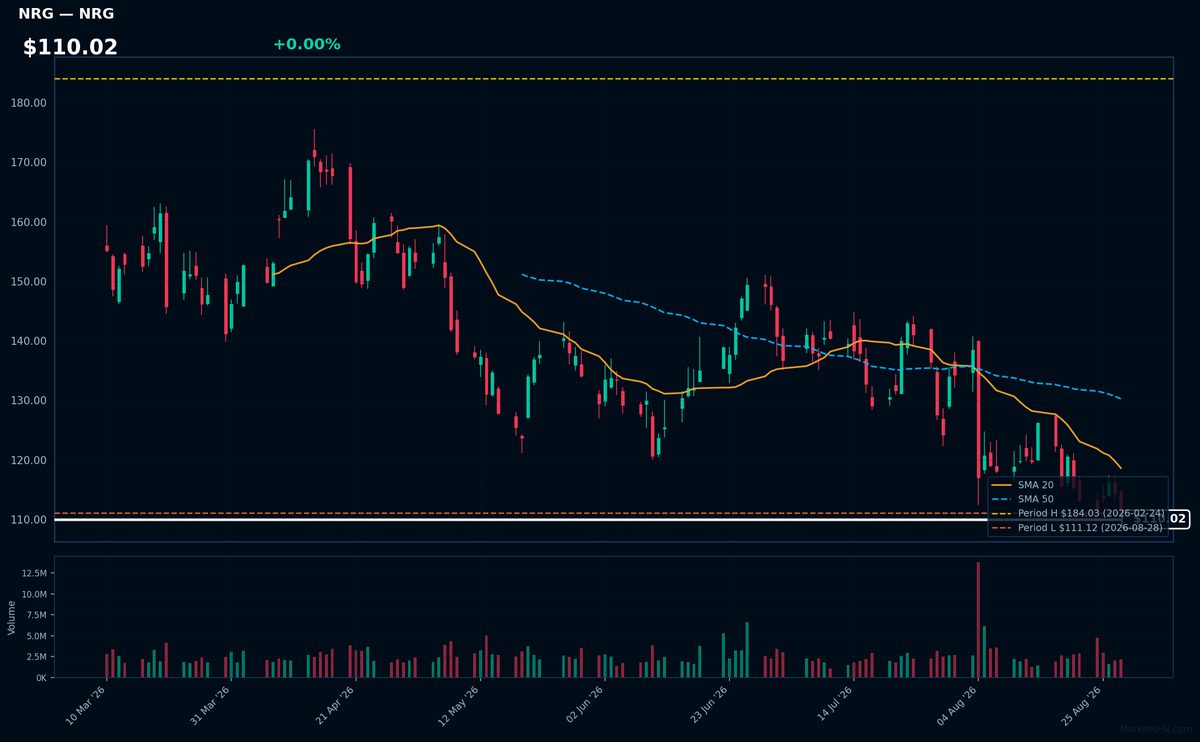
NRG | NRG Energy Inc | Utilities | Price Last: $111.12 | % Realized: -33.12% | RSI: 37.5 | % above MA200: -24.8% | Trend: Below MA20, MA50, MA200
NRG Energy Inc is a leading retail electricity provider and wholesale energy generator. Investors should care because its performance is tied to energy demand, wholesale power prices, and competitive positioning in deregulated markets.
NRG is testing major support with a 37.5 RSI and bearish MA alignment (price < $85.41 MA20 < $86.92 MA50 < $103.83 MA200), indicating a sustained downtrend and potential further downside, with a -33.1% 2026 YTD return.
Related headlines
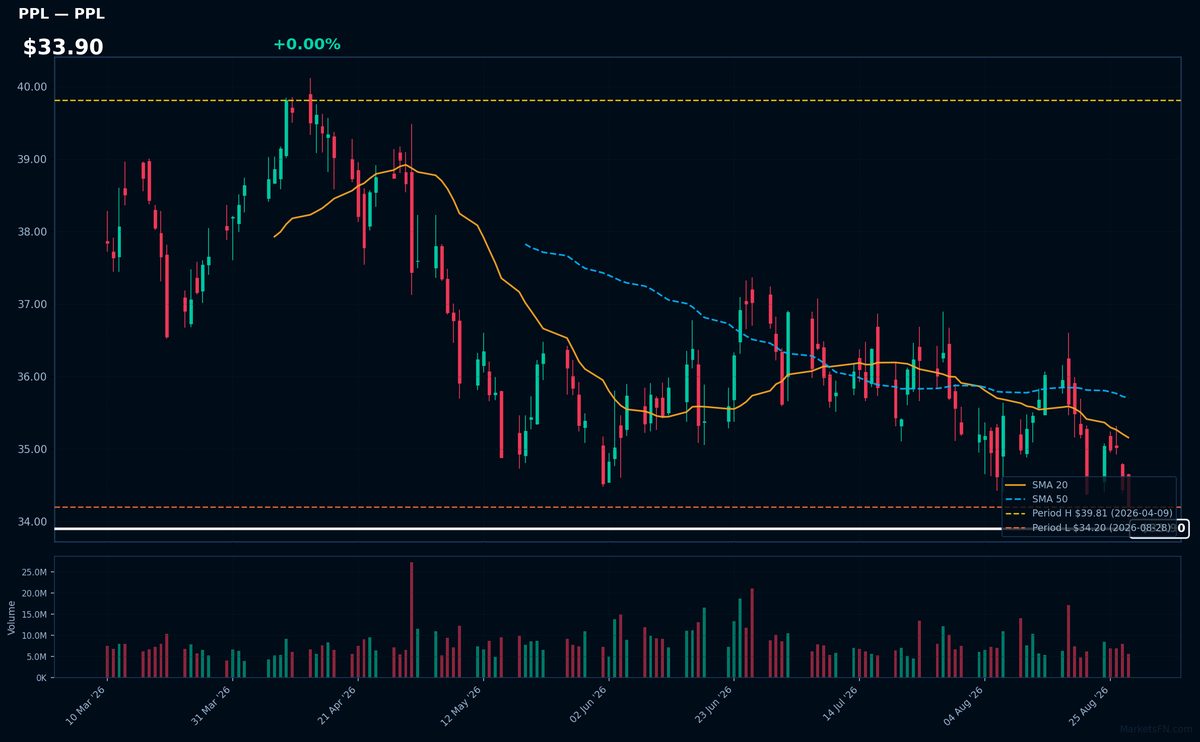
PPL | PPL Corp | Utilities | Price Last: $34.20 | % Realized: -2.59% | RSI: 34.9 | % above MA200: -5.8% | Trend: Below MA20, MA50, MA200
PPL Corp is a utility company that generates and distributes electricity. Investors should care because its stable cash flows and dividend yield can provide a defensive position in a portfolio, but its growth prospects may be limited due to regulatory environments.
PPL Corp's technical situation is bearish, with an RSI(14) of 34.9 indicating oversold conditions and a sustained downtrend as price ($33.90) remains below MA20, MA50, and MA200. The stock is testing major support at its 2026 YTD low.
Related headlines
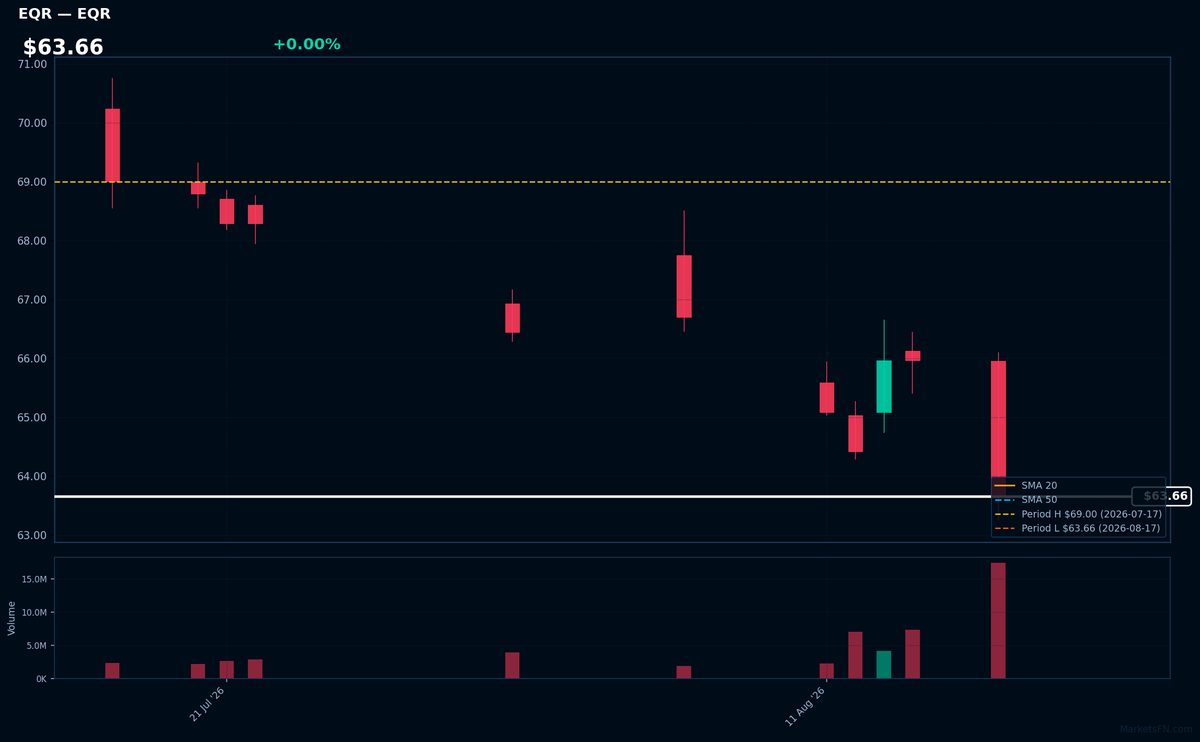
EQR | Equity Residential Properties Trust | Real Estate | Price Last: $63.66 | % Realized: -7.74% | RSI: 21.2 | % above MA200: — | Trend: —
Equity Residential Properties Trust is a real estate investment trust that owns and operates apartment properties, providing rental housing. Investors care about its performance as it reflects demand for rental housing and the company's ability to generate income.
The stock's RSI(14) is 21.2, indicating oversold conditions. It's 0.0% above its 2026 YTD low, testing major support, and has returned -7.7% YTD in 2026, suggesting a warning sign. MA data is incomplete, limiting further technical analysis.
Related headlines
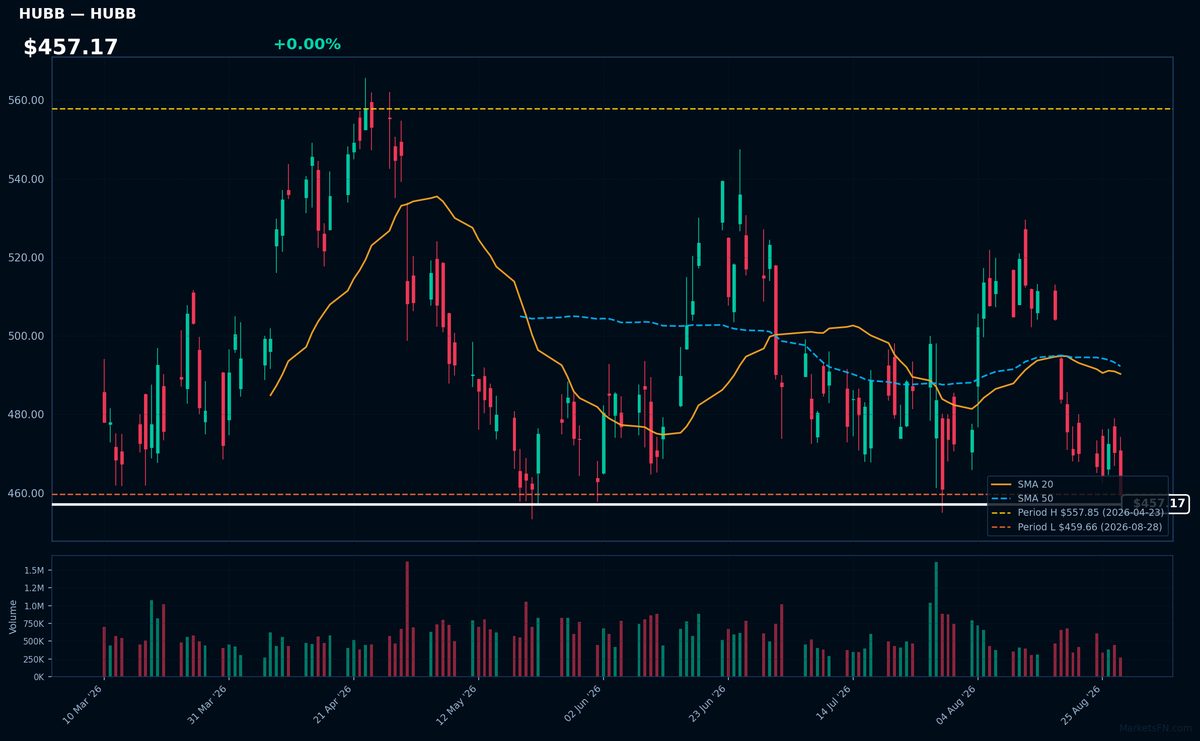
HUBB | Hubbell Inc | Industrials | Price Last: $459.66 | % Realized: -0.73% | RSI: 37.0 | % above MA200: -5.3% | Trend: Below MA20, MA50, MA200
Hubbell Inc designs and manufactures electrical and electronic products for various markets, including utility, construction, and industrial sectors. Investors should care about its performance as it indicates demand trends in these sectors.
Hubbell Inc's RSI is 37.0, indicating potential oversold conditions. The stock is below MA20, MA50, and MA200, showing mixed signals, and is at its 2026 YTD low, testing major support, with a -0.7% 2026 YTD return.
Related headlines
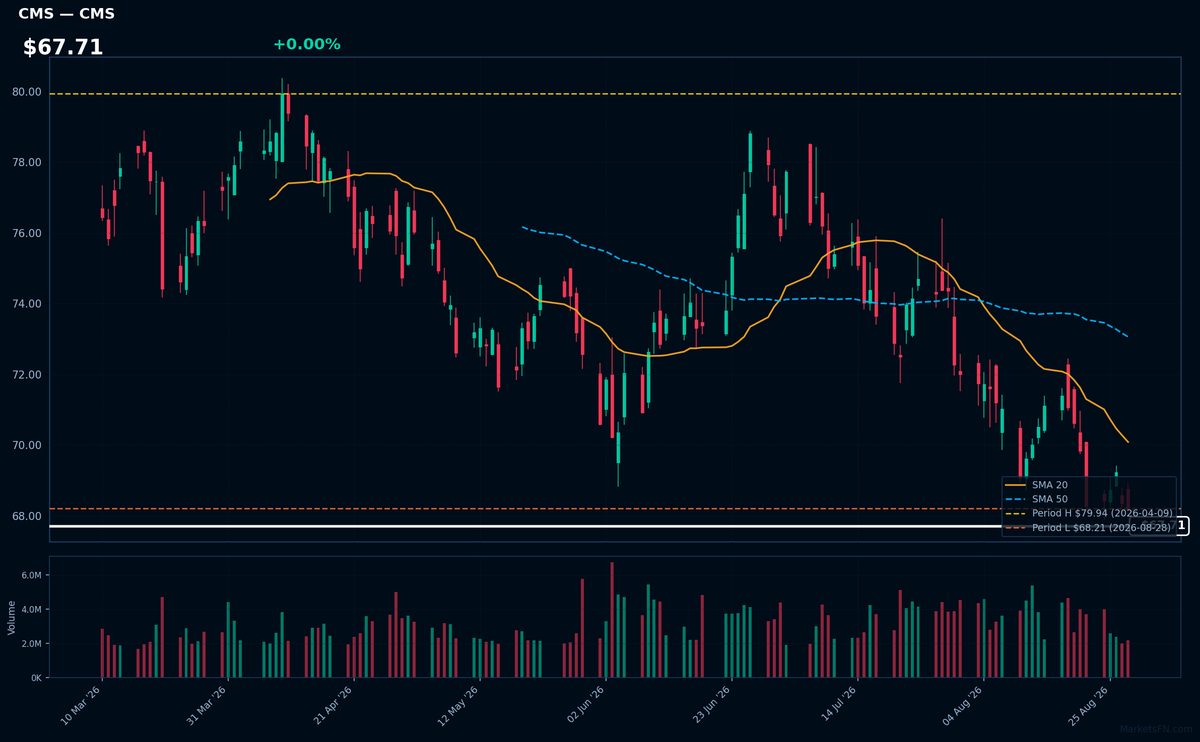
CMS | CMS Energy Corporation | Utilities | Price Last: $68.21 | % Realized: -3.14% | RSI: 31.3 | % above MA200: -7.4% | Trend: Below MA20, MA50, MA200
CMS Energy Corporation is an energy company that provides natural gas and electricity to customers. Investors should care because its performance is tied to energy demand and regulatory environments, impacting its revenue and profitability.
CMS is testing major support at its 2026 YTD low with an RSI(14) of 31.3, indicating oversold conditions, and a bearish MA alignment (price < MA20 < MA50 < MA200), suggesting a sustained downtrend, potentially a warning sign.
Related headlines
- Why Did APP, CMS, MVIS Stocks Plunge To 52-Week Lows Last Week?
- Consumers Energy Invests in Reliability Upgrades to Secure the Grid for Michigan Customers
- Consumers Energy Secures Natural Gas System with Nearly 150 Miles of Upgrades Across Michigan
- Consumers Energy Foundation launches Community Impact Awards with Grants up to $20,000
Market Commentary
The S&P 500 stocks listed are currently trading near their year-to-date (YTD) extremes for 2026. Specifically, MSFT, PLTR, ADP, MPC, and PSX are at their YTD highs, while NRG, PPL, EQR, HUBB, and CMS are at their YTD lows. This indicates that these stocks have either reached new highs or lows since the beginning of 2026 and are not far from these extremes.
The stocks near their YTD highs are a mix of technology (MSFT, PLTR, ADP) and energy (MPC, PSX) companies, suggesting strong performance in these sectors. Conversely, the stocks near their YTD lows are primarily from the utilities (NRG, CMS, PPL) and real estate (EQR) sectors, and industrials (HUBB), indicating potential challenges or negative sentiment in these areas.
Investors should monitor market conditions, sector trends, and company-specific news for these stocks to understand the drivers behind their current price levels. Watching how these stocks move relative to their 2026 extremes can provide insights into broader market sentiment and potential future trends.
Methodology: All 503 S&P 500 constituents screened. Close prices downloaded from 2026-01-01. Period high = highest close since Jan 1 2026; period low = lowest close since Jan 1 2026. Distance = (current price / period extreme − 1) × 100. Technical indicators computed on up to 1 year of daily OHLCV data.
Disclaimer: For informational purposes only. Not investment advice. Past performance is not indicative of future results.