S&P 500 2026 YTD Highs & Lows Radar: Palantir (PLTR), Walmart (WMT) and more
MarketsFN Team

S&P 500 2026 YTD Highs & Lows Radar: Palantir (PLTR), Walmart (WMT) and more
Screening all 503 S&P 500 constituents for stocks nearest to their 2026 year-to-date high and their 2026 YTD low. Data as of August 28, 2026. % Realized = total return since Jan 1 2026.
Legend: RSI > 70 = overbought · RSI < 30 = oversold · Green % Realized = positive YTD return · Red = negative.
📈 Nearest to 2026 High
Sectors represented: Technology (5)
| Ticker | Company | Sector | Price Last | % Realized | 2026 YTD High Date | RSI | % above MA200 | Trend |
|---|---|---|---|---|---|---|---|---|
| PLTR | Palantir Technologies Inc | Technology | $185.93 | +10.76% | 2026-08-27 | 69.4 | +22.8% | Above MA20, MA50, MA200 |
| ADP | Automatic Data Processing Inc | Technology | $284.68 | +12.58% | 2026-08-27 | 67.8 | +20.5% | Above MA20, MA50, MA200 |
| CRWD | Crowdstrike Holdings Inc | Technology | $227.96 | +101.03% | 2026-08-27 | 58.4 | +62.3% | Above MA20, MA50, MA200 |
| FTNT | Fortinet Inc | Technology | $172.78 | +121.85% | 2026-08-27 | 60.5 | +59.8% | Above MA20, MA50, MA200 |
| PAYX | Paychex Inc | Technology | $126.48 | +16.46% | 2026-08-27 | 66.3 | +22.0% | Above MA20, MA50, MA200 |
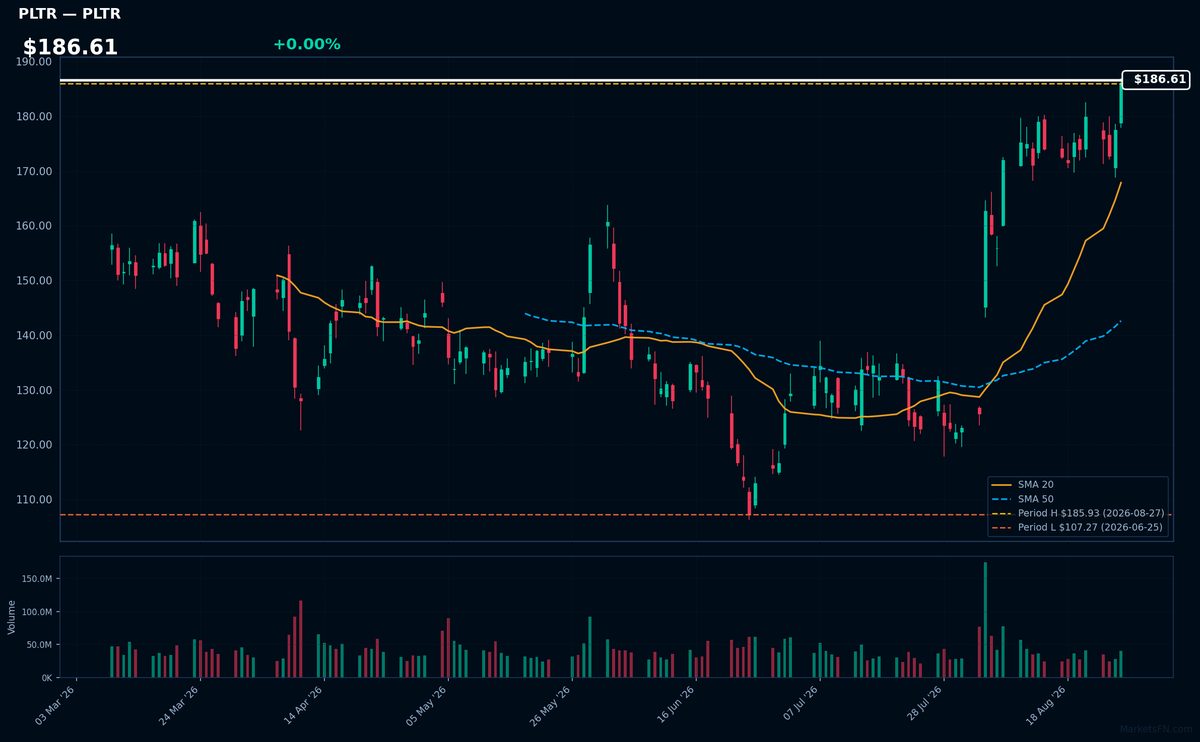
PLTR | Palantir Technologies Inc | Technology | Price Last: $185.93 | % Realized: +10.76% | RSI: 69.4 | % above MA200: +22.8% | Trend: Above MA20, MA50, MA200
Palantir Technologies Inc provides data integration and analytics software, enabling organizations to make informed decisions by leveraging complex data sets; investors should care as its technology is used in defense, finance, and healthcare, driving growth potential.
PLTR's RSI(14) is 69.4, nearing overbought territory, with price above MA20, MA50, and MA200, indicating mixed signals; it's 0.0% below its 2026 YTD high, suggesting a potential breakout, with a 10.8% return over the 2026 YTD period.
Related headlines
- Meta, Palantir, Paramount Skydance Hedge Trump Ties by Courting Democrats as Midterms Raise Prospect of House Flip: Report
- 3 Reasons Growth Investors Will Love Palantir Technologies (PLTR)
- Palantir's Pentagon AI Business Is Closing In on $1 Billion a Year
- Palantir Technologies Stock Surged On Evidence That Was Already Public
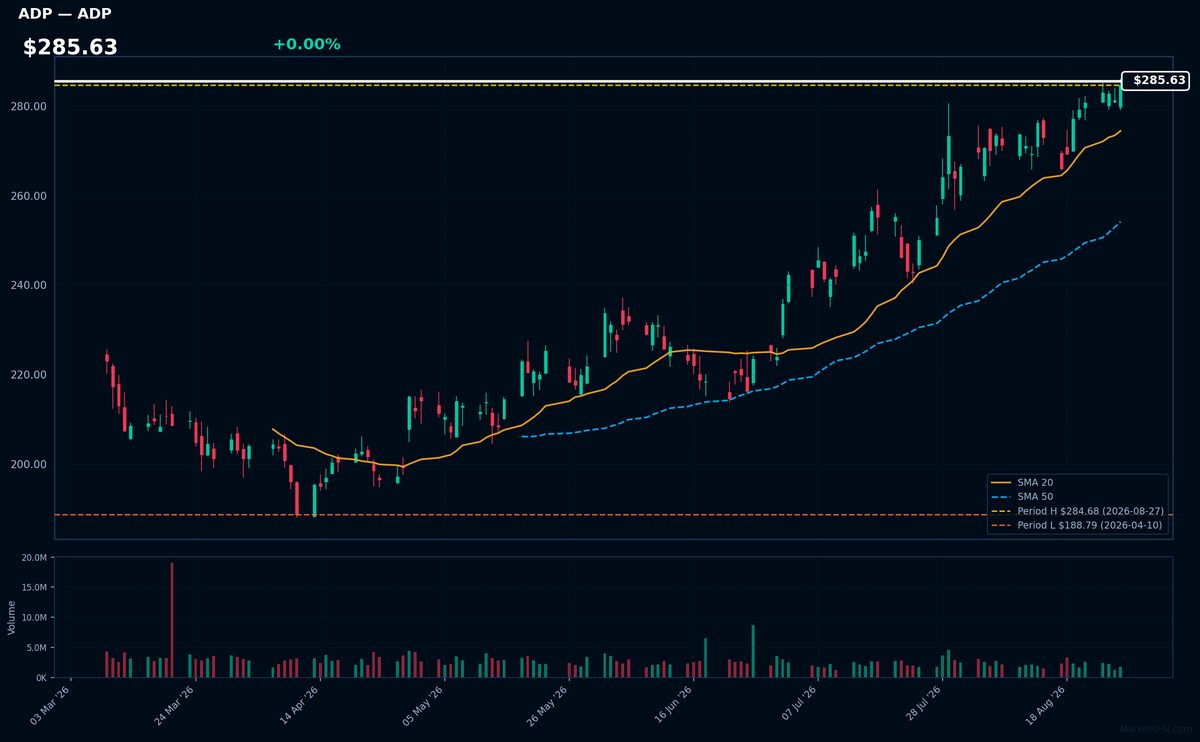
ADP | Automatic Data Processing Inc | Technology | Price Last: $284.68 | % Realized: +12.58% | RSI: 67.8 | % above MA200: +20.5% | Trend: Above MA20, MA50, MA200
Automatic Data Processing Inc provides HR, payroll, and benefits administration services to businesses, processing millions of paychecks and handling employee data. Investors should care because its stable, recurring revenue model and market leadership position offer a defensive growth profile.
The stock shows bullish technicals with RSI(14) at 67.8, indicating rising momentum, and a sustained uptrend as price ($285.63) remains above MA20 > MA50 > MA200. It's near its 2026 YTD high, 0.0% below, suggesting a potential breakout.
Related headlines
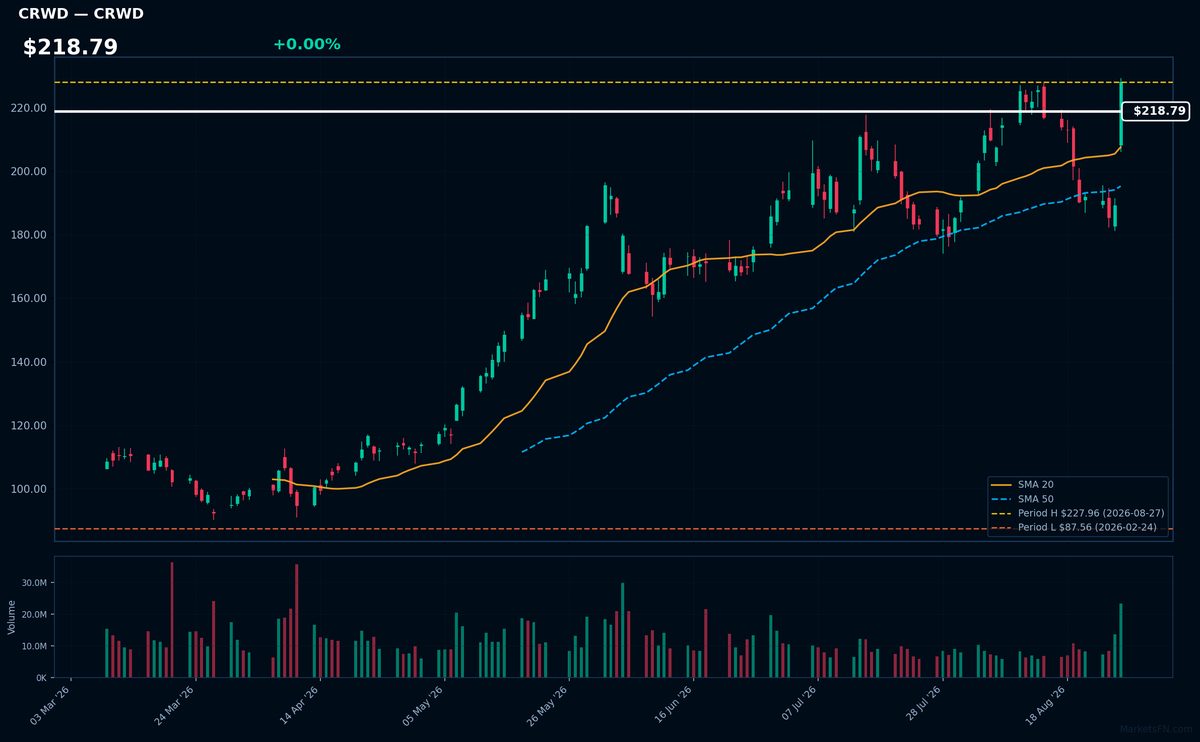
CRWD | Crowdstrike Holdings Inc | Technology | Price Last: $227.96 | % Realized: +101.03% | RSI: 58.4 | % above MA200: +62.3% | Trend: Above MA20, MA50, MA200
Crowdstrike Holdings Inc is a cybersecurity company providing cloud-delivered endpoint protection. Investors should care because its innovative Falcon platform has driven significant growth, making it a key player in the rapidly expanding cybersecurity market.
Crowdstrike's technicals indicate sustained uptrend with price at $218.79, RSI(14) at 58.4, and bullish MA alignment (price > MA20 > MA50 > MA200). The stock is near its 2026 YTD high, up 101.0% YTD, suggesting momentum.
Related headlines
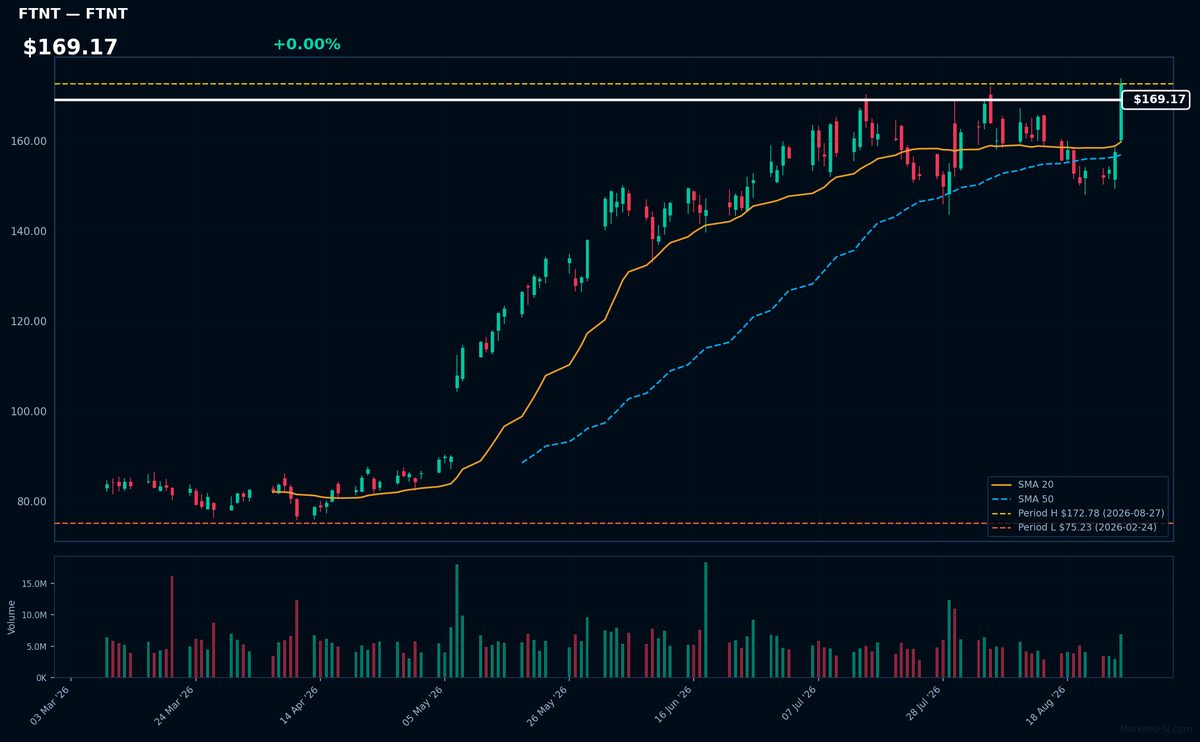
FTNT | Fortinet Inc | Technology | Price Last: $172.78 | % Realized: +121.85% | RSI: 60.5 | % above MA200: +59.8% | Trend: Above MA20, MA50, MA200
Fortinet Inc is a cybersecurity company providing security solutions such as firewalls and intrusion detection/prevention systems. Investors should care because its products protect networks from cyber threats, a growing concern for businesses and organizations.
Fortinet Inc shows bullish technicals with RSI(14) at 60.5, indicating rising momentum. The MA alignment (price > MA20 > MA50 > MA200) confirms a sustained uptrend. The stock is 0.0% below its 2026 YTD high, nearing a potential breakout.
Related headlines
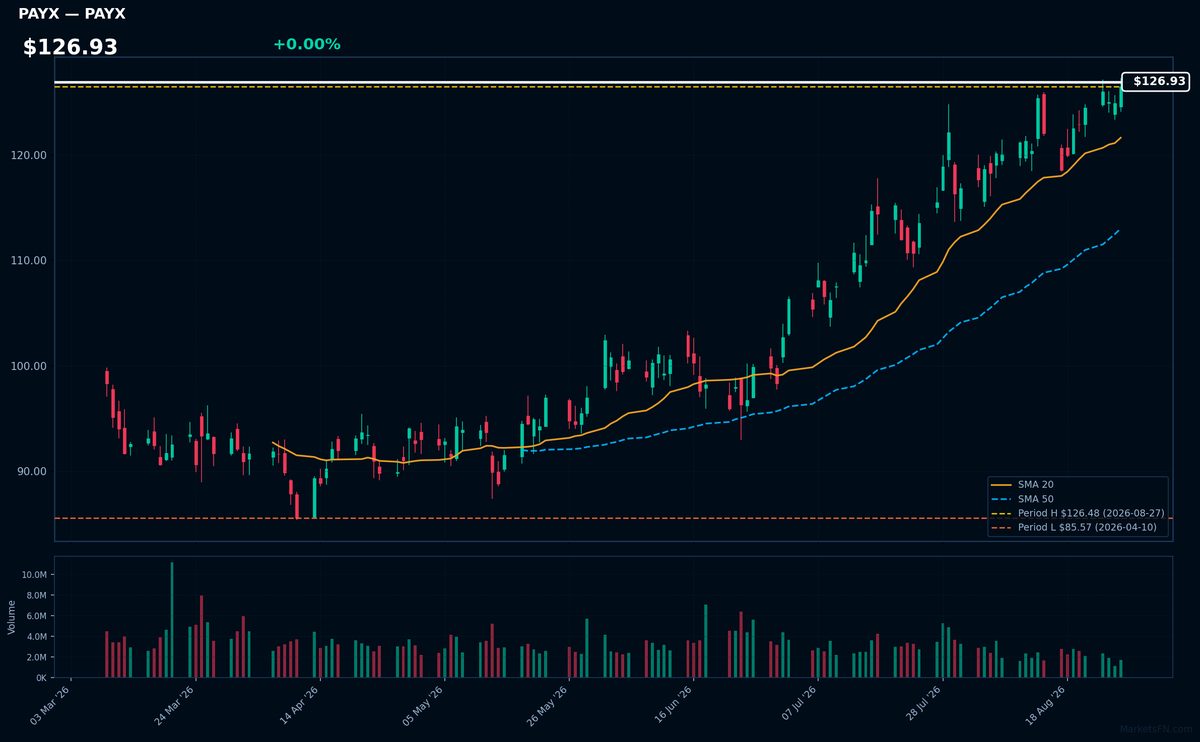
PAYX | Paychex Inc | Technology | Price Last: $126.48 | % Realized: +16.46% | RSI: 66.3 | % above MA200: +22.0% | Trend: Above MA20, MA50, MA200
Paychex Inc provides payroll processing, HR services, and benefits administration to small and medium-sized businesses, generating recurring revenue through subscription-based models. Investors care due to the company's stable cash flows and potential for long-term growth.
Paychex Inc's RSI(14) is 66.3, indicating rising momentum. The stock is in a sustained uptrend with price > MA20 > MA50 > MA200. It's 0.0% below its 2026 YTD high, nearing a potential breakout, with 16.5% 2026 YTD return.
Related headlines
📉 Nearest to 2026 Low
Sectors represented: Consumer Cyclical (3), Consumer Defensive (1), Industrials (1)
| Ticker | Company | Sector | Price Last | % Realized | 2026 YTD Low Date | RSI | % above MA200 | Trend |
|---|---|---|---|---|---|---|---|---|
| WMT | Walmart Inc | Consumer Defensive | $102.63 | -8.98% | 2026-08-27 | 32.2 | -13.5% | Below MA20, MA50, MA200 |
| MCD | McDonald's Corp | Consumer Cyclical | $260.06 | -14.25% | 2026-08-27 | 40.5 | -12.5% | Below MA20, MA50, MA200 |
| TJX | TJX Companies, Inc | Consumer Cyclical | $134.22 | -13.00% | 2026-08-27 | 19.9 | -13.4% | Below MA20, MA50, MA200 |
| NKE | Nike, Inc | Consumer Cyclical | $38.44 | -39.25% | 2026-08-27 | 39.4 | -26.1% | Below MA20, MA50, MA200 |
| LHX | L3Harris Technologies Inc | Industrials | $261.98 | -13.96% | 2026-08-27 | 34.8 | -16.8% | Below MA20, MA50, MA200 |
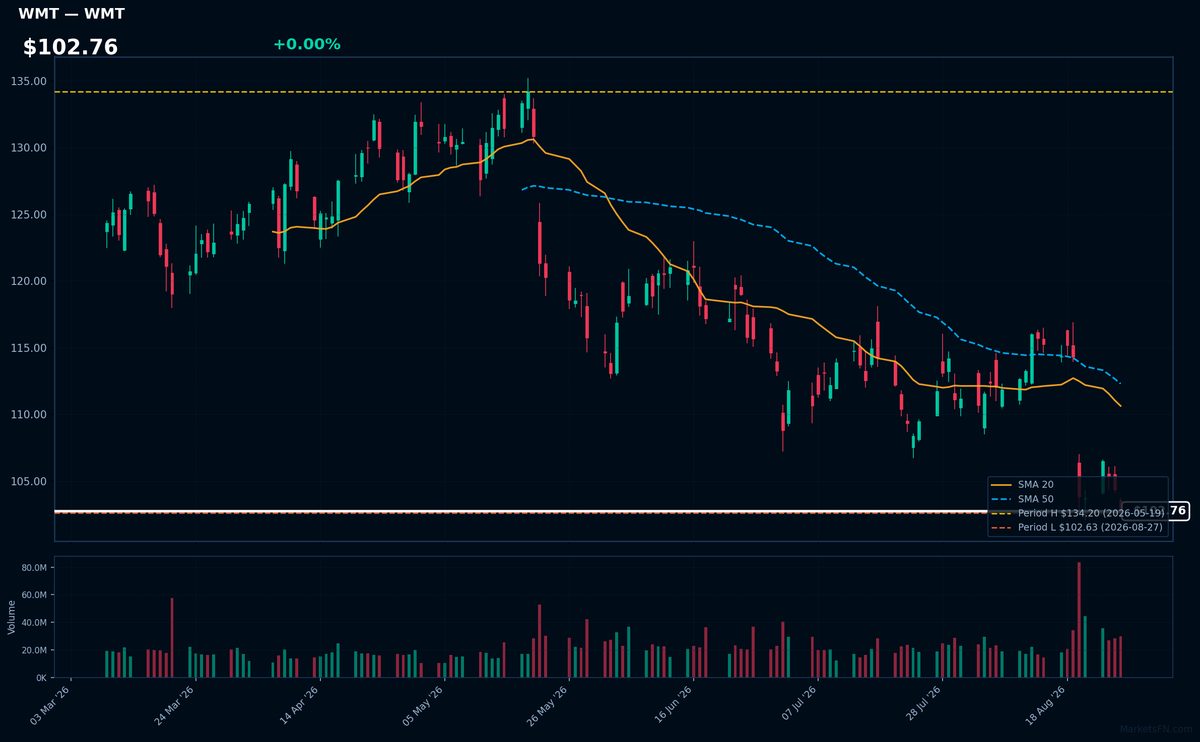
WMT | Walmart Inc | Consumer Defensive | Price Last: $102.63 | % Realized: -8.98% | RSI: 32.2 | % above MA200: -13.5% | Trend: Below MA20, MA50, MA200
Walmart Inc operates retail stores, offering a wide range of products including groceries, electronics, and clothing. Investors care because its performance reflects consumer spending habits and competitive dynamics in the retail sector.
Walmart Inc is testing major support with its price 0.0% above its 2026 YTD low. The RSI(14) is 32.2, and MA alignment is bearish (price < MA20 < MA50 < MA200), indicating a sustained downtrend and potential further decline.
Related headlines
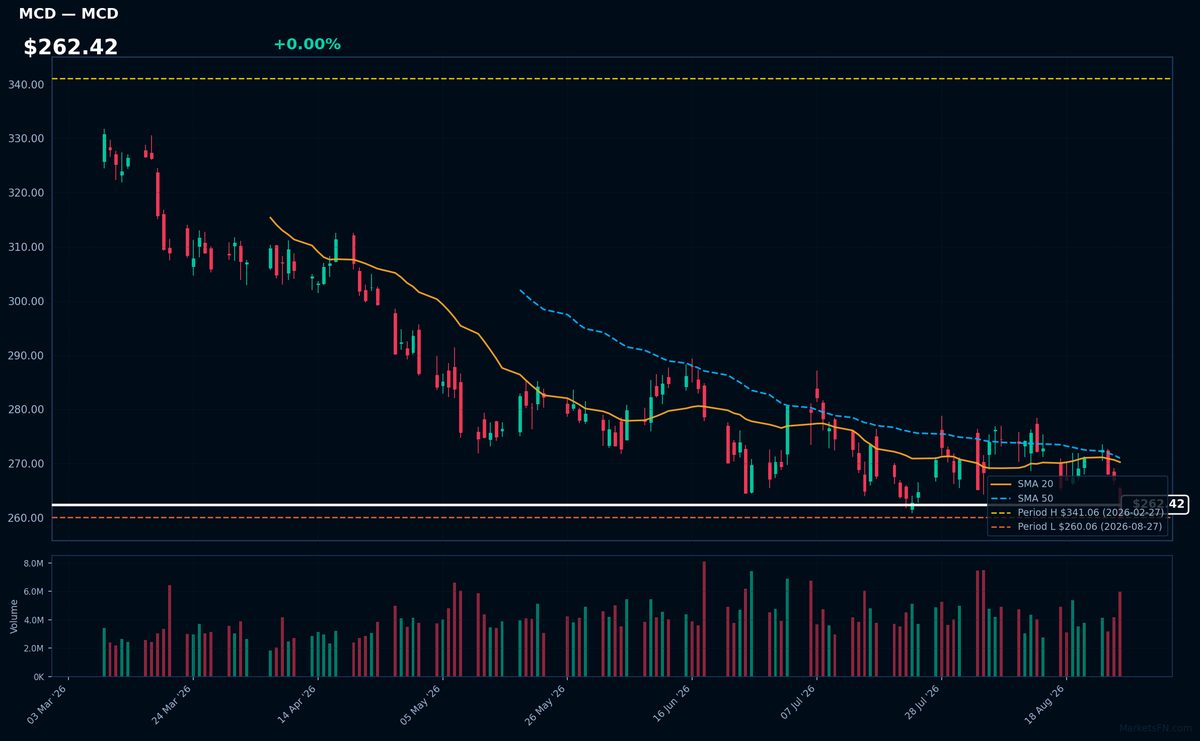
MCD | McDonald's Corp | Consumer Cyclical | Price Last: $260.06 | % Realized: -14.25% | RSI: 40.5 | % above MA200: -12.5% | Trend: Below MA20, MA50, MA200
McDonald's Corp operates quick-service restaurants globally, serving burgers, fries, and beverages. Investors should care about its brand strength, global footprint, and operational efficiency, as these factors influence revenue growth and profitability.
McDonald's Corp is testing major support with its price at 0.0% above its 2026 YTD low. The RSI(14) is 40.5, and the MA alignment is bearish (price < MA20 < MA50 < MA200), indicating a sustained downtrend and potential further decline.
Related headlines
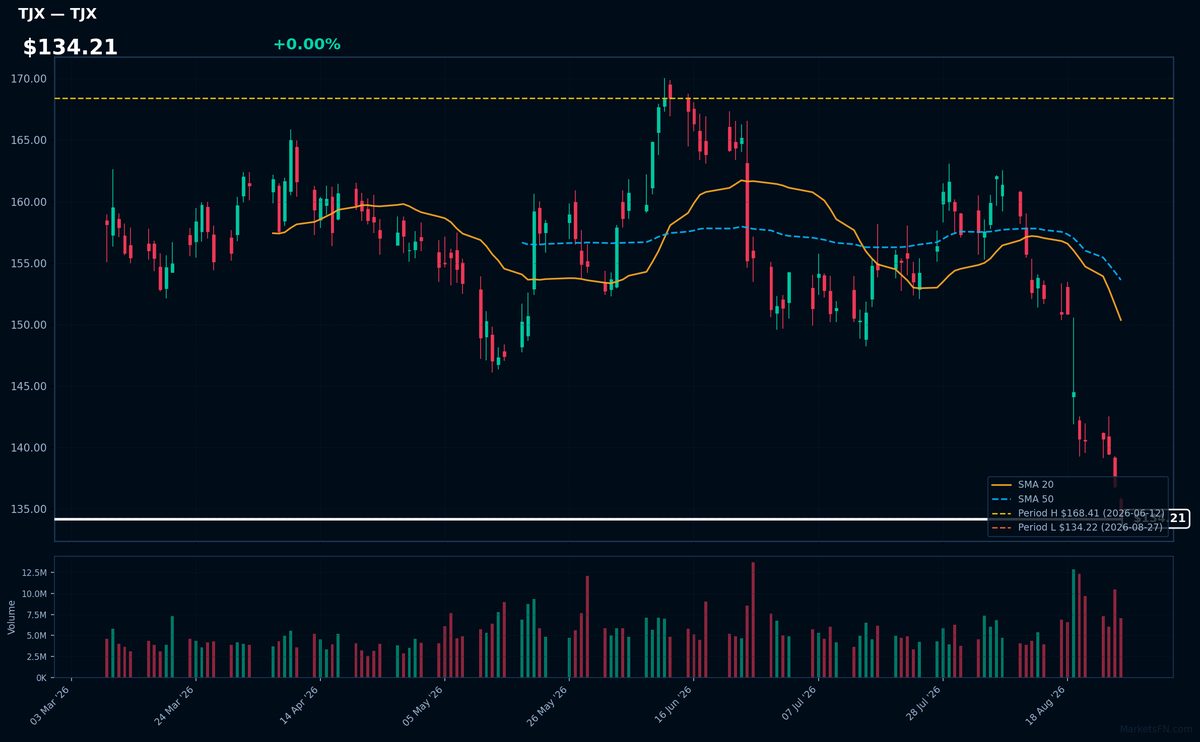
TJX | TJX Companies, Inc | Consumer Cyclical | Price Last: $134.22 | % Realized: -13.00% | RSI: 19.9 | % above MA200: -13.4% | Trend: Below MA20, MA50, MA200
TJX Companies, Inc operates off-price retail stores, offering brand-name merchandise at discounted prices. Investors should care about its ability to maintain margins and sales growth amidst competition, as indicated by its financial performance and stock trends.
TJX is in a sustained downtrend with price ($134.21) below MA20, MA50, and MA200. The RSI(14) is 19.9, near oversold territory, and the stock is testing major support at its 2026 YTD low, indicating a potential warning sign.
Related headlines
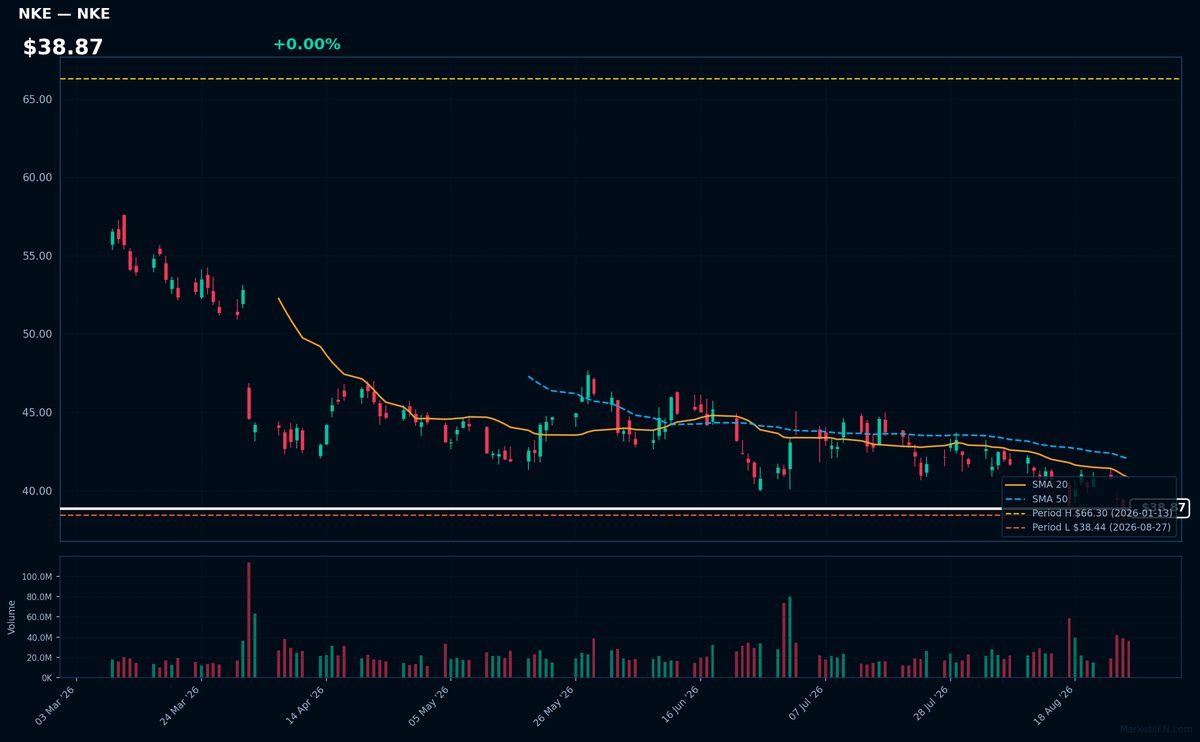
NKE | Nike, Inc | Consumer Cyclical | Price Last: $38.44 | % Realized: -39.25% | RSI: 39.4 | % above MA200: -26.1% | Trend: Below MA20, MA50, MA200
Nike, Inc designs and sells athletic footwear, apparel, and equipment. Investors should care about its brand strength, product innovation, and global distribution network, which drive revenue growth and profitability.
Nike's technicals indicate a sustained downtrend with price ($38.87) below MA20, MA50, and MA200. RSI(14) at 39.4 suggests bearish momentum. Testing its 2026 YTD low, a major support level, with a -39.3% YTD return, signals a warning sign.
Related headlines
- Why Did NKE, NIO, MCD Stocks Plunge To 52-Week Lows Today?
- How Nikes Rough Ride and Dicks New Challenges Mirror a Wider Industry Problem
- Nike Stock Hits 12-Year Low, on Pace for Worst Year Since Michael Jordan First Retired
- NKE, LULU Stocks Head For Weekly Losses: Wall Street Turns Wary, Says Consumer Recovery Isnt Here Yet
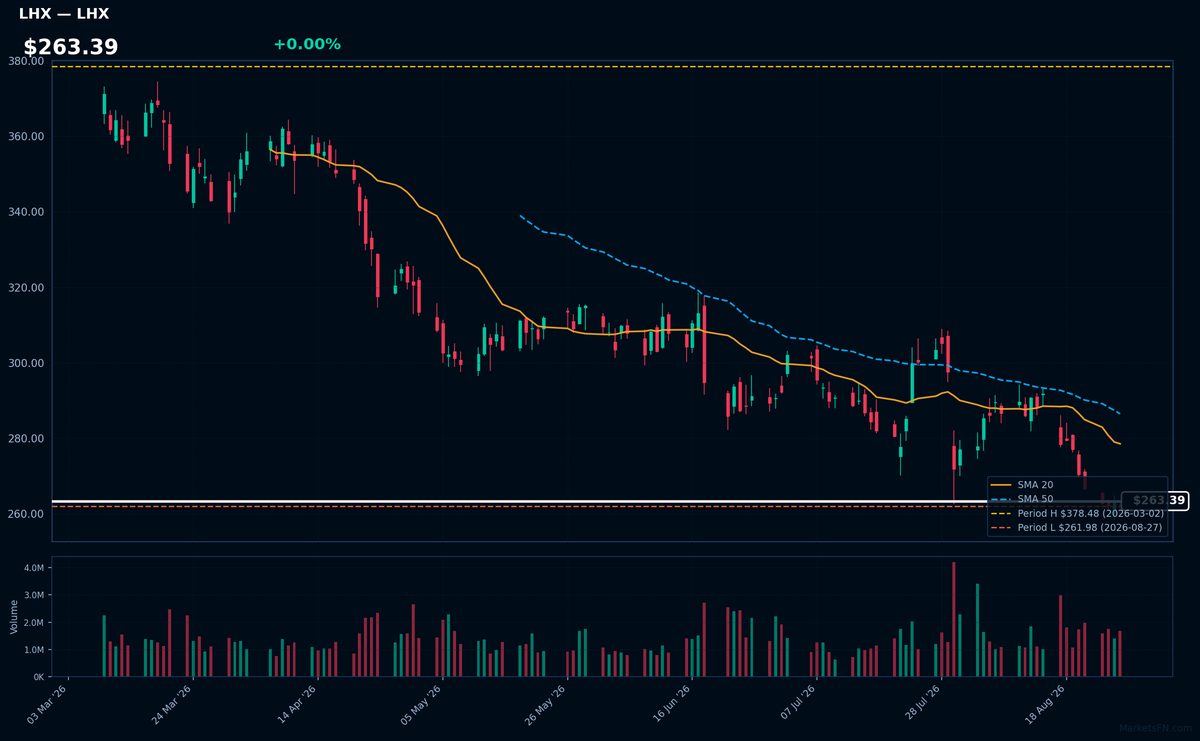
LHX | L3Harris Technologies Inc | Industrials | Price Last: $261.98 | % Realized: -13.96% | RSI: 34.8 | % above MA200: -16.8% | Trend: Below MA20, MA50, MA200
L3Harris Technologies Inc is a defense technology company providing advanced defense and commercial technologies. Investors should care due to its significant role in the defense industry, potentially benefiting from increased defense spending.
L3Harris Technologies Inc is in a sustained downtrend with price ($263.39) below MA20, MA50, and MA200. The RSI(14) is 34.8, nearing oversold territory, and is 0.0% above its 2026 YTD low, indicating a potential support test.
Related headlines
Market Commentary
The S&P 500 stocks listed are currently trading near their year-to-date (YTD) extremes for 2026. Specifically, PLTR, ADP, CRWD, FTNT, and PAYX are at their YTD highs, while WMT, MCD, TJX, NKE, and LHX are at their YTD lows. This indicates that these stocks have either reached new highs or lows since the beginning of 2026 and have not moved significantly away from these levels.
The stocks near their 2026 highs are primarily from the technology and data analytics sectors, suggesting strong performance in these areas. Conversely, the stocks near their 2026 lows represent a mix of consumer staples and discretionary, as well as defense, indicating potential challenges in these sectors. The divergence between these groups may reflect varying market conditions and investor sentiment towards different sectors.
Investors should monitor these stocks for signs of breakout or reversal, as a move away from these extreme levels could indicate a shift in market sentiment or sector rotation. Watching the performance of these stocks and their respective sectors will be crucial in understanding the evolving market dynamics in 2026.
Methodology: All 503 S&P 500 constituents screened. Close prices downloaded from 2026-01-01. Period high = highest close since Jan 1 2026; period low = lowest close since Jan 1 2026. Distance = (current price / period extreme − 1) × 100. Technical indicators computed on up to 1 year of daily OHLCV data.
Disclaimer: For informational purposes only. Not investment advice. Past performance is not indicative of future results.