S&P 500 2026 YTD Highs & Lows Radar: Union Pacific (UNP), TJXmpanies, (TJX) and more
MarketsFN Team

S&P 500 2026 YTD Highs & Lows Radar: Union Pacific (UNP), TJXmpanies, (TJX) and more
Screening all 503 S&P 500 constituents for stocks nearest to their 2026 year-to-date high and their 2026 YTD low. Data as of August 27, 2026. % Realized = total return since Jan 1 2026.
Legend: RSI > 70 = overbought · RSI < 30 = oversold · Green % Realized = positive YTD return · Red = negative.
📈 Nearest to 2026 High
Sectors represented: Industrials (1), Consumer Cyclical (1), Technology (1), Communication Services (1), Financial (1)
| Ticker | Company | Sector | Price Last | % Realized | 2026 YTD High Date | RSI | % above MA200 | Trend |
|---|---|---|---|---|---|---|---|---|
| UNP | Union Pacific Corp | Industrials | $310.62 | +33.94% | 2026-08-26 | 66.1 | +20.3% | Above MA20, MA50, MA200 |
| DASH | DoorDash Inc | Consumer Cyclical | $236.93 | +7.80% | 2026-08-26 | 69.2 | +26.2% | Above MA20, MA50, MA200 |
| MSI | Motorola Solutions Inc | Technology | $487.28 | +27.89% | 2026-08-26 | 68.0 | +16.1% | Above MA20, MA50, MA200 |
| EA | Electronic Arts, Inc | Communication Services | $209.70 | +0.38% | 2026-08-04 | — | — | — |
| STT | State Street Corp | Financial | $193.62 | +50.01% | 2026-08-26 | 63.8 | +31.9% | Above MA20, MA50, MA200 |
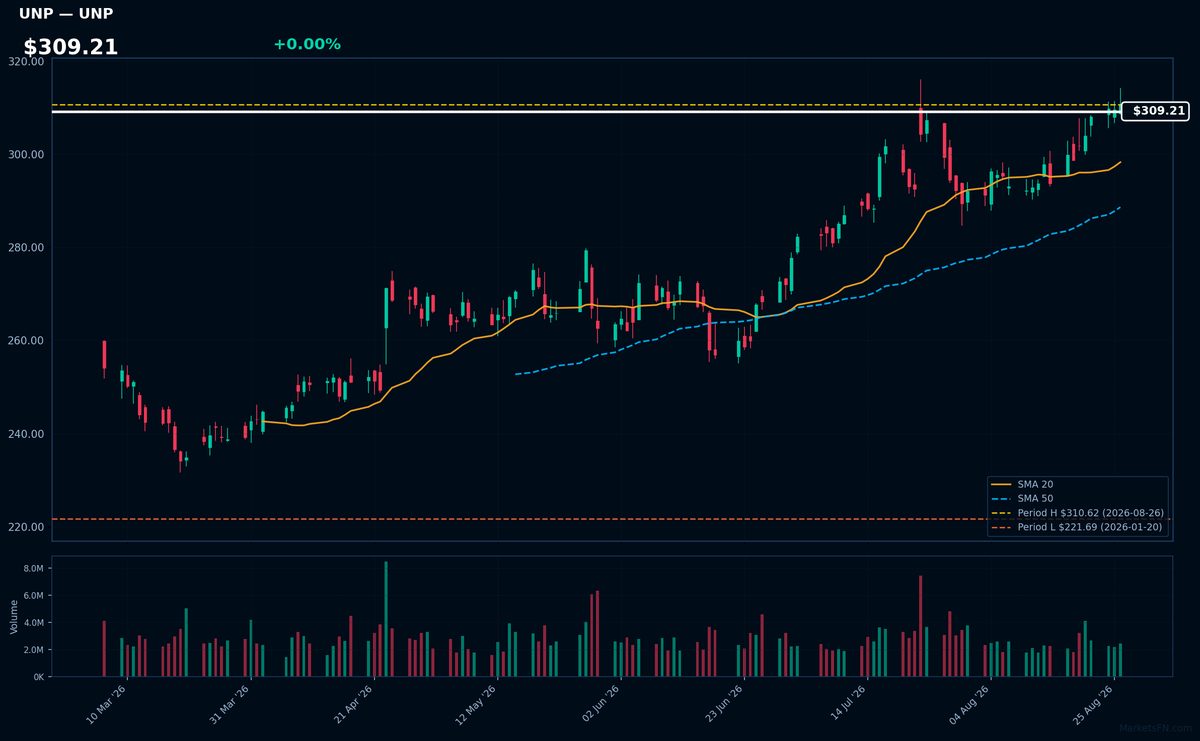
UNP | Union Pacific Corp | Industrials | Price Last: $310.62 | % Realized: +33.94% | RSI: 66.1 | % above MA200: +20.3% | Trend: Above MA20, MA50, MA200
Union Pacific Corp (UNP) operates North America's largest railroad network, transporting goods across diverse sectors. Investors should care as its performance reflects broader economic trends, with rail volumes indicating industrial activity and supply chain health.
UNP's RSI(14) is 66.1, nearing overbought territory. With price > MA20 > MA50 > MA200 and 0.0% below its 2026 YTD high, it indicates sustained uptrend momentum. The 33.9% 2026 YTD return reinforces this, suggesting continued strength.
Related headlines
- STB Should Reject Opponents' Baseless Prima Facie Challenges; Union Pacific - Norfolk Southern Merger Application Easily Meets the Standard
- All Aboard: STB Resumes Union Pacific-Norfolk Southern Merger Review
- Union Pacific fuel surcharges exceed Q2 fuel costs by $91.1 million
- Unpacking Rail Earnings: How Volume Growth Fuels Merger Talks
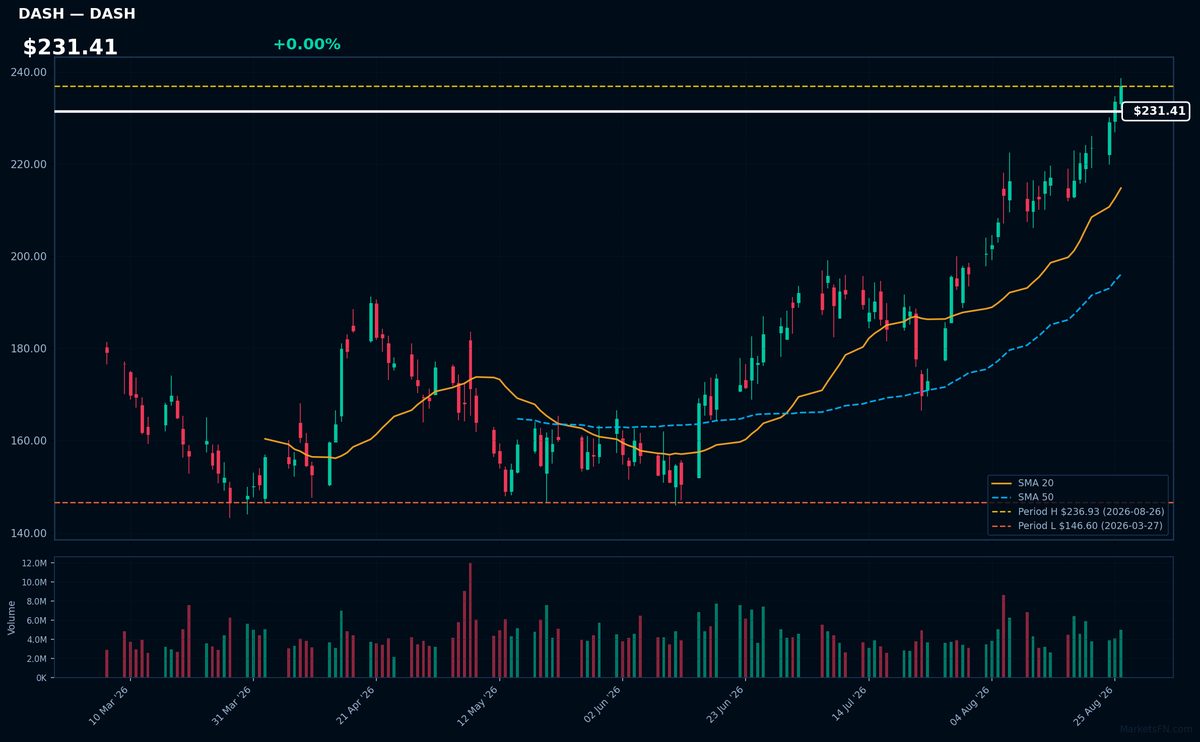
DASH | DoorDash Inc | Consumer Cyclical | Price Last: $236.93 | % Realized: +7.80% | RSI: 69.2 | % above MA200: +26.2% | Trend: Above MA20, MA50, MA200
DoorDash Inc operates a food delivery platform connecting consumers with local restaurants, enabling them to order food for delivery or pickup; investors should care about its growth potential in the expanding food delivery market.
DoorDash Inc's RSI is 69.2, nearing overbought territory, with a bullish MA alignment (price > MA20 > MA50 > MA200) and 0.0% below its 2026 YTD high, indicating strong momentum; the 7.8% 2026 YTD return reinforces this uptrend.
Related headlines
- Amazon, Uber, DoorDash, and Walmart are taking the delivery wars to the skies
- Gap and Gap Factory Land on DoorDash Just in Time for First-Day Fits
- Serve Robotics shares jump as DoorDash and Grubhub partnerships expand
- SERV Stock Rallies On Grubhub Partnership, DoorDash Deal Expansion CEO Calls It 'Clearest Signal Yet Of Where We're Headed'
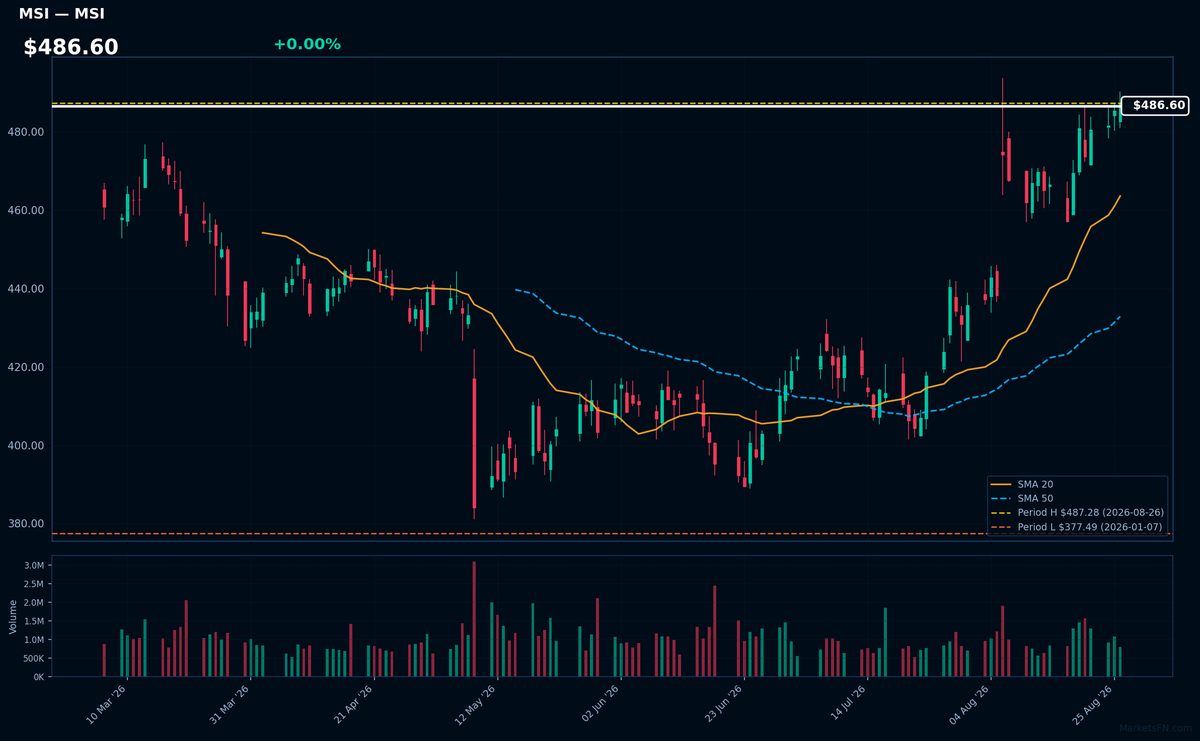
MSI | Motorola Solutions Inc | Technology | Price Last: $487.28 | % Realized: +27.89% | RSI: 68.0 | % above MA200: +16.1% | Trend: Above MA20, MA50, MA200
Motorola Solutions Inc provides mission-critical communication infrastructure and services, including public safety LTE networks and video security solutions, which are crucial for government and enterprise customers, making it a key player in the public safety and security sectors.
Motorola Solutions Inc is in a sustained uptrend with price > MA20 > MA50 > MA200, RSI(14) at 68.0, and is 0.0% below its 2026 YTD high, indicating strong momentum with no immediate signs of reversal, supported by its bullish MA alignment.
Related headlines
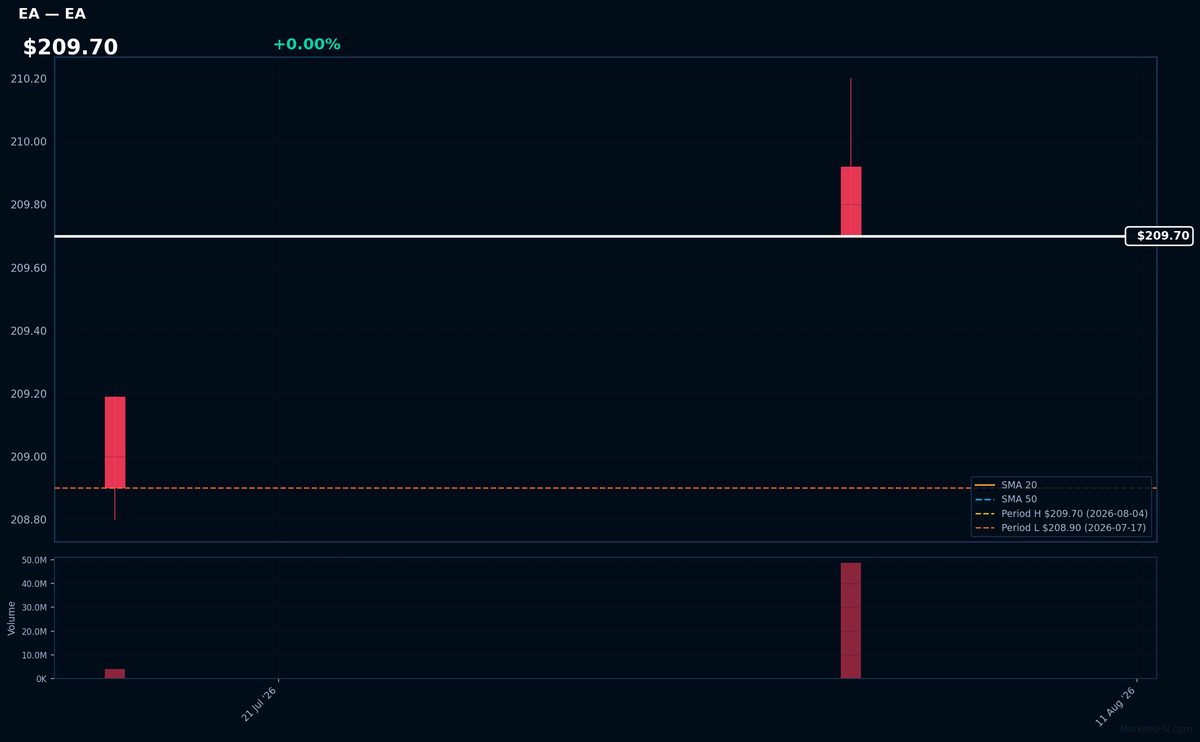
EA | Electronic Arts, Inc | Communication Services | Price Last: $209.70 | % Realized: +0.38% | RSI: — | % above MA200: — | Trend: —
Electronic Arts, Inc (EA) is a video game company that develops and publishes games such as FIFA and Madden NFL. Investors should care because its performance is tied to the gaming industry's growth and popularity of its flagship titles.
The stock is near its 2026 YTD high, up 0.4% YTD. Since MA and RSI data are incomplete or N/A, the technical situation cannot be fully assessed. However, its proximity to the YTD high may indicate a potential breakout.
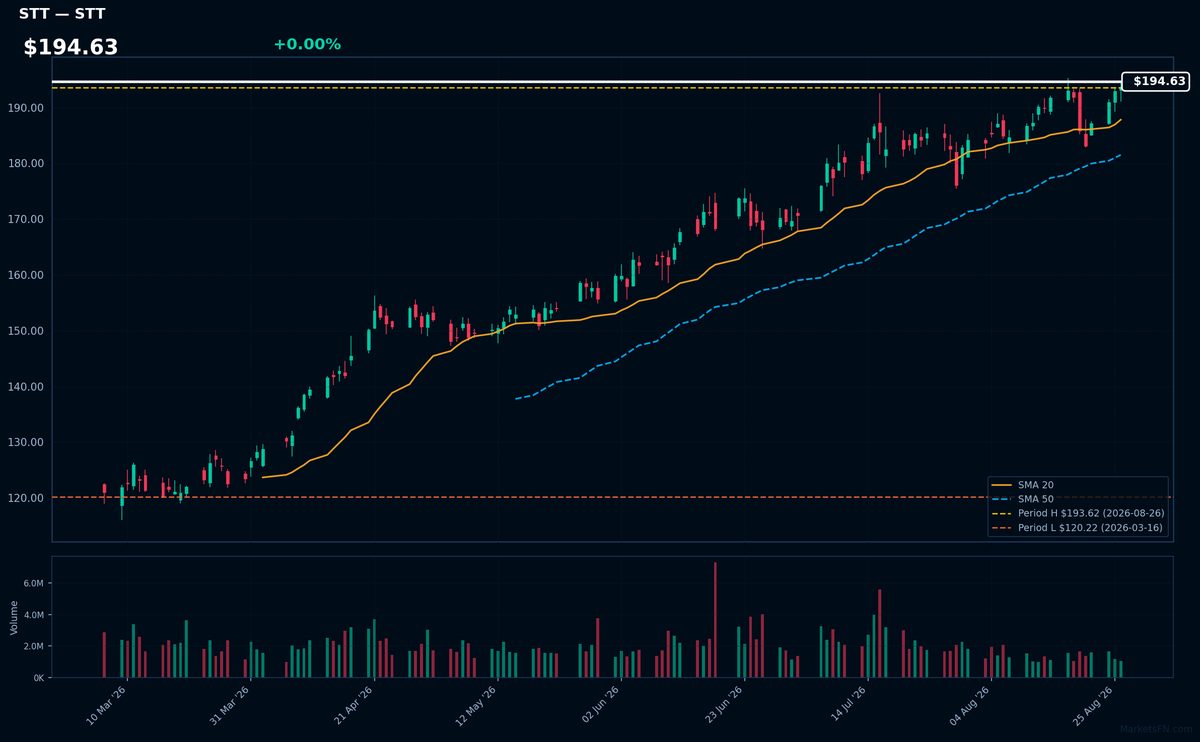
STT | State Street Corp | Financial | Price Last: $193.62 | % Realized: +50.01% | RSI: 63.8 | % above MA200: +31.9% | Trend: Above MA20, MA50, MA200
State Street Corp is a global financial services provider specializing in asset custody, trust and investment management, and securities processing. Investors should care because it plays a critical role in the global financial infrastructure, handling trillions in assets.
State Street Corp is in a sustained uptrend with price > MA20 > MA50 > MA200. The RSI(14) is 63.8, indicating rising momentum. It's 0.0% below its 2026 YTD high, suggesting a potential breakout.
Related headlines
- New ETF Issuers Are Chipping Away at BlackRock, Vanguard, State Street Dominance
- State Street Corporation (NYSE: STT) Announces Remaining 2026 Quarterly Financial Results Release Dates and Conference Call Webcasts
- State Street to Expand Latin America Footprint with Santander CACEIS Latam Securities Services
- Biggest Debate at State Street Is Where Bessent Bond Metric Goes
📉 Nearest to 2026 Low
Sectors represented: Consumer Cyclical (3), Communication Services (1), Real Estate (1)
| Ticker | Company | Sector | Price Last | % Realized | 2026 YTD Low Date | RSI | % above MA200 | Trend |
|---|---|---|---|---|---|---|---|---|
| TJX | TJX Companies, Inc | Consumer Cyclical | $136.83 | -11.31% | 2026-08-26 | 20.5 | -11.8% | Below MA20, MA50, MA200 |
| NKE | Nike, Inc | Consumer Cyclical | $38.59 | -39.02% | 2026-08-26 | 36.9 | -26.0% | Below MA20, MA50, MA200 |
| TTD | Trade Desk Inc | Communication Services | $13.03 | -65.42% | 2026-08-26 | 32.8 | -49.7% | Below MA20, MA50, MA200 |
| EQR | Equity Residential Properties Trust | Real Estate | $63.66 | -7.74% | 2026-08-17 | 21.2 | — | — |
| APTV | Aptiv PLC | Consumer Cyclical | $46.27 | -41.01% | 2026-08-26 | 33.4 | -31.4% | Below MA20, MA50, MA200 |
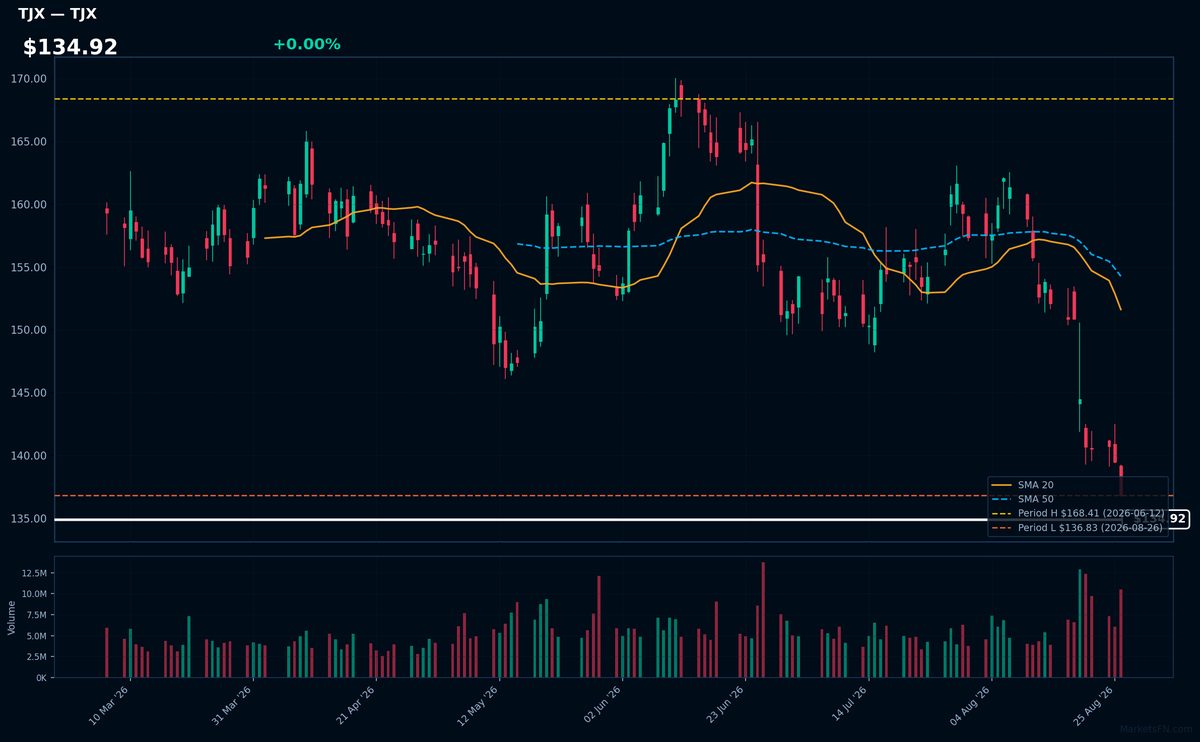
TJX | TJX Companies, Inc | Consumer Cyclical | Price Last: $136.83 | % Realized: -11.31% | RSI: 20.5 | % above MA200: -11.8% | Trend: Below MA20, MA50, MA200
TJX Companies, Inc operates as an off-price retailer, offering brand-name merchandise at discounted prices. Investors should care due to its significant market presence and potential for steady cash flows, making it an attractive investment opportunity in the consumer discretionary sector.
TJX is in a sustained downtrend with a bearish MA alignment: price ($134.92) < MA20 < MA50 < MA200. The RSI(14) is 20.5, indicating oversold conditions. The stock is testing major support, down -11.3% YTD 2026, suggesting a potential warning sign.
Related headlines
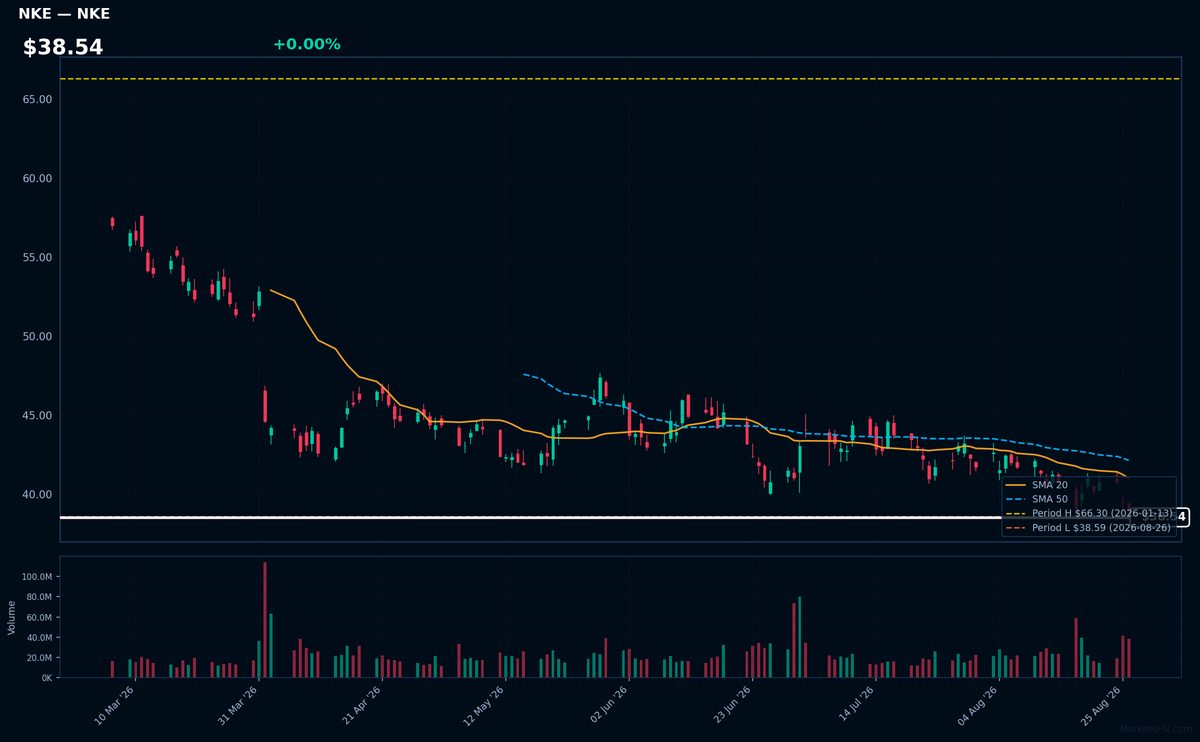
NKE | Nike, Inc | Consumer Cyclical | Price Last: $38.59 | % Realized: -39.02% | RSI: 36.9 | % above MA200: -26.0% | Trend: Below MA20, MA50, MA200
Nike, Inc designs and sells athletic footwear, apparel, and equipment. Investors should care about its brand strength, innovation pipeline, and global distribution network, which drive revenue growth and profitability.
Nike's technicals indicate a sustained downtrend with price ($38.54) below MA20, MA50, and MA200. RSI(14) at 36.9 suggests bearish momentum, and the stock is testing major support at its 2026 YTD low.
Related headlines
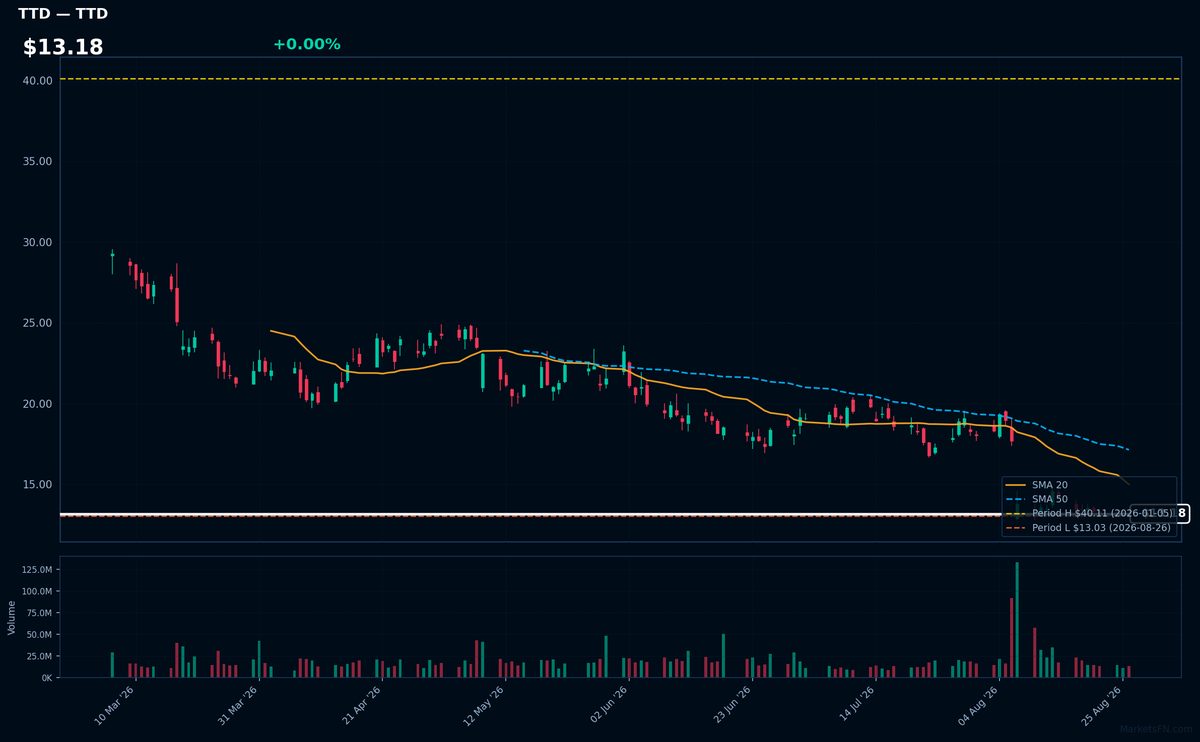
TTD | Trade Desk Inc | Communication Services | Price Last: $13.03 | % Realized: -65.42% | RSI: 32.8 | % above MA200: -49.7% | Trend: Below MA20, MA50, MA200
The Trade Desk Inc operates a demand-side platform enabling advertisers to manage digital ad campaigns across various channels and devices. Investors should care as it reflects the growth of digital advertising and the company's competitive positioning within this expanding market.
Trade Desk Inc's current technical situation indicates a sustained downtrend with price ($13.18) below MA20, MA50, and MA200. The RSI(14) at 32.8 suggests oversold conditions, and the stock is testing major support at its 2026 YTD low.
Related headlines
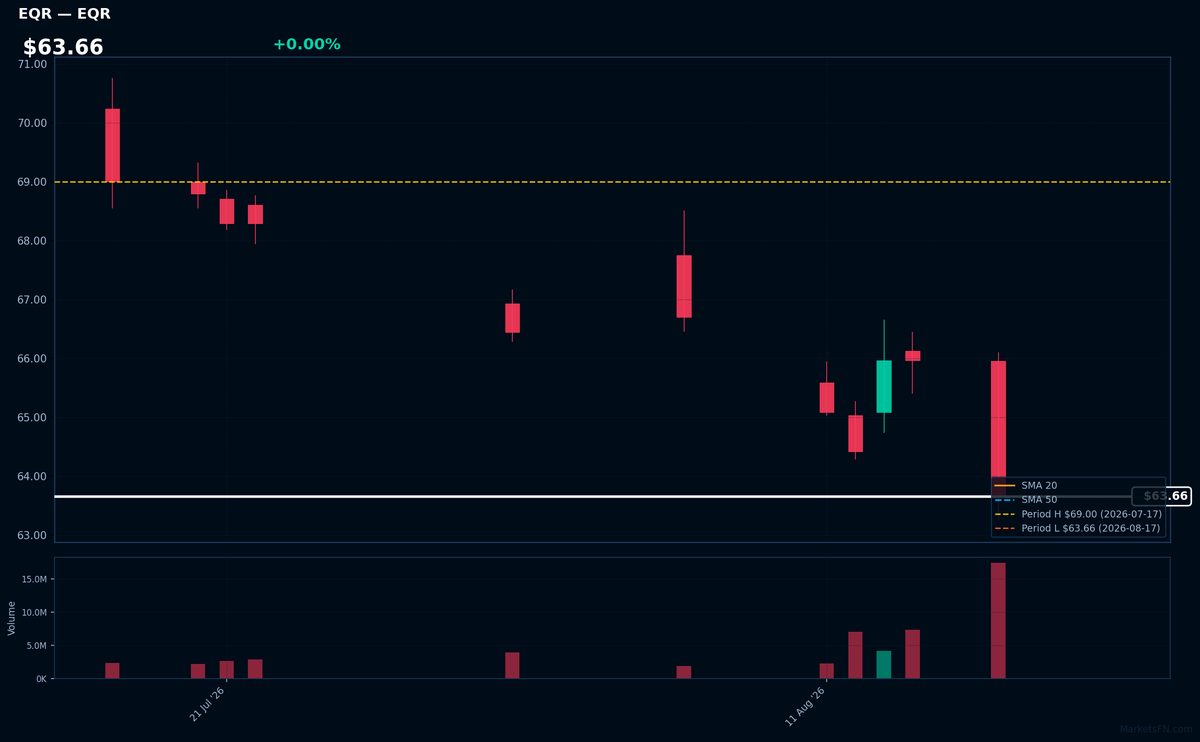
EQR | Equity Residential Properties Trust | Real Estate | Price Last: $63.66 | % Realized: -7.74% | RSI: 21.2 | % above MA200: — | Trend: —
Equity Residential Properties Trust is a real estate investment trust that owns and operates apartment properties. Investors should care because its performance reflects demand for rental housing and the overall health of the residential real estate market.
The stock's RSI(14) is 21.2, indicating oversold conditions. It's testing major support at its 2026 YTD low, having returned -7.7% YTD. The extreme proximity to its low suggests a potential warning sign, but MA data is incomplete for further analysis.
Related headlines
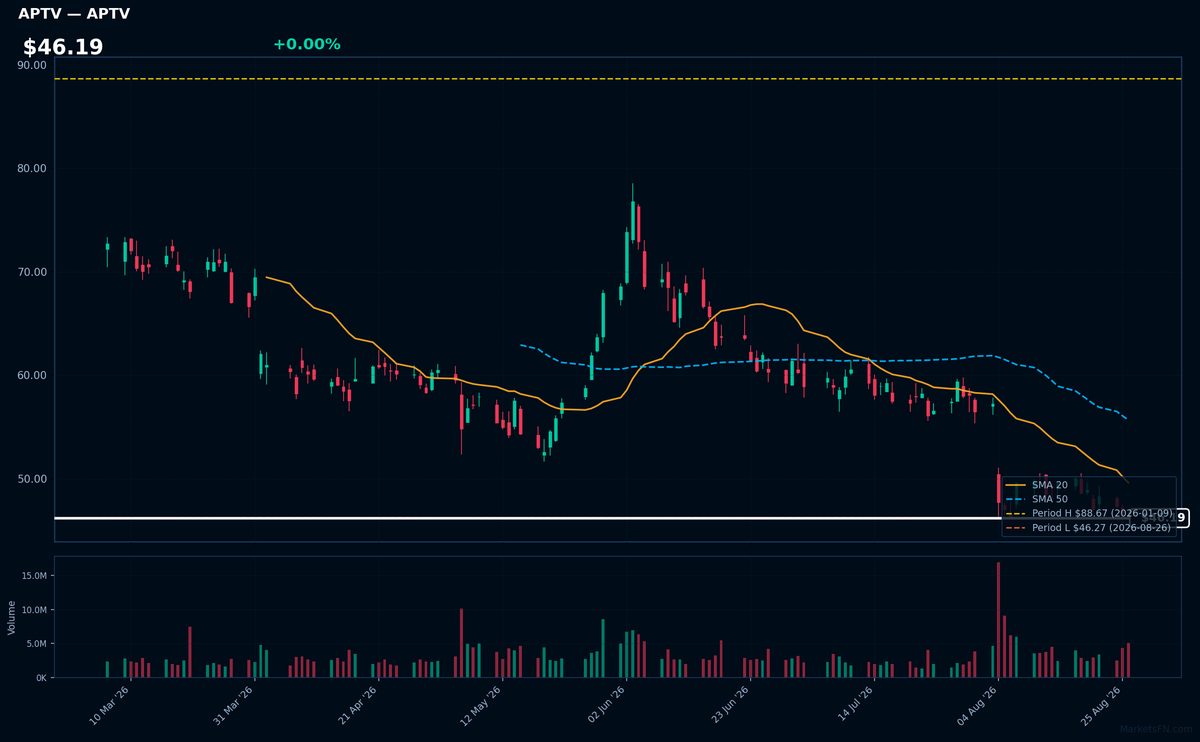
APTV | Aptiv PLC | Consumer Cyclical | Price Last: $46.27 | % Realized: -41.01% | RSI: 33.4 | % above MA200: -31.4% | Trend: Below MA20, MA50, MA200
Aptiv PLC is a global technology company that designs, develops, and manufactures advanced automotive technology, including signal and power distribution, electrical architecture, and software-enabled systems, making it a key player in the evolving automotive landscape.
Aptiv PLC's current technical situation indicates a warning sign with an RSI(14) of 33.4, suggesting oversold conditions, and a bearish MA alignment (price < MA20 < MA50 < MA200), indicating a sustained downtrend, with the stock testing major support at its 2026 YTD low.
Related headlines
Market Commentary
The S&P 500 stocks listed are currently trading near their year-to-date (YTD) extremes for 2026, with some at their highs and others at their lows. Specifically, UNP, DASH, MSI, EA, and STT are at their 2026 YTD highs, while TJX, NKE, TTD, EQR, and APTV are at their 2026 YTD lows.
The stocks near their 2026 YTD highs represent diverse sectors, including industrials (UNP), consumer discretionary (DASH), technology (MSI, EA), and financials (STT). In contrast, the stocks near their 2026 YTD lows are from consumer discretionary (TJX, NKE, TTD), real estate (EQR), and consumer discretionary/technology (APTV) sectors. This indicates varying sectoral performances and potential market conditions influencing these extremes.
Investors should monitor market trends, sector rotations, and company-specific news for these stocks to understand the drivers behind their current extremes. As the year progresses, changes in their prices relative to these extremes may signal shifts in market sentiment or sectoral momentum, providing valuable insights for investment decisions.
Methodology: All 503 S&P 500 constituents screened. Close prices downloaded from 2026-01-01. Period high = highest close since Jan 1 2026; period low = lowest close since Jan 1 2026. Distance = (current price / period extreme − 1) × 100. Technical indicators computed on up to 1 year of daily OHLCV data.
Disclaimer: For informational purposes only. Not investment advice. Past performance is not indicative of future results.