S&P 500 2026 YTD Highs & Lows Radar: Visa (V), L3Harris (LHX) and more
MarketsFN Team

S&P 500 2026 YTD Highs & Lows Radar: Visa (V), L3Harris (LHX) and more
Screening all 503 S&P 500 constituents for stocks nearest to their 2026 year-to-date high and their 2026 YTD low. Data as of August 25, 2026. % Realized = total return since Jan 1 2026.
Legend: RSI > 70 = overbought · RSI < 30 = oversold · Green % Realized = positive YTD return · Red = negative.
📈 Nearest to 2026 High
Sectors represented: Financial (3), Consumer Defensive (1), Healthcare (1)
| Ticker | Company | Sector | Price Last | % Realized | 2026 YTD High Date | RSI | % above MA200 | Trend |
|---|---|---|---|---|---|---|---|---|
| V | Visa Inc | Financial | $382.41 | +10.37% | 2026-08-24 | 68.0 | +15.1% | Above MA20, MA50, MA200 |
| MA | Mastercard Incorporated | Financial | $599.86 | +6.52% | 2026-08-24 | 70.9 | +13.4% | Above MA20, MA50, MA200 |
| KO | Coca-Cola Co | Consumer Defensive | $91.99 | +33.09% | 2026-08-24 | 72.3 | +18.3% | Above MA20, MA50, MA200 |
| SCHW | Charles Schwab Corp | Financial | $113.65 | +11.89% | 2026-08-24 | 68.2 | +17.3% | Above MA20, MA50, MA200 |
| AMGN | AMGEN Inc | Healthcare | $443.84 | +35.47% | 2026-08-24 | 74.9 | +25.3% | Above MA20, MA50, MA200 |
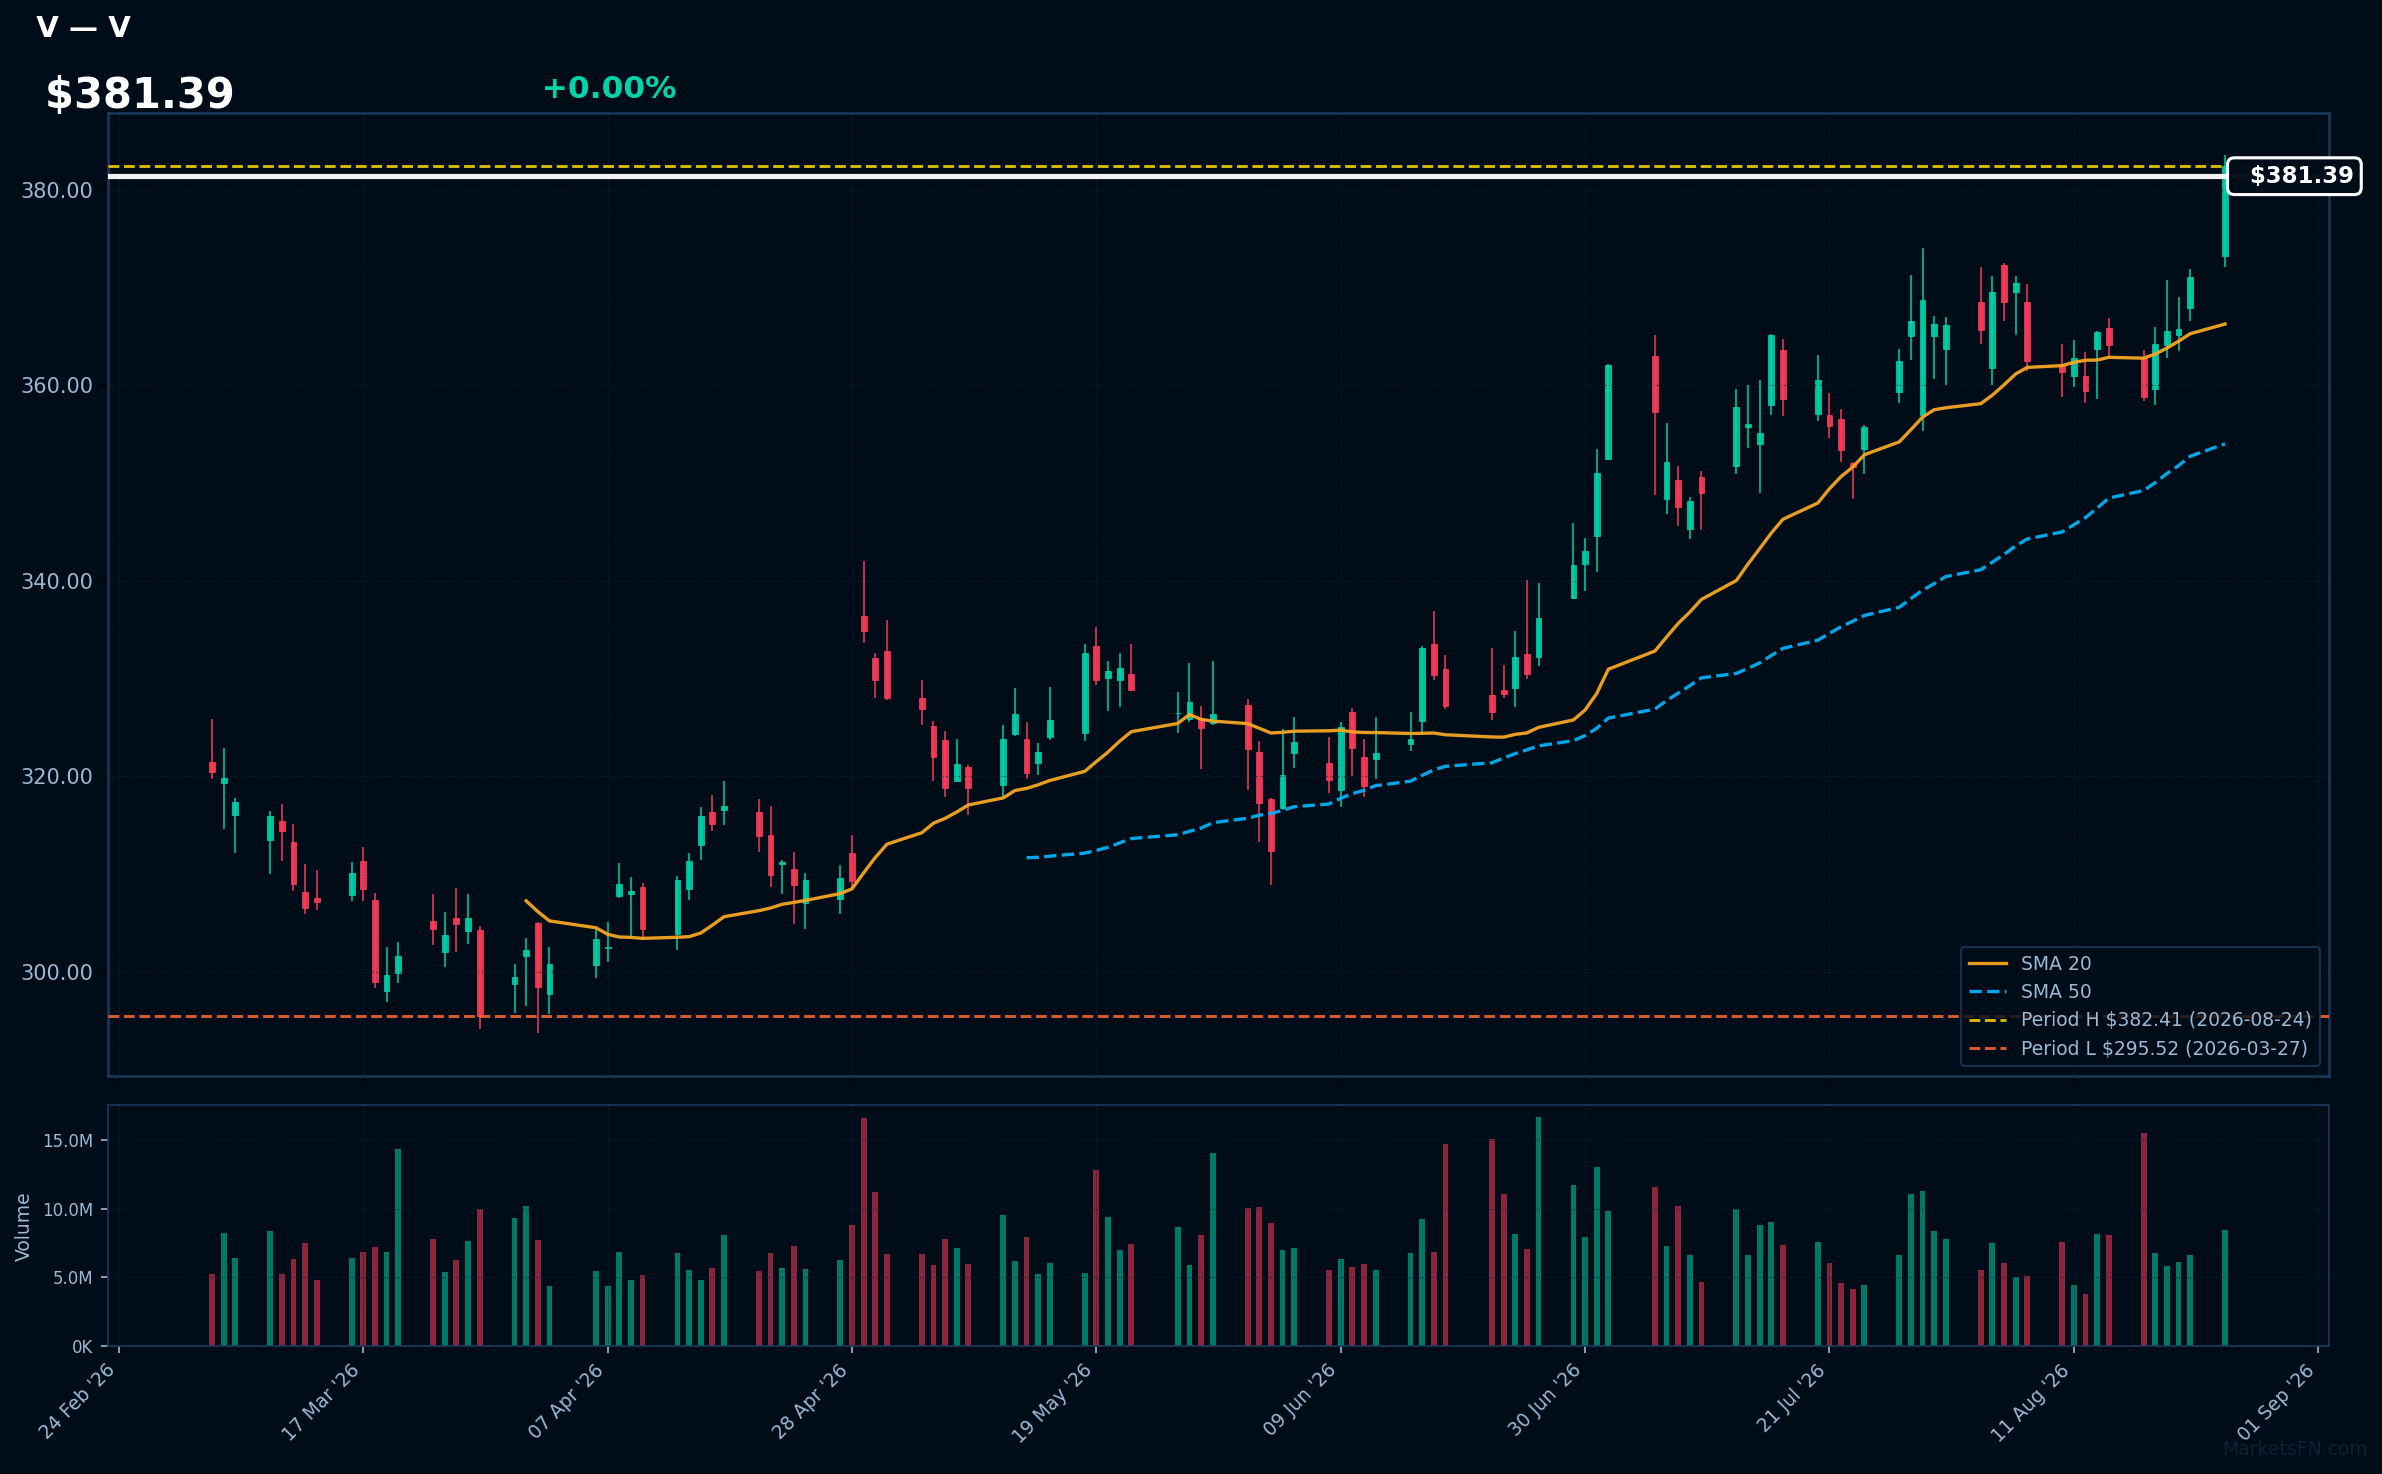
V | Visa Inc | Financial | Price Last: $382.41 | % Realized: +10.37% | RSI: 68.0 | % above MA200: +15.1% | Trend: Above MA20, MA50, MA200
Visa Inc operates a global payments technology network, facilitating electronic funds transfers and enabling secure transactions for consumers and businesses. Investors should care due to its critical role in the growing digital payment landscape, which is increasingly vital for global commerce.
The current technical situation shows bullish momentum, with an RSI of 68.0 and a strong MA alignment: price > MA20 > MA50 > MA200. The stock is also 0.0% below its 2026 YTD high, indicating a potential breakout.
Related headlines
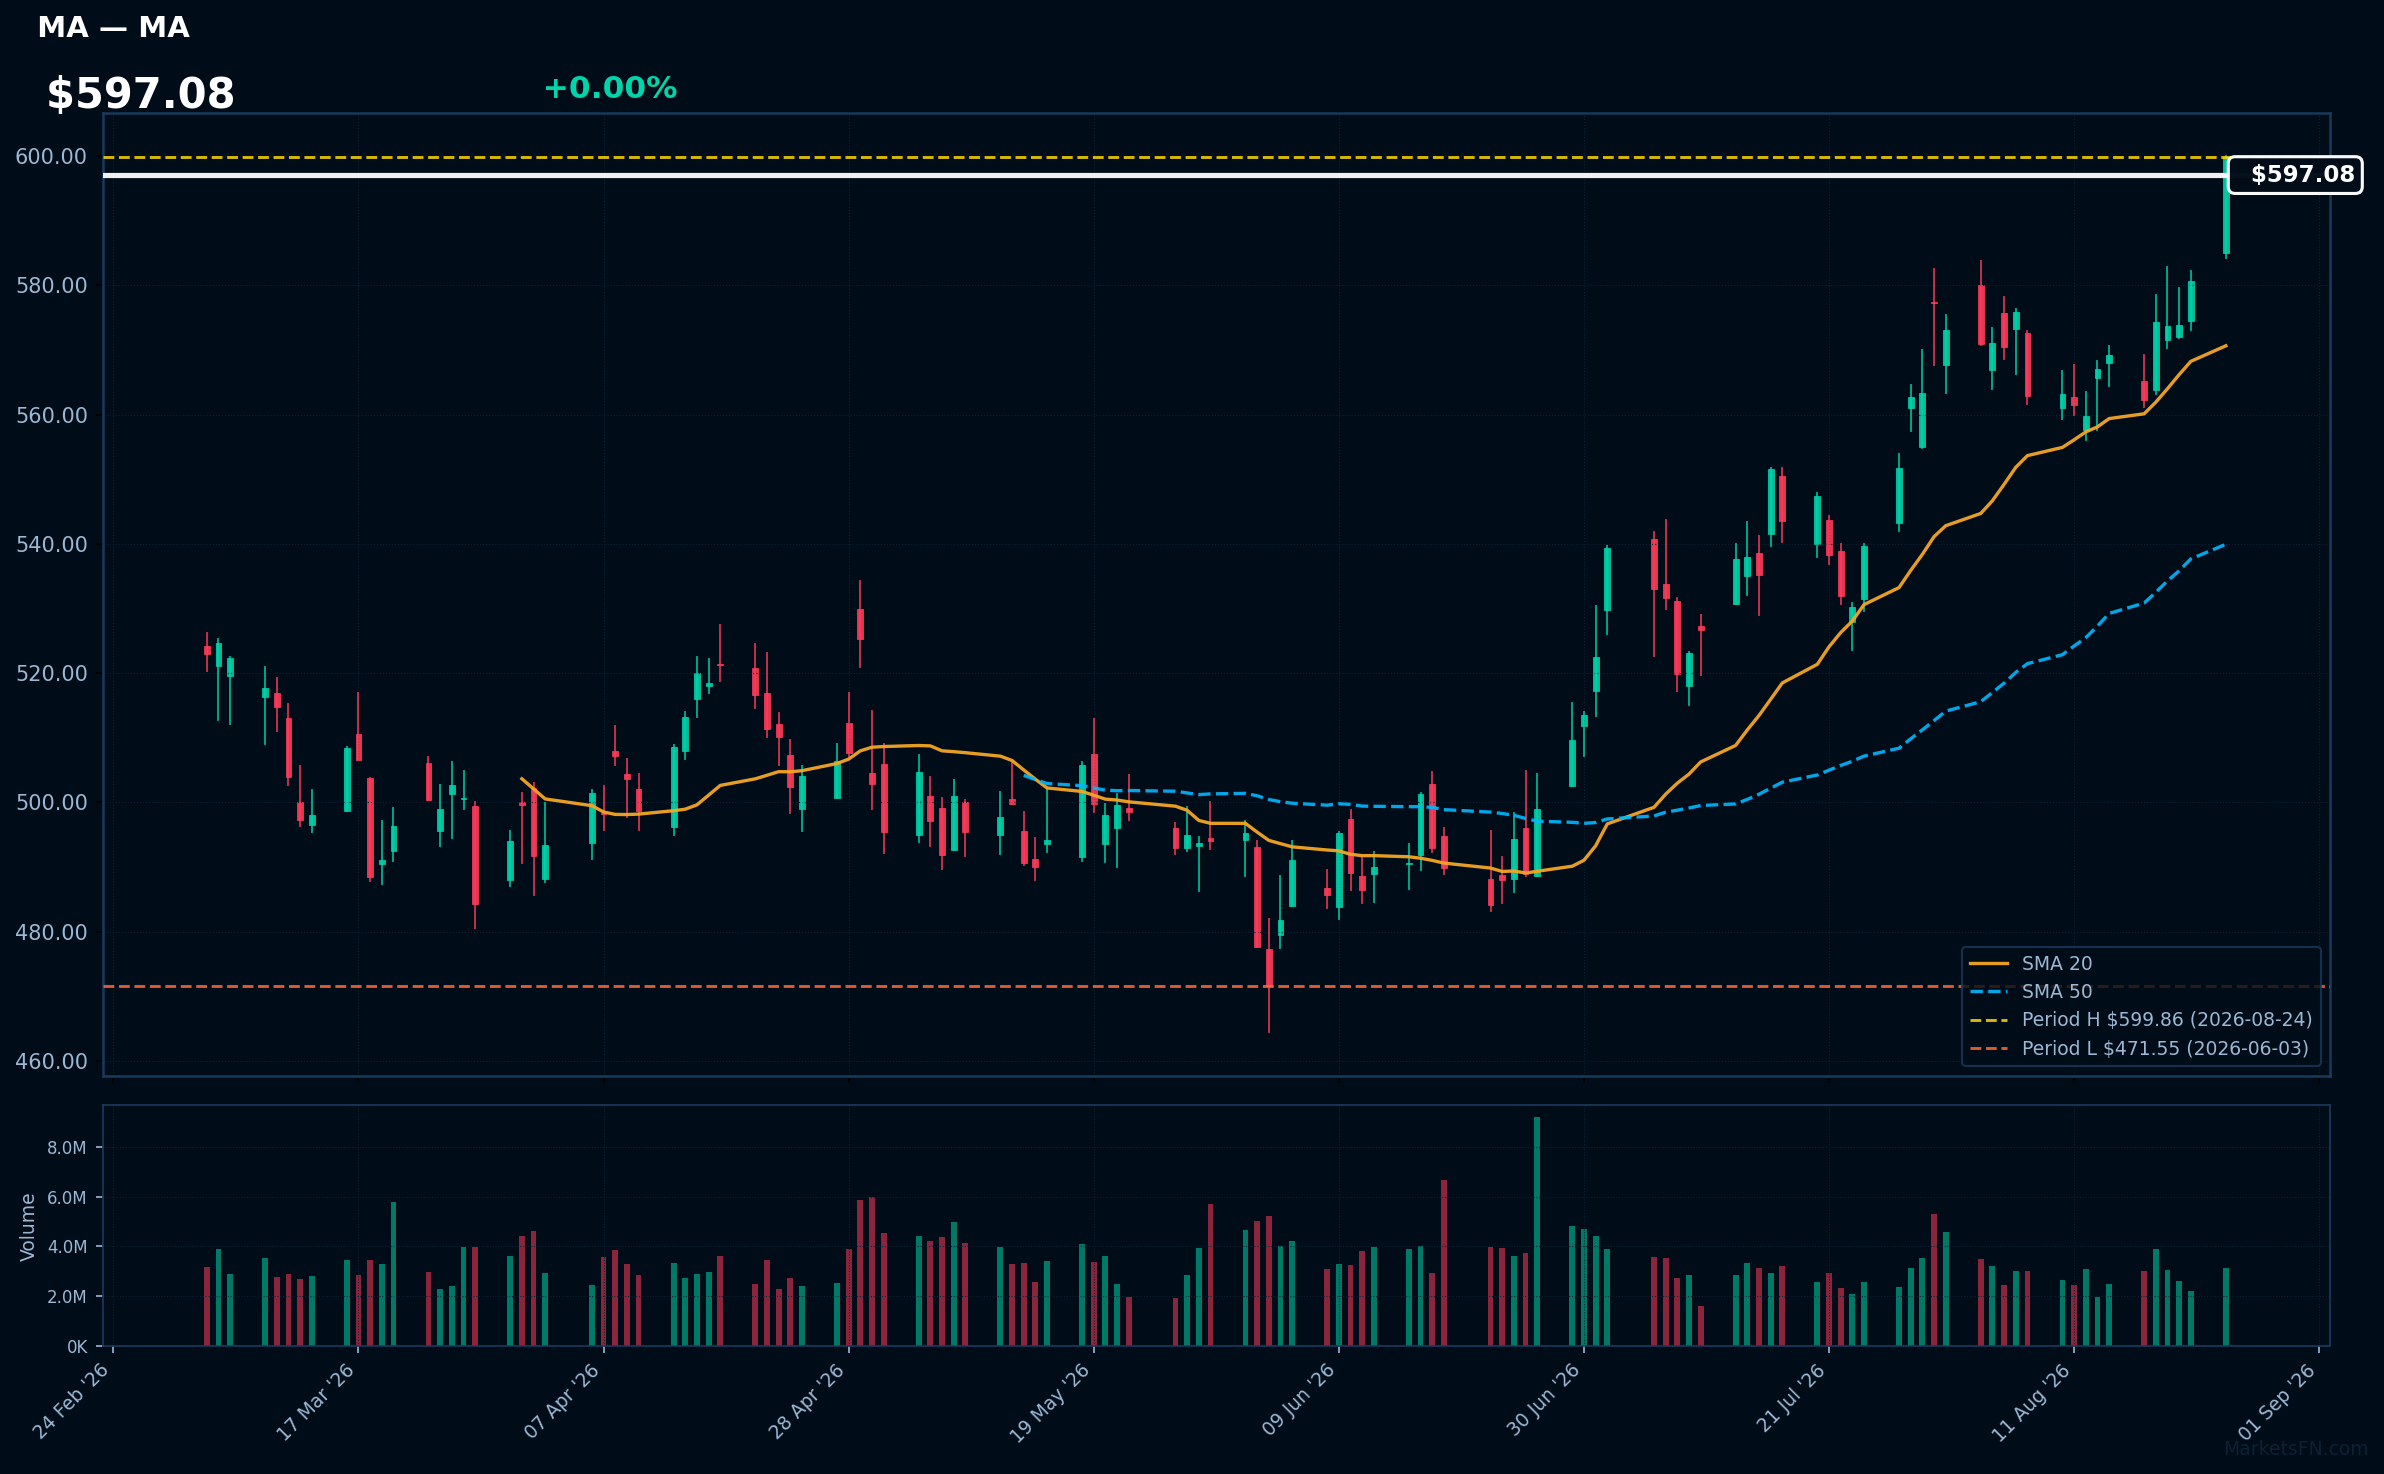
MA | Mastercard Incorporated | Financial | Price Last: $599.86 | % Realized: +6.52% | RSI: 70.9 | % above MA200: +13.4% | Trend: Above MA20, MA50, MA200
Mastercard Incorporated (MA) is a global payments technology company facilitating electronic funds transfers. Investors should care due to its critical role in the growing digital payment landscape, which is expected to expand as more consumers and businesses shift to cashless transactions.
Currently, Mastercard shows bullish momentum with an RSI(14) of 70.9 and a strong MA alignment: price > MA20 > MA50 > MA200. The stock is also 0.0% below its 2026 YTD high, indicating a potential breakout.
Related headlines
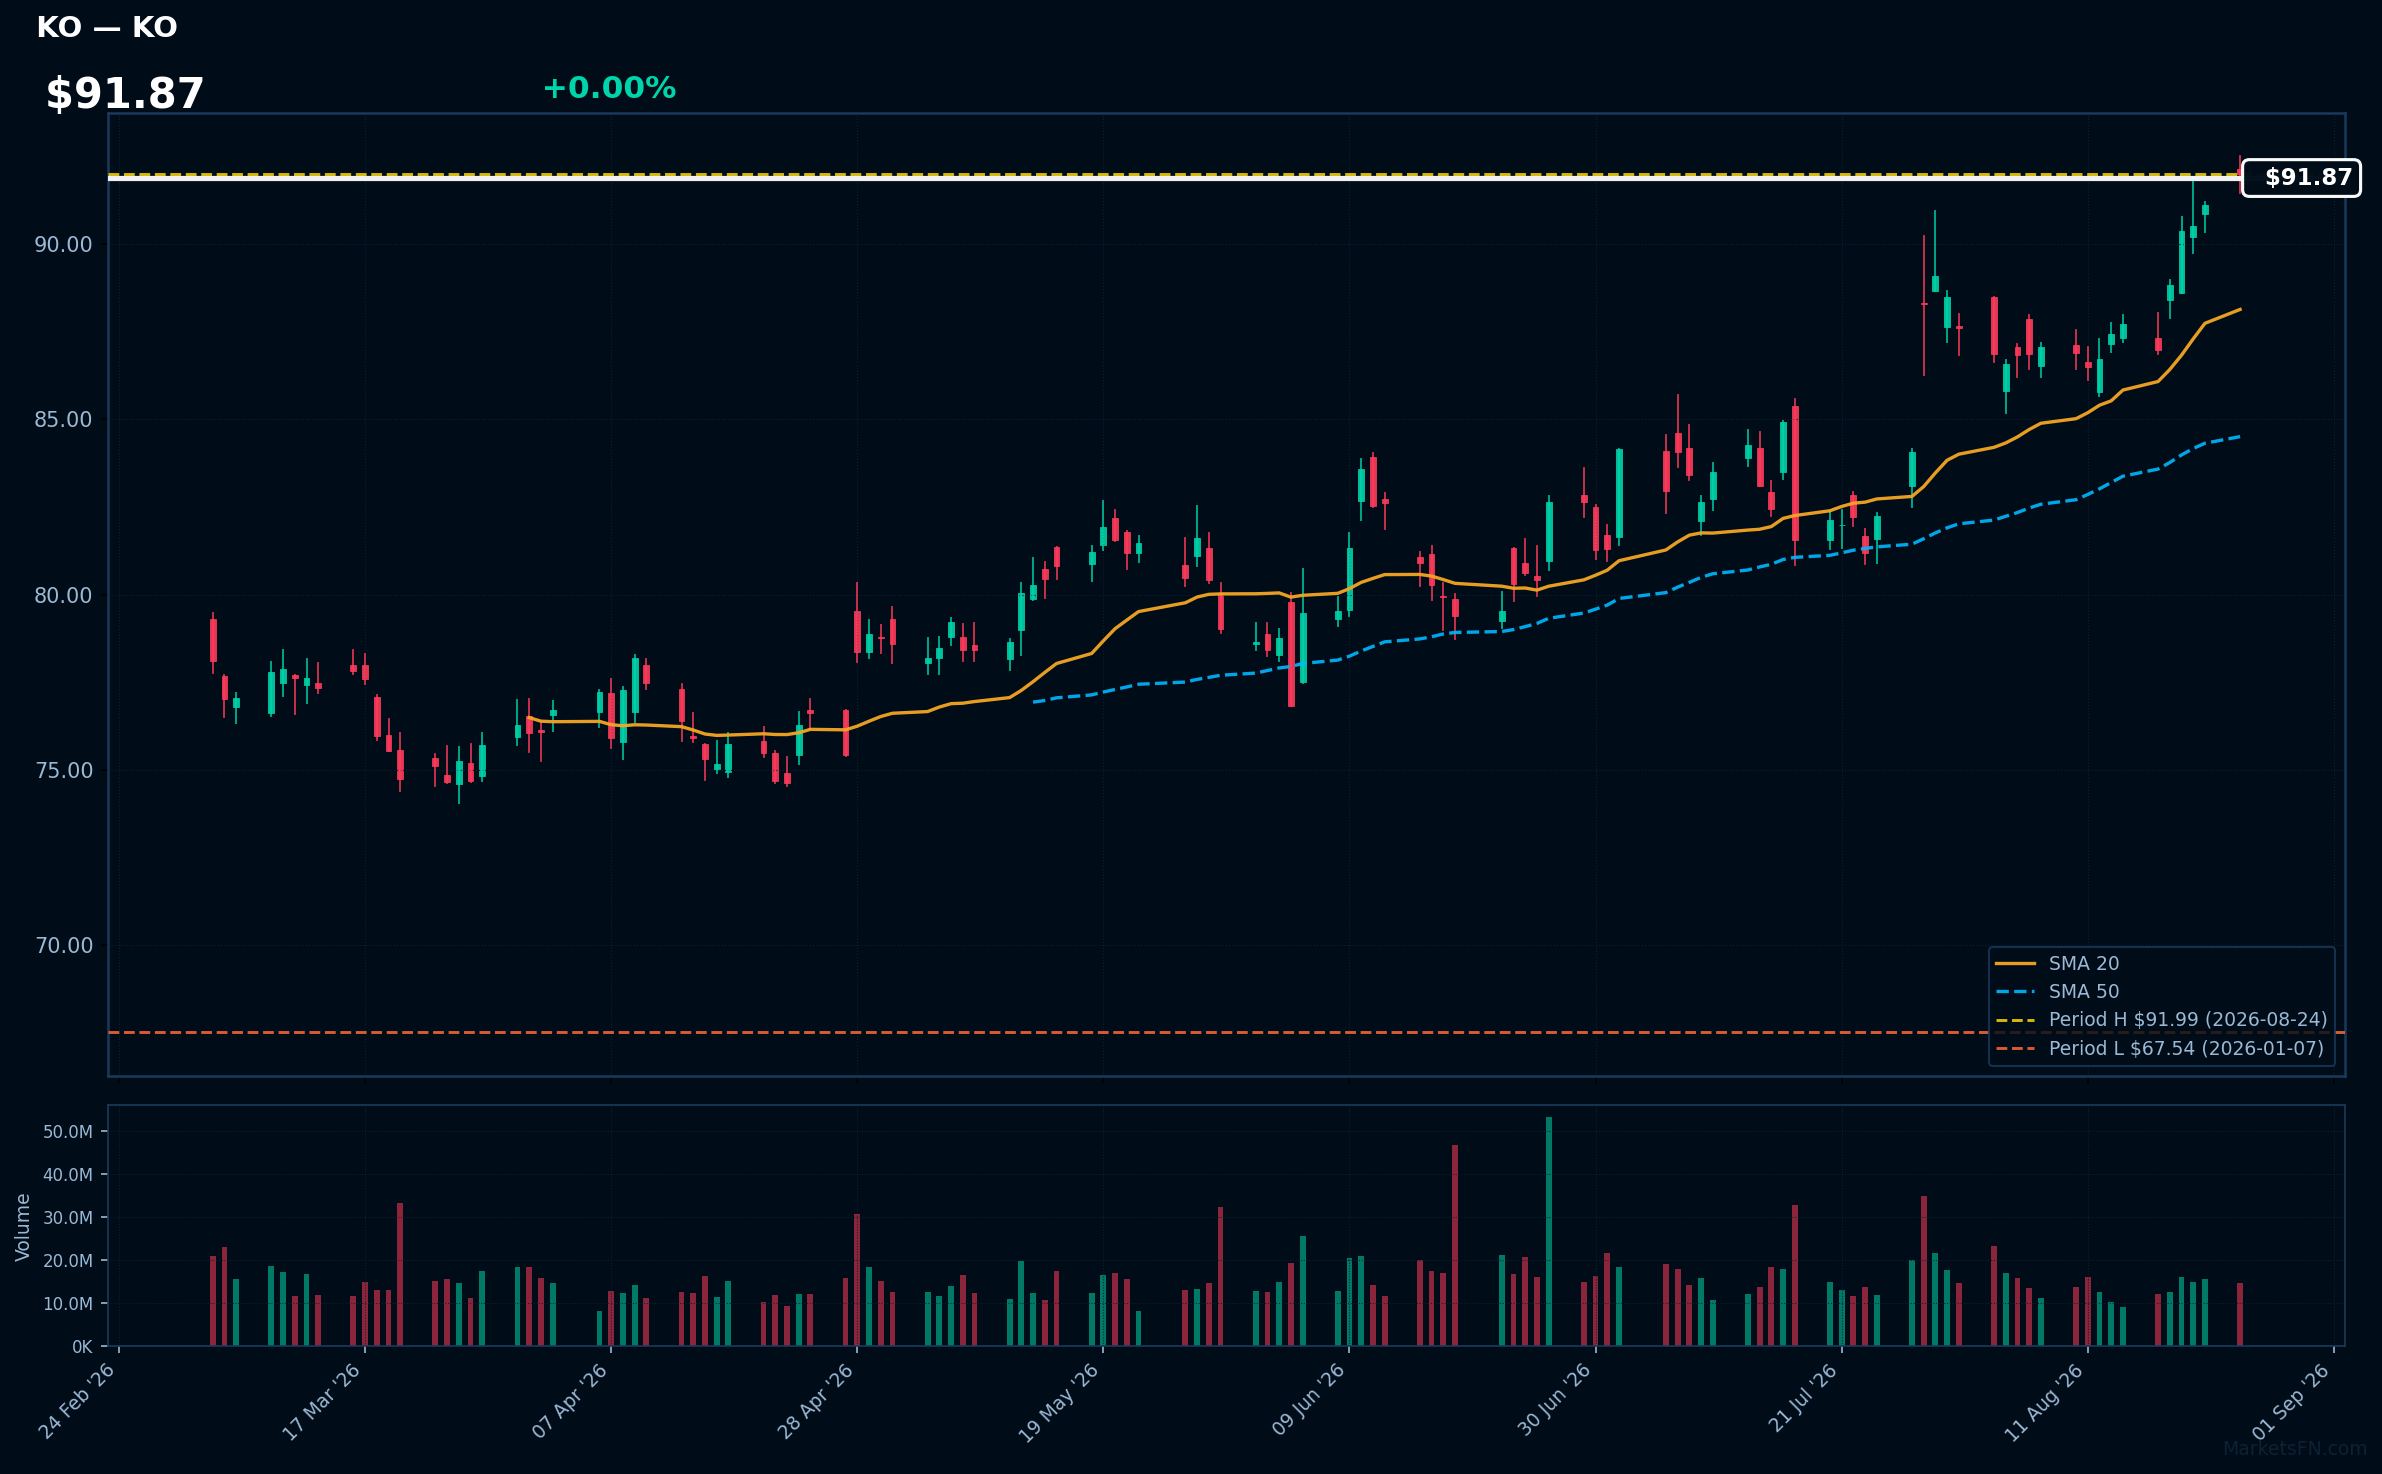
KO | Coca-Cola Co | Consumer Defensive | Price Last: $91.99 | % Realized: +33.09% | RSI: 72.3 | % above MA200: +18.3% | Trend: Above MA20, MA50, MA200
Coca-Cola Co (KO) is a leading beverage company, known for its extensive portfolio of non-alcoholic drinks, including soft drinks, juices, and bottled water. Investors should care due to its strong brand recognition and consistent demand, which drive stable revenue and dividend growth.
The current technical situation indicates bullish momentum, with an RSI(14) of 72.3 and a bullish MA alignment: price > MA20 > MA50 > MA200. The stock is also 0.0% below its 2026 YTD high, suggesting a potential breakout.
Related headlines
- Coca-Cola's new CEO can boast about something that billionaire Mag 7 members Elon Musk and Mark Zuckerberg can't
- Coca-Cola's new CEO can boast about something that 'Magnificent 7' members Elon Musk and Mark Zuckerberg can't
- Coca-Cola Just Won a Key Consumer Battle
- Why Olipop's founder hasn't sold out to Pepsi or Coca-Cola
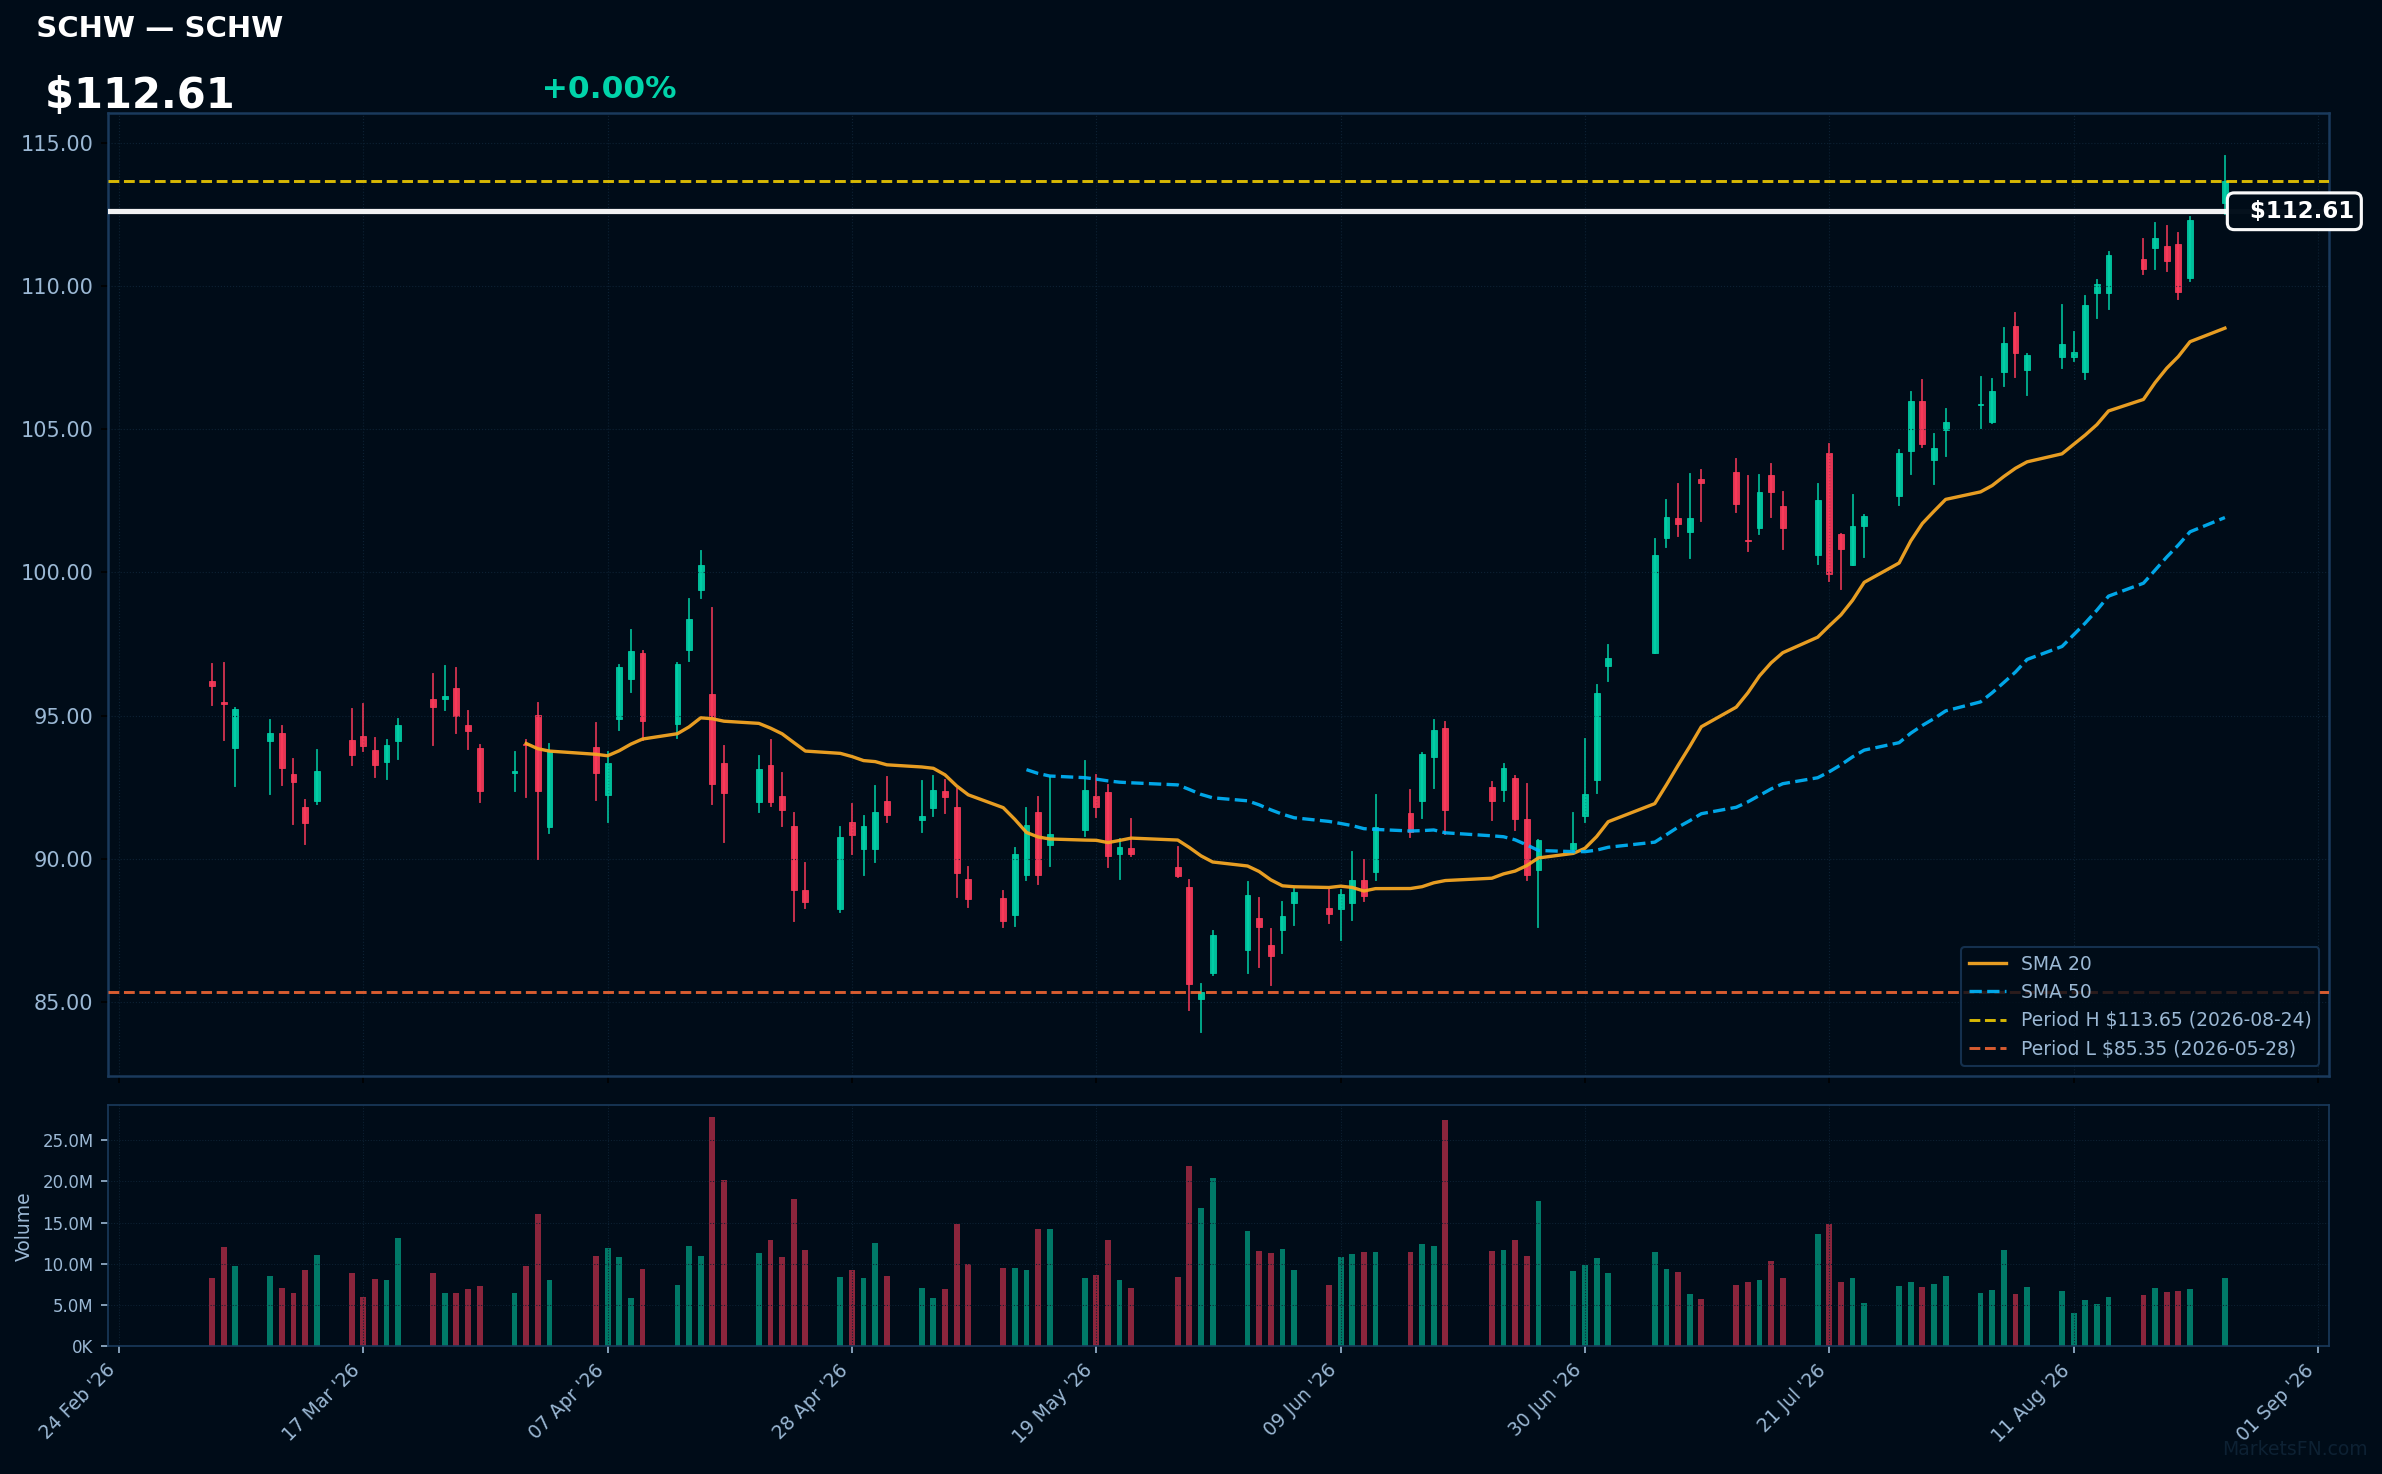
SCHW | Charles Schwab Corp | Financial | Price Last: $113.65 | % Realized: +11.89% | RSI: 68.2 | % above MA200: +17.3% | Trend: Above MA20, MA50, MA200
Charles Schwab Corp provides brokerage and investment services, focusing on low-cost trading and wealth management. Investors should care due to its strong market position and innovative technology, which attract a growing client base and enhance profitability.
The current technical situation shows bullish momentum with an RSI(14) of 68.2 and a bullish MA alignment: price > MA20 > MA50 > MA200. The stock is 0.0% below its 2026 YTD high, indicating potential for a breakout.
Related headlines
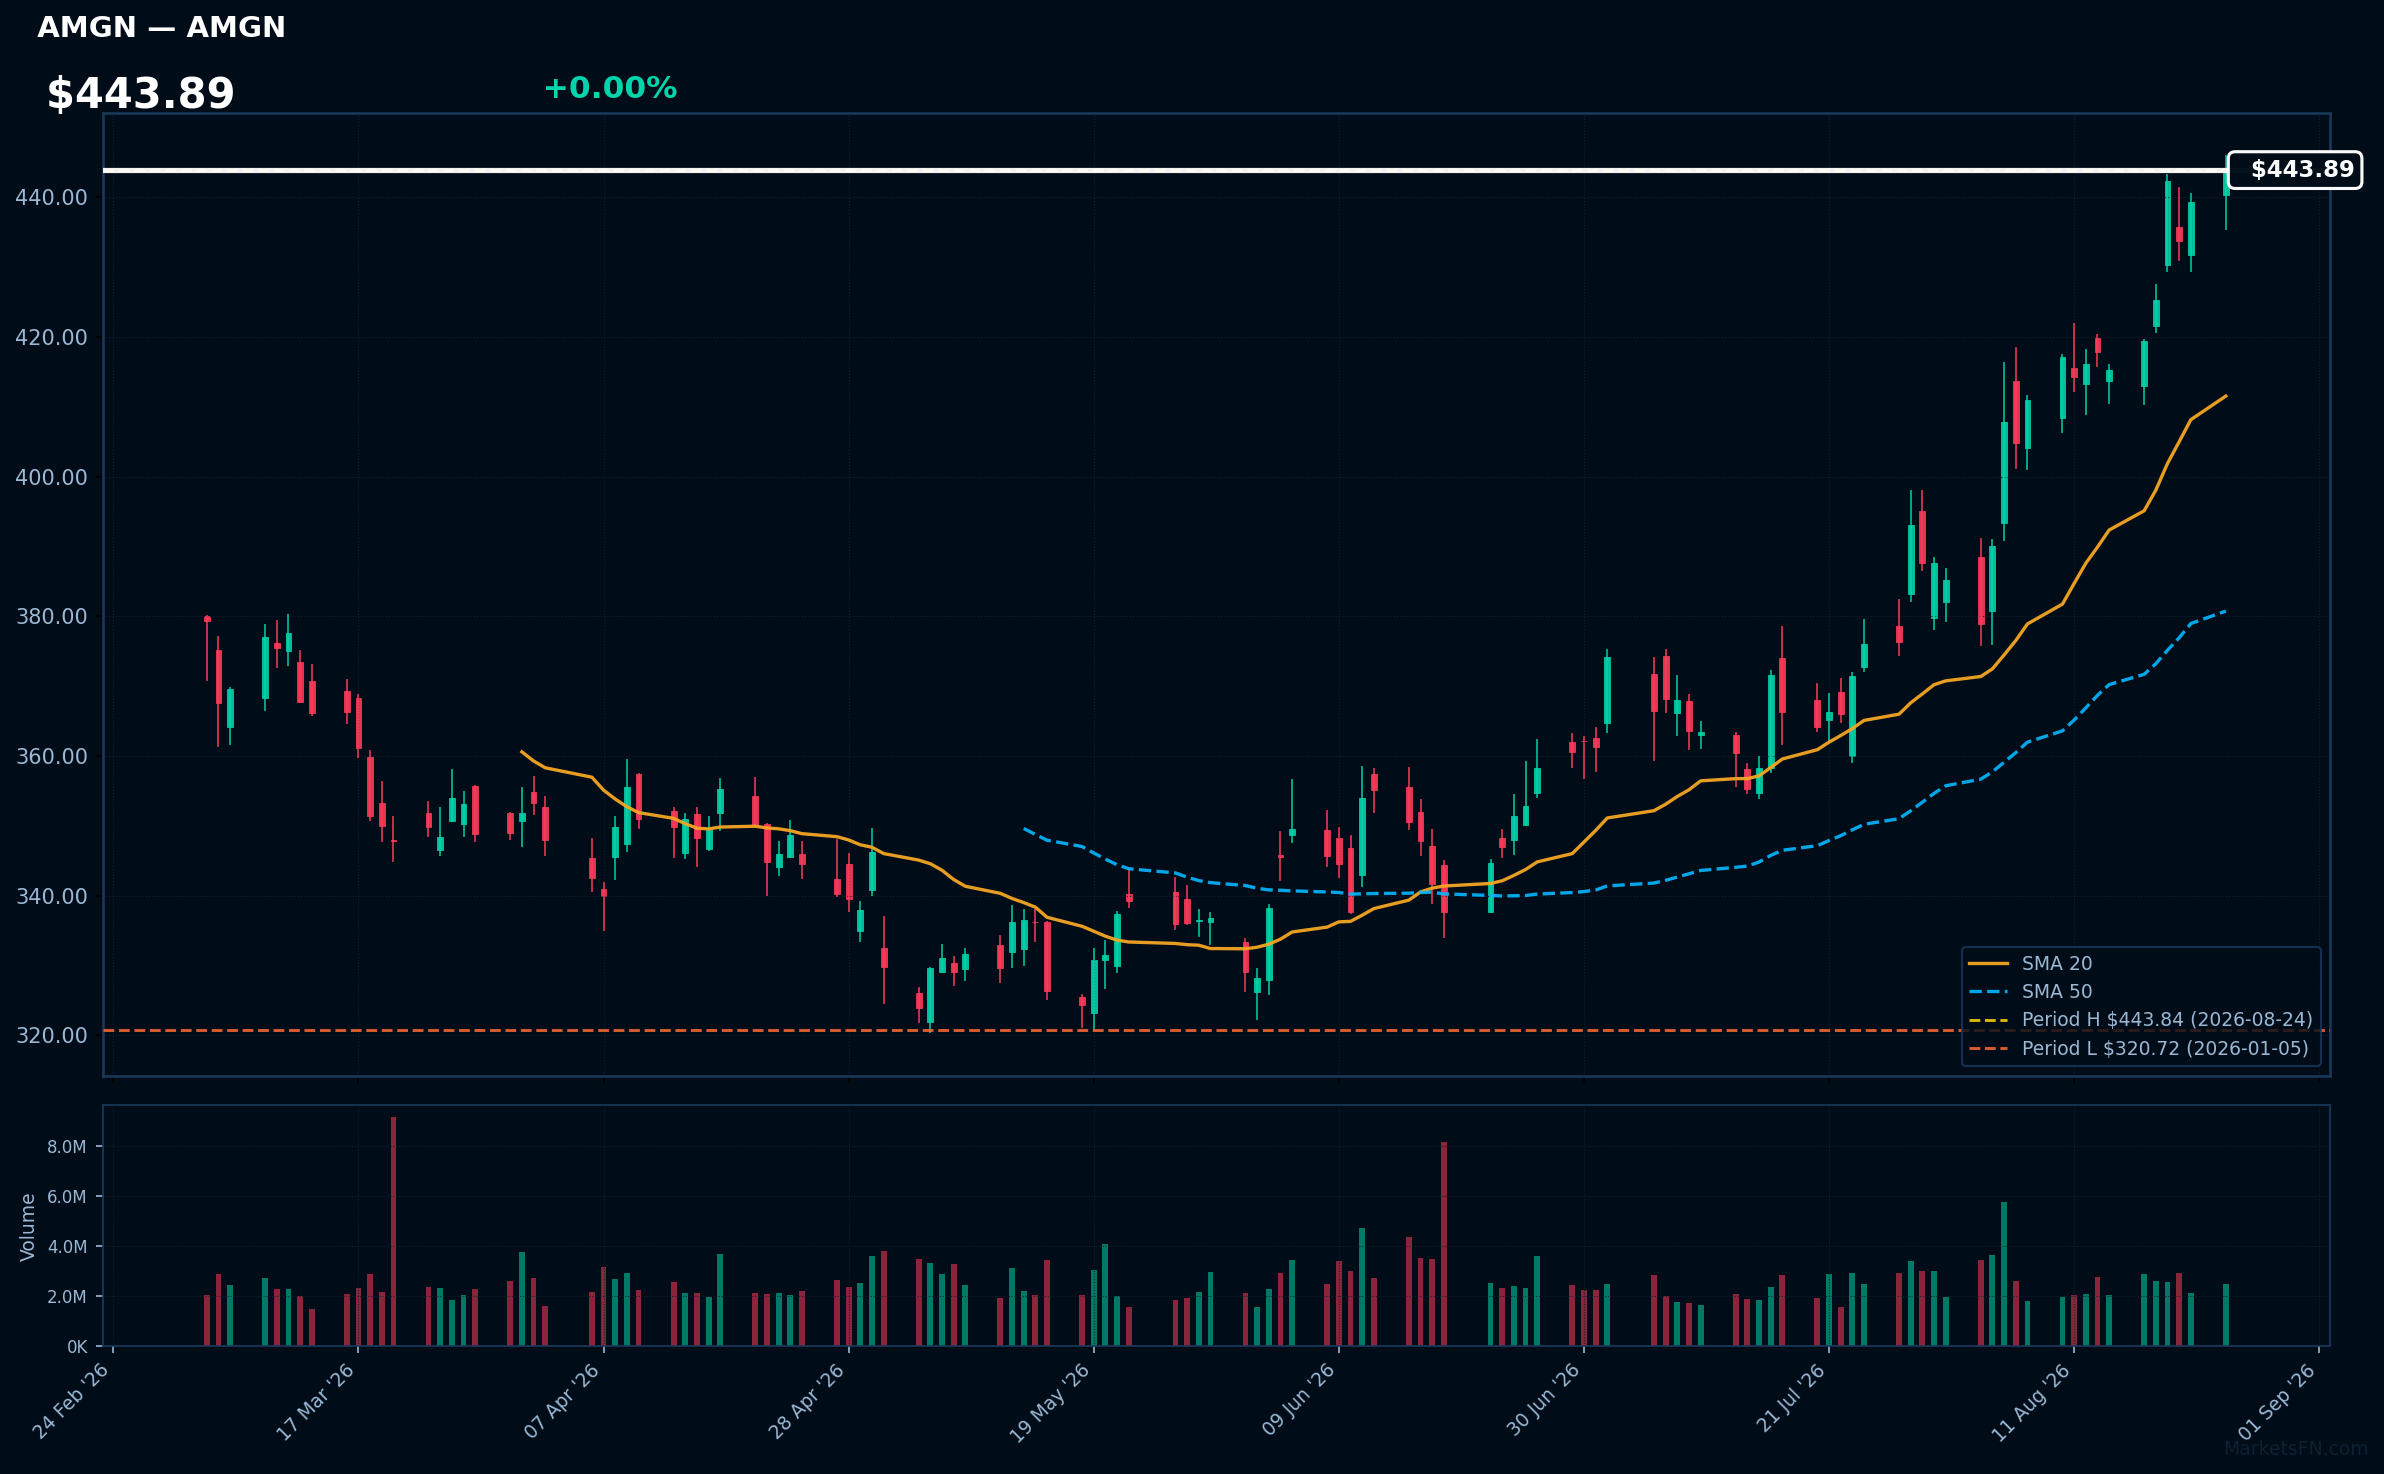
AMGN | AMGEN Inc | Healthcare | Price Last: $443.84 | % Realized: +35.47% | RSI: 74.9 | % above MA200: +25.3% | Trend: Above MA20, MA50, MA200
AMGEN Inc (AMGN) is a biotechnology company focused on developing innovative therapies for serious illnesses, particularly in oncology and cardiovascular diseases. Investors should care due to its strong pipeline and potential for significant market impact, which can drive future revenue growth.
AMGN shows bullish momentum with an RSI(14) of 74.9 and a strong MA alignment: price > MA20 > MA50 > MA200. The stock is 0.0% below its 2026 YTD high, indicating a potential breakout level.
Related headlines
📉 Nearest to 2026 Low
Sectors represented: Industrials (3), Utilities (1), Consumer Cyclical (1)
| Ticker | Company | Sector | Price Last | % Realized | 2026 YTD Low Date | RSI | % above MA200 | Trend |
|---|---|---|---|---|---|---|---|---|
| LHX | L3Harris Technologies Inc | Industrials | $262.83 | -13.68% | 2026-08-24 | 33.0 | -16.6% | Below MA20, MA50, MA200 |
| NRG | NRG Energy Inc | Utilities | $111.78 | -32.73% | 2026-08-24 | 40.3 | -24.9% | Below MA20, MA50, MA200 |
| LII | Lennox International Inc | Industrials | $399.10 | -20.01% | 2026-08-24 | 29.4 | -20.5% | Below MA20, MA50, MA200 |
| TXT | Textron Inc | Industrials | $82.13 | -5.65% | 2026-08-24 | 34.0 | -8.8% | Below MA20, MA50, MA200 |
| TJX | TJX Companies, Inc | Consumer Cyclical | $140.71 | -8.80% | 2026-08-21 | 25.9 | -9.3% | Below MA20, MA50, MA200 |
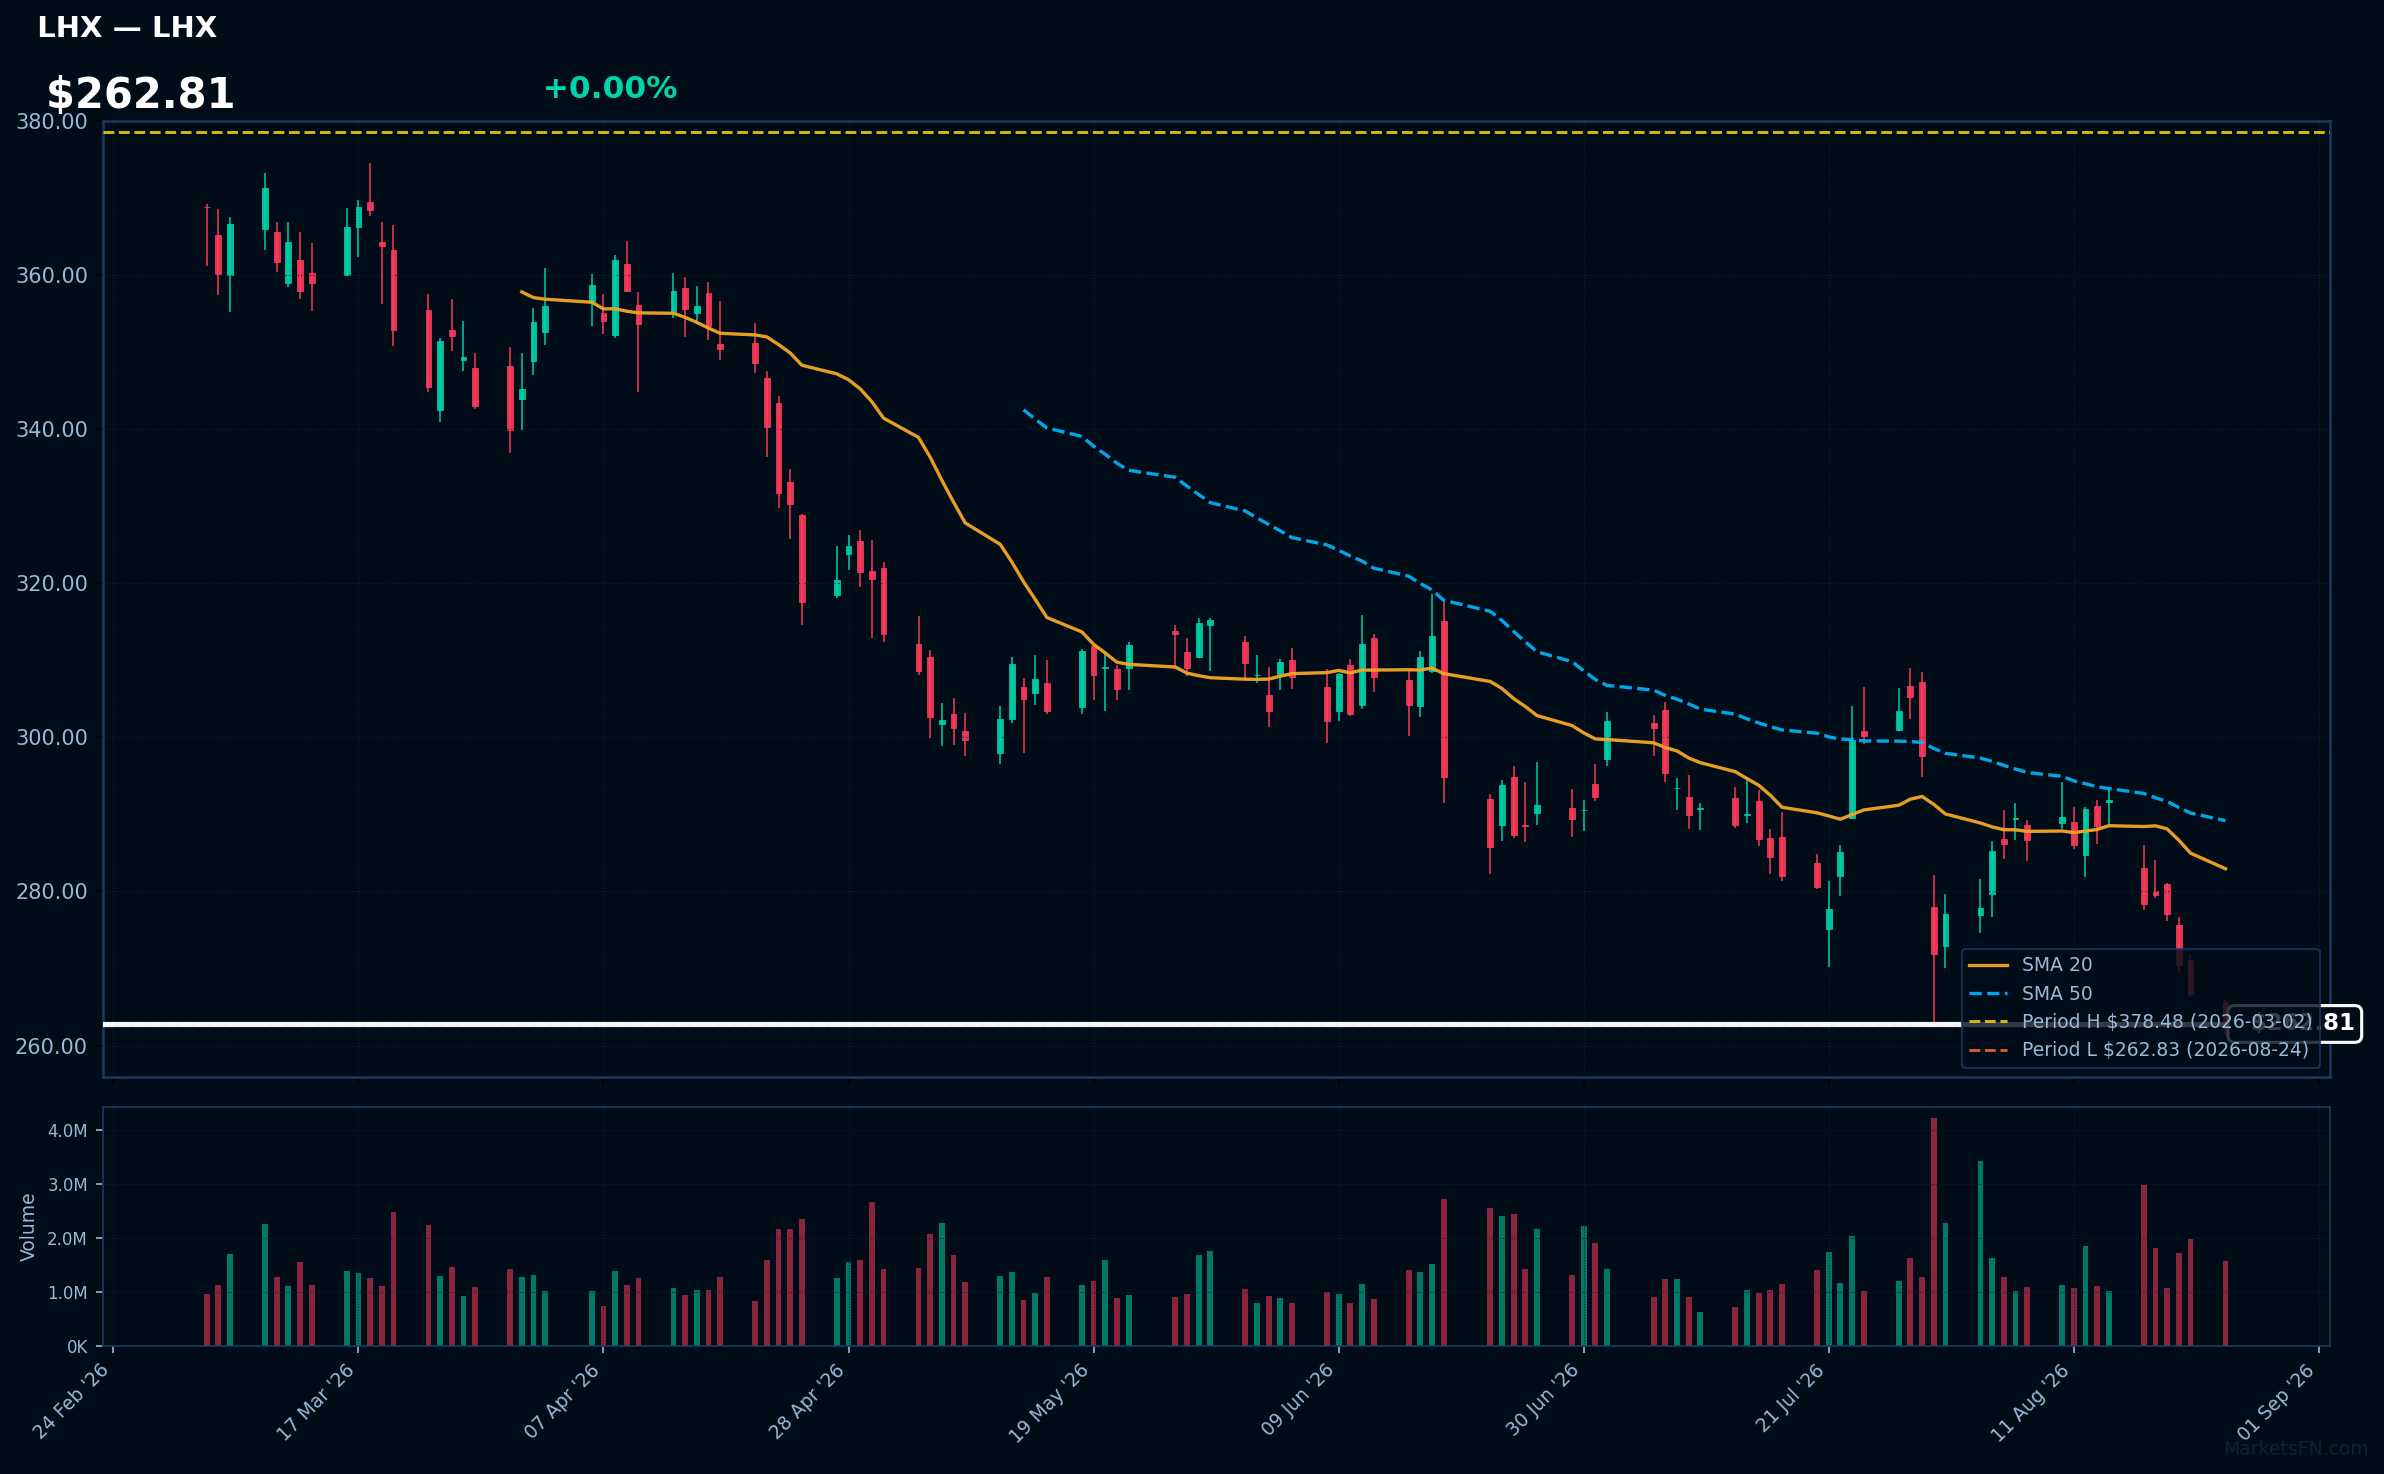
LHX | L3Harris Technologies Inc | Industrials | Price Last: $262.83 | % Realized: -13.68% | RSI: 33.0 | % above MA200: -16.6% | Trend: Below MA20, MA50, MA200
L3Harris Technologies Inc specializes in communication and electronic systems for government and commercial customers, focusing on defense, aerospace, and public safety. Investors should care due to its critical role in national security and technological advancements, which can drive long-term growth.
The current technical situation indicates a bearish trend, with an RSI(14) of 33.0 and a MA alignment of price < MA20 < MA50 < MA200, suggesting sustained downtrend and potential warning signs for investors.
Related headlines
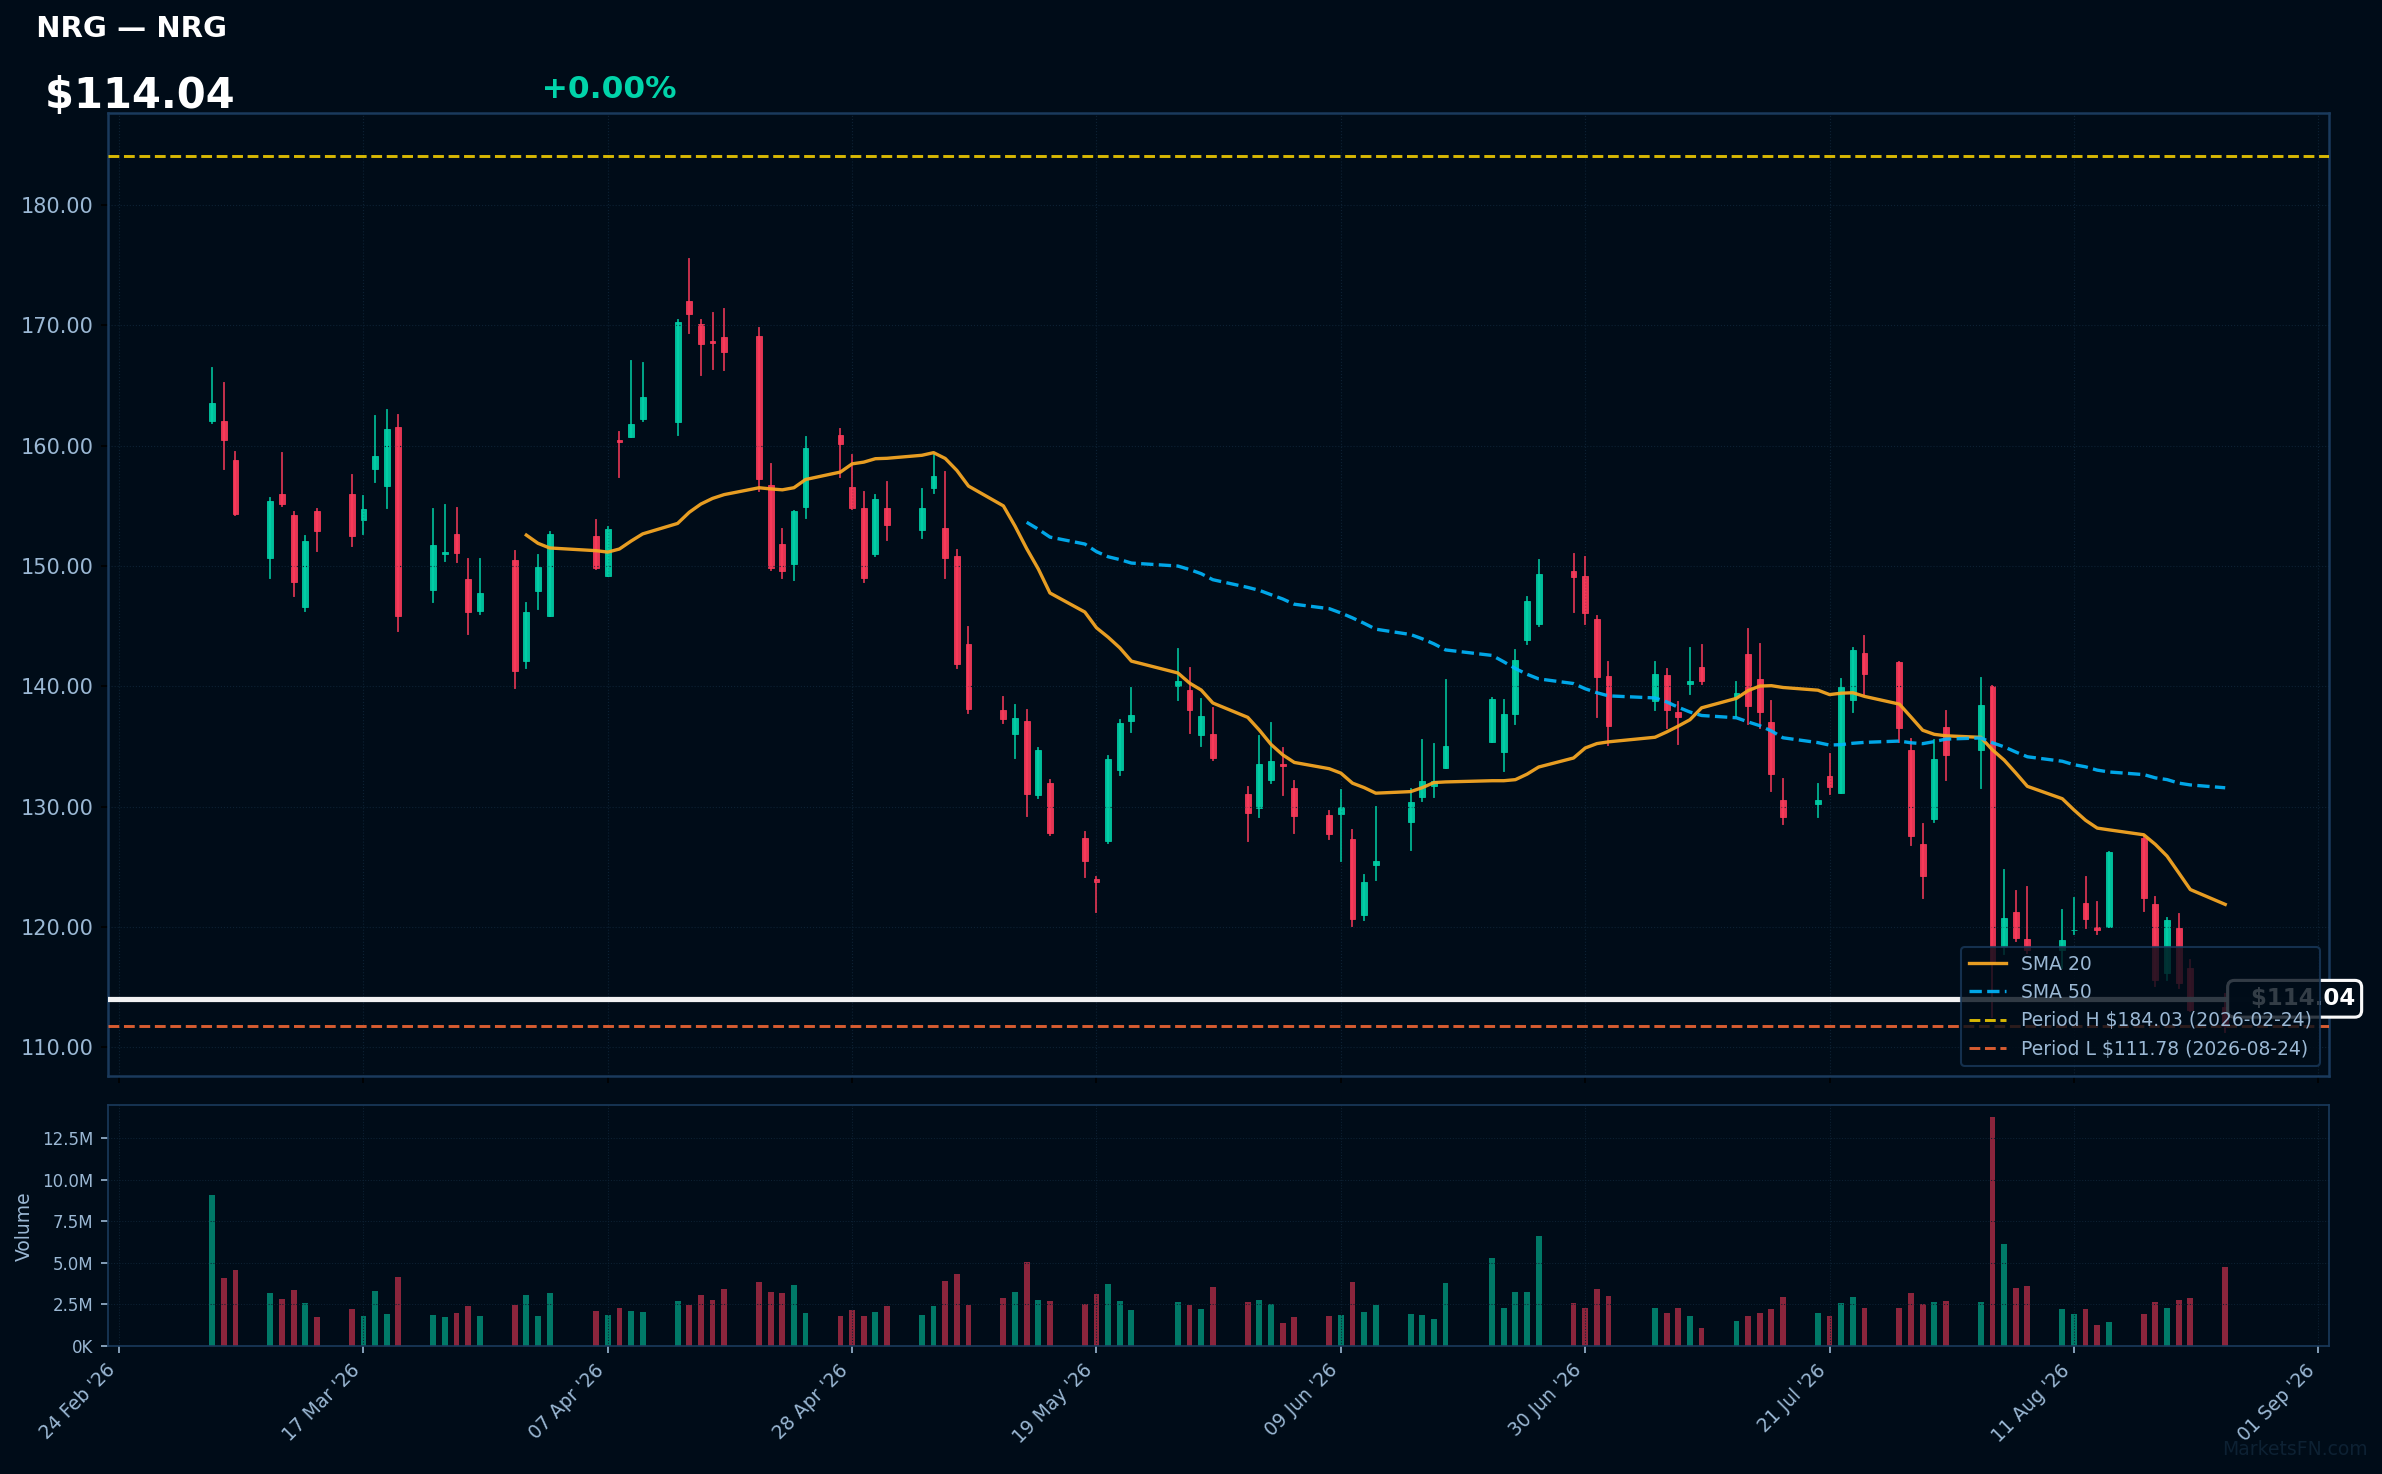
NRG | NRG Energy Inc | Utilities | Price Last: $111.78 | % Realized: -32.73% | RSI: 40.3 | % above MA200: -24.9% | Trend: Below MA20, MA50, MA200
NRG Energy Inc is a leading integrated power company, providing electricity and energy solutions across the U.S. Investors should care due to its significant role in the energy transition and potential for growth in renewable energy markets.
The current technical situation indicates a bearish trend, with an RSI(14) of 40.3 and a MA alignment of price < MA20 < MA50 < MA200, suggesting sustained downtrend and testing major support.
Related headlines
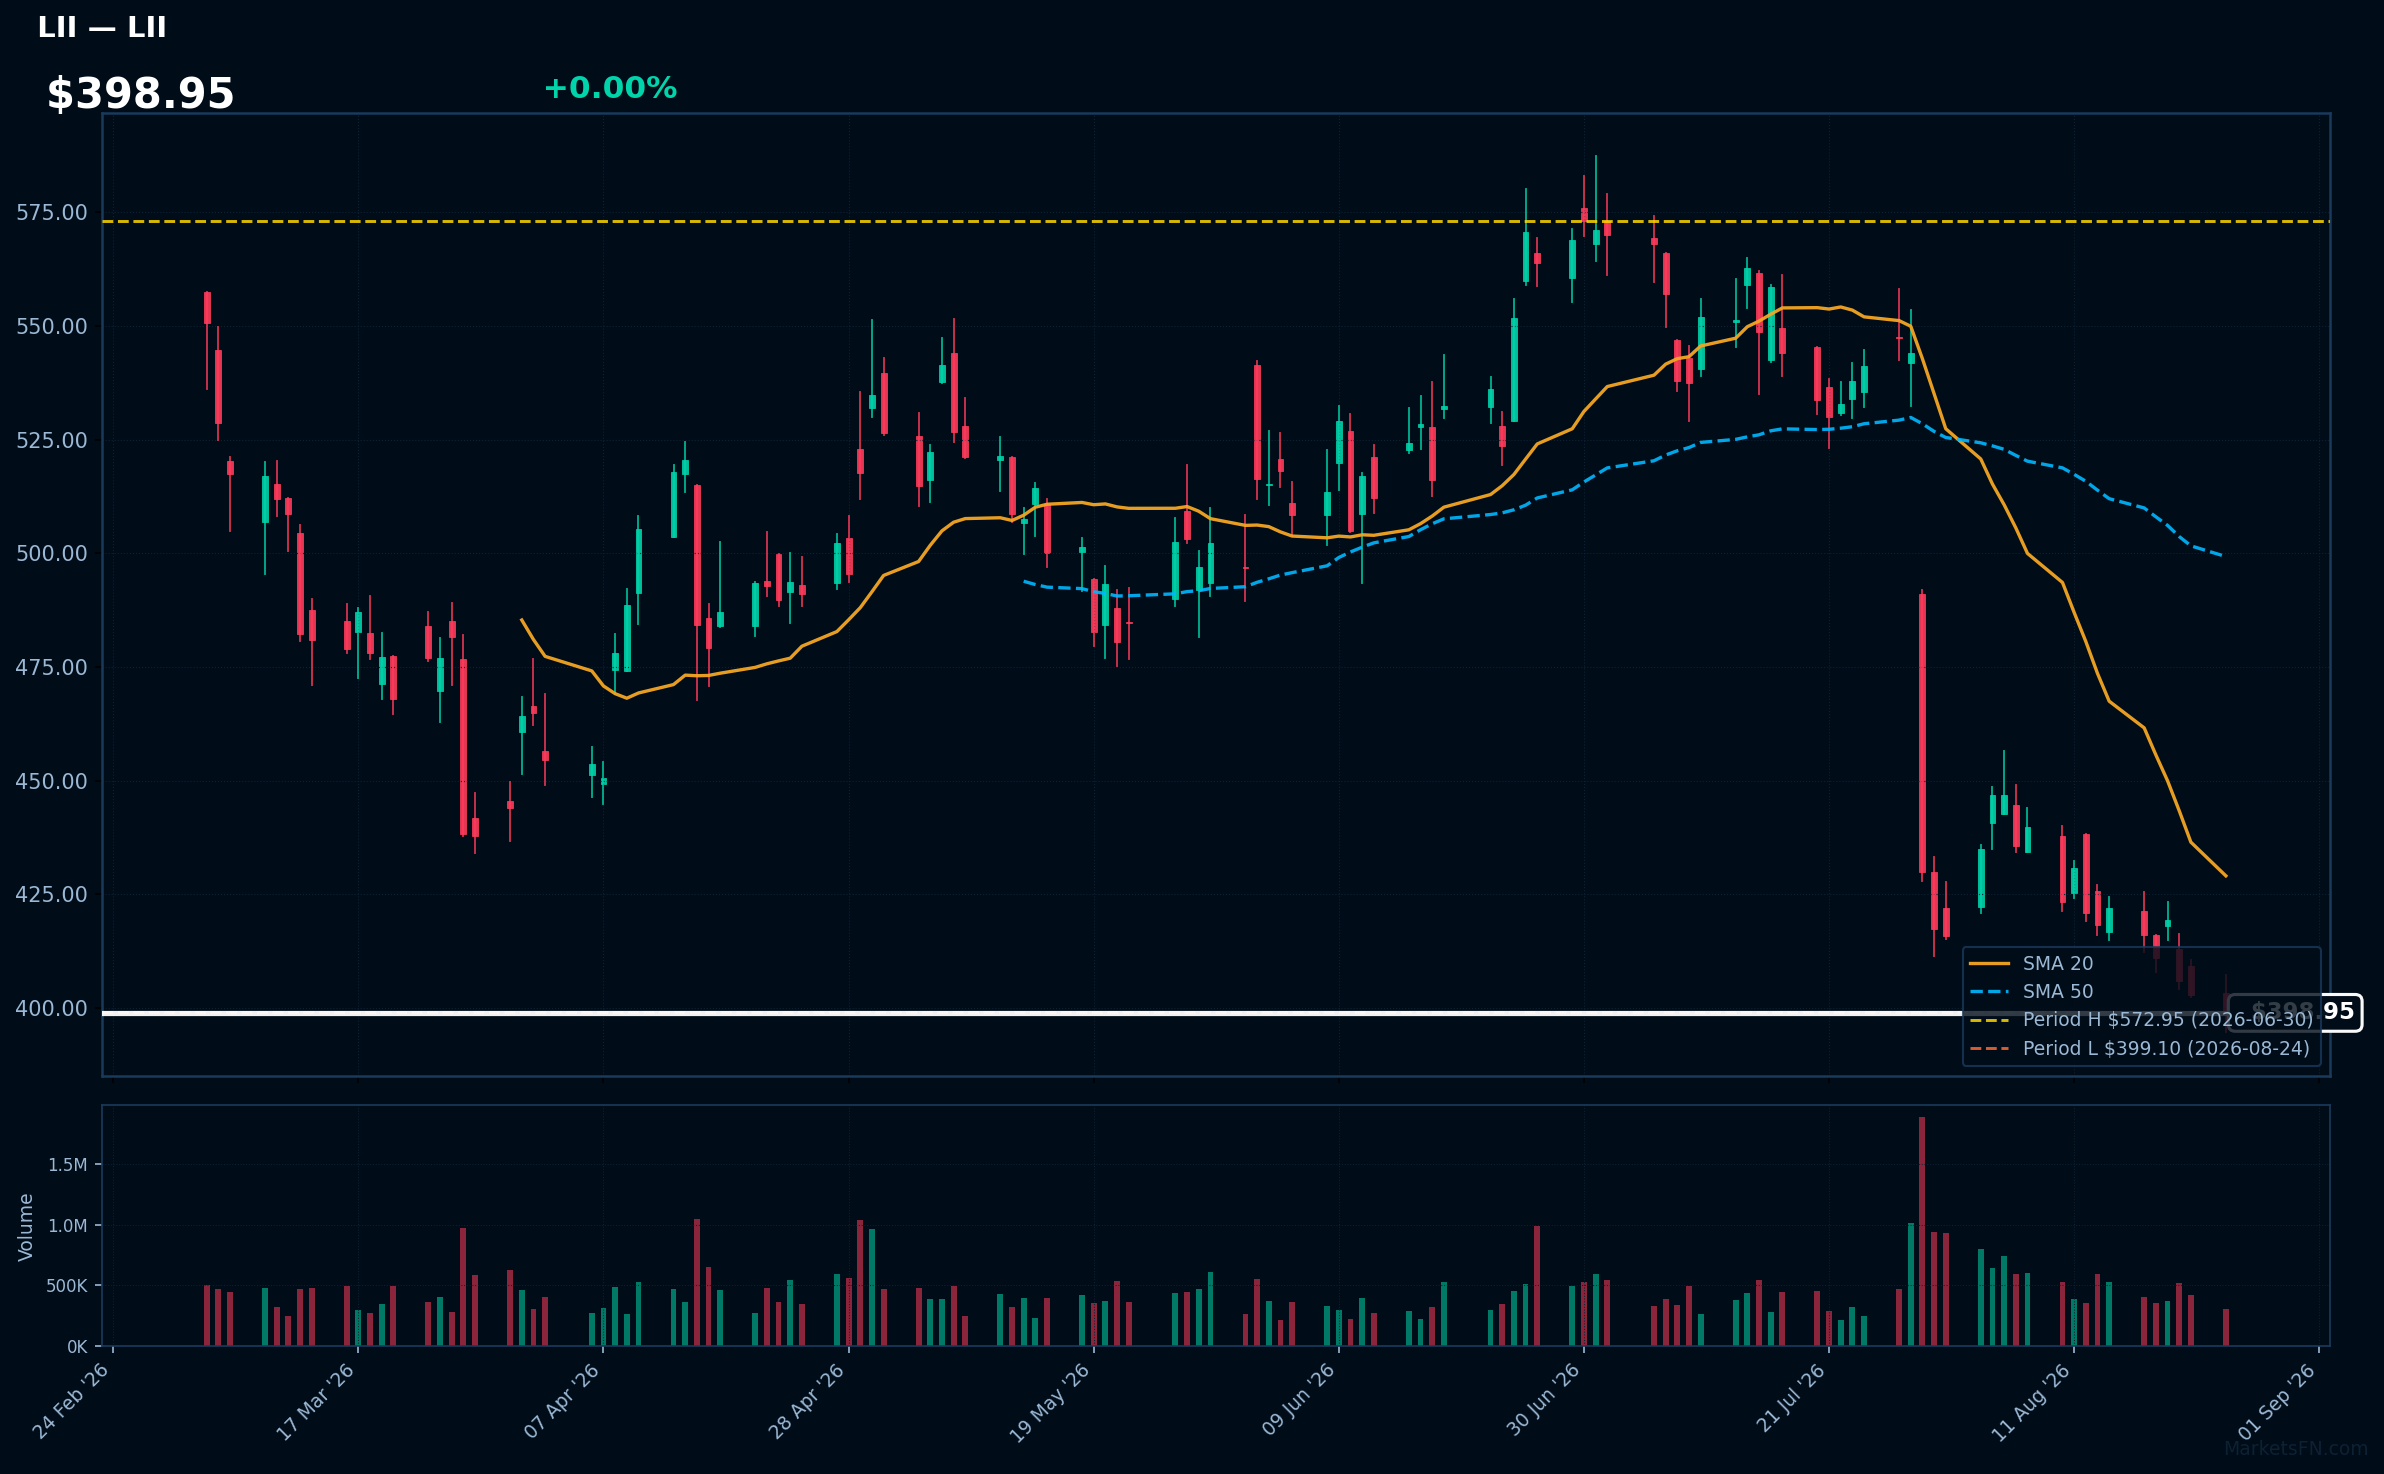
LII | Lennox International Inc | Industrials | Price Last: $399.10 | % Realized: -20.01% | RSI: 29.4 | % above MA200: -20.5% | Trend: Below MA20, MA50, MA200
Lennox International Inc designs and manufactures heating, ventilation, and air conditioning (HVAC) systems. Investors should care due to its significant role in the energy-efficient solutions market, which is increasingly vital as climate regulations tighten and demand for sustainable technologies grows.
The current technical situation indicates a warning sign, with an RSI(14) of 29.4 suggesting oversold conditions. The bearish MA alignment shows price < MA20 < MA50 < MA200, indicating a sustained downtrend.
Related headlines
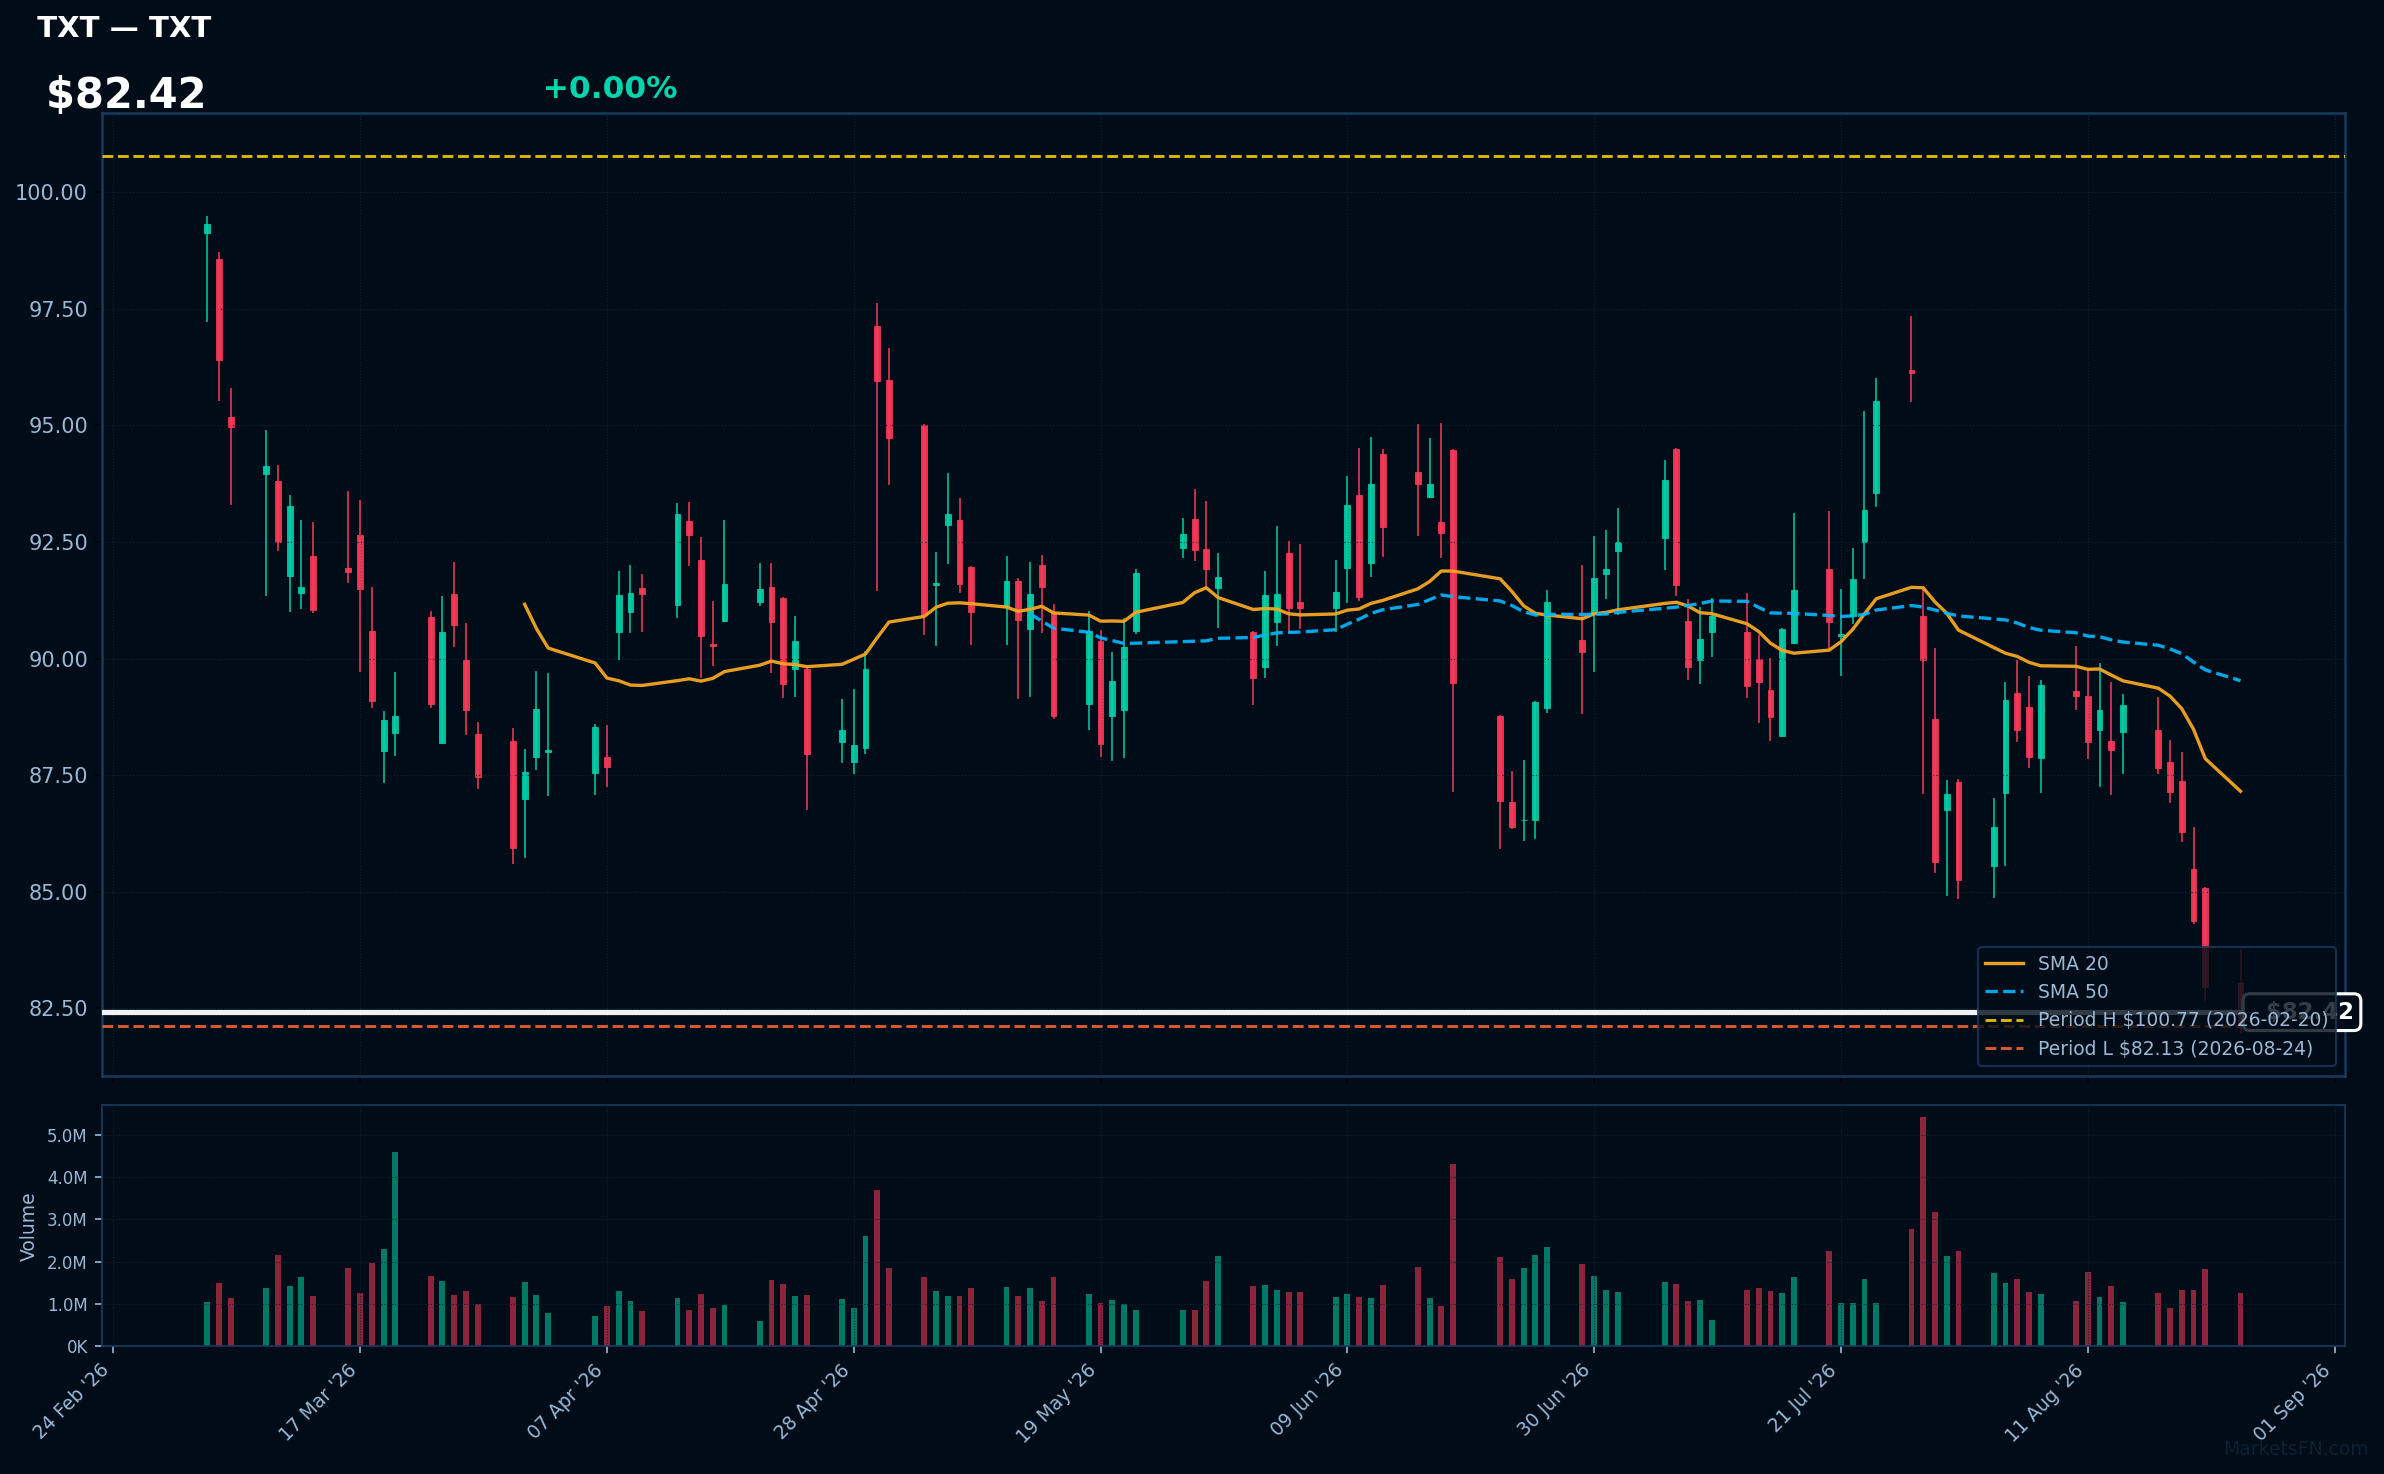
TXT | Textron Inc | Industrials | Price Last: $82.13 | % Realized: -5.65% | RSI: 34.0 | % above MA200: -8.8% | Trend: Below MA20, MA50, MA200
Textron Inc (TXT) is a multi-industry company known for its aircraft, defense, and industrial products. Investors should care due to its diverse portfolio, which positions it to capitalize on various market opportunities, particularly in aerospace and defense sectors.
Currently, Textron shows bearish momentum with an RSI(14) of 34.0 and a MA alignment indicating a sustained downtrend: price < MA20 < MA50 < MA200. The stock is testing major support, being only 0.0% above its 2026 YTD low.
Related headlines
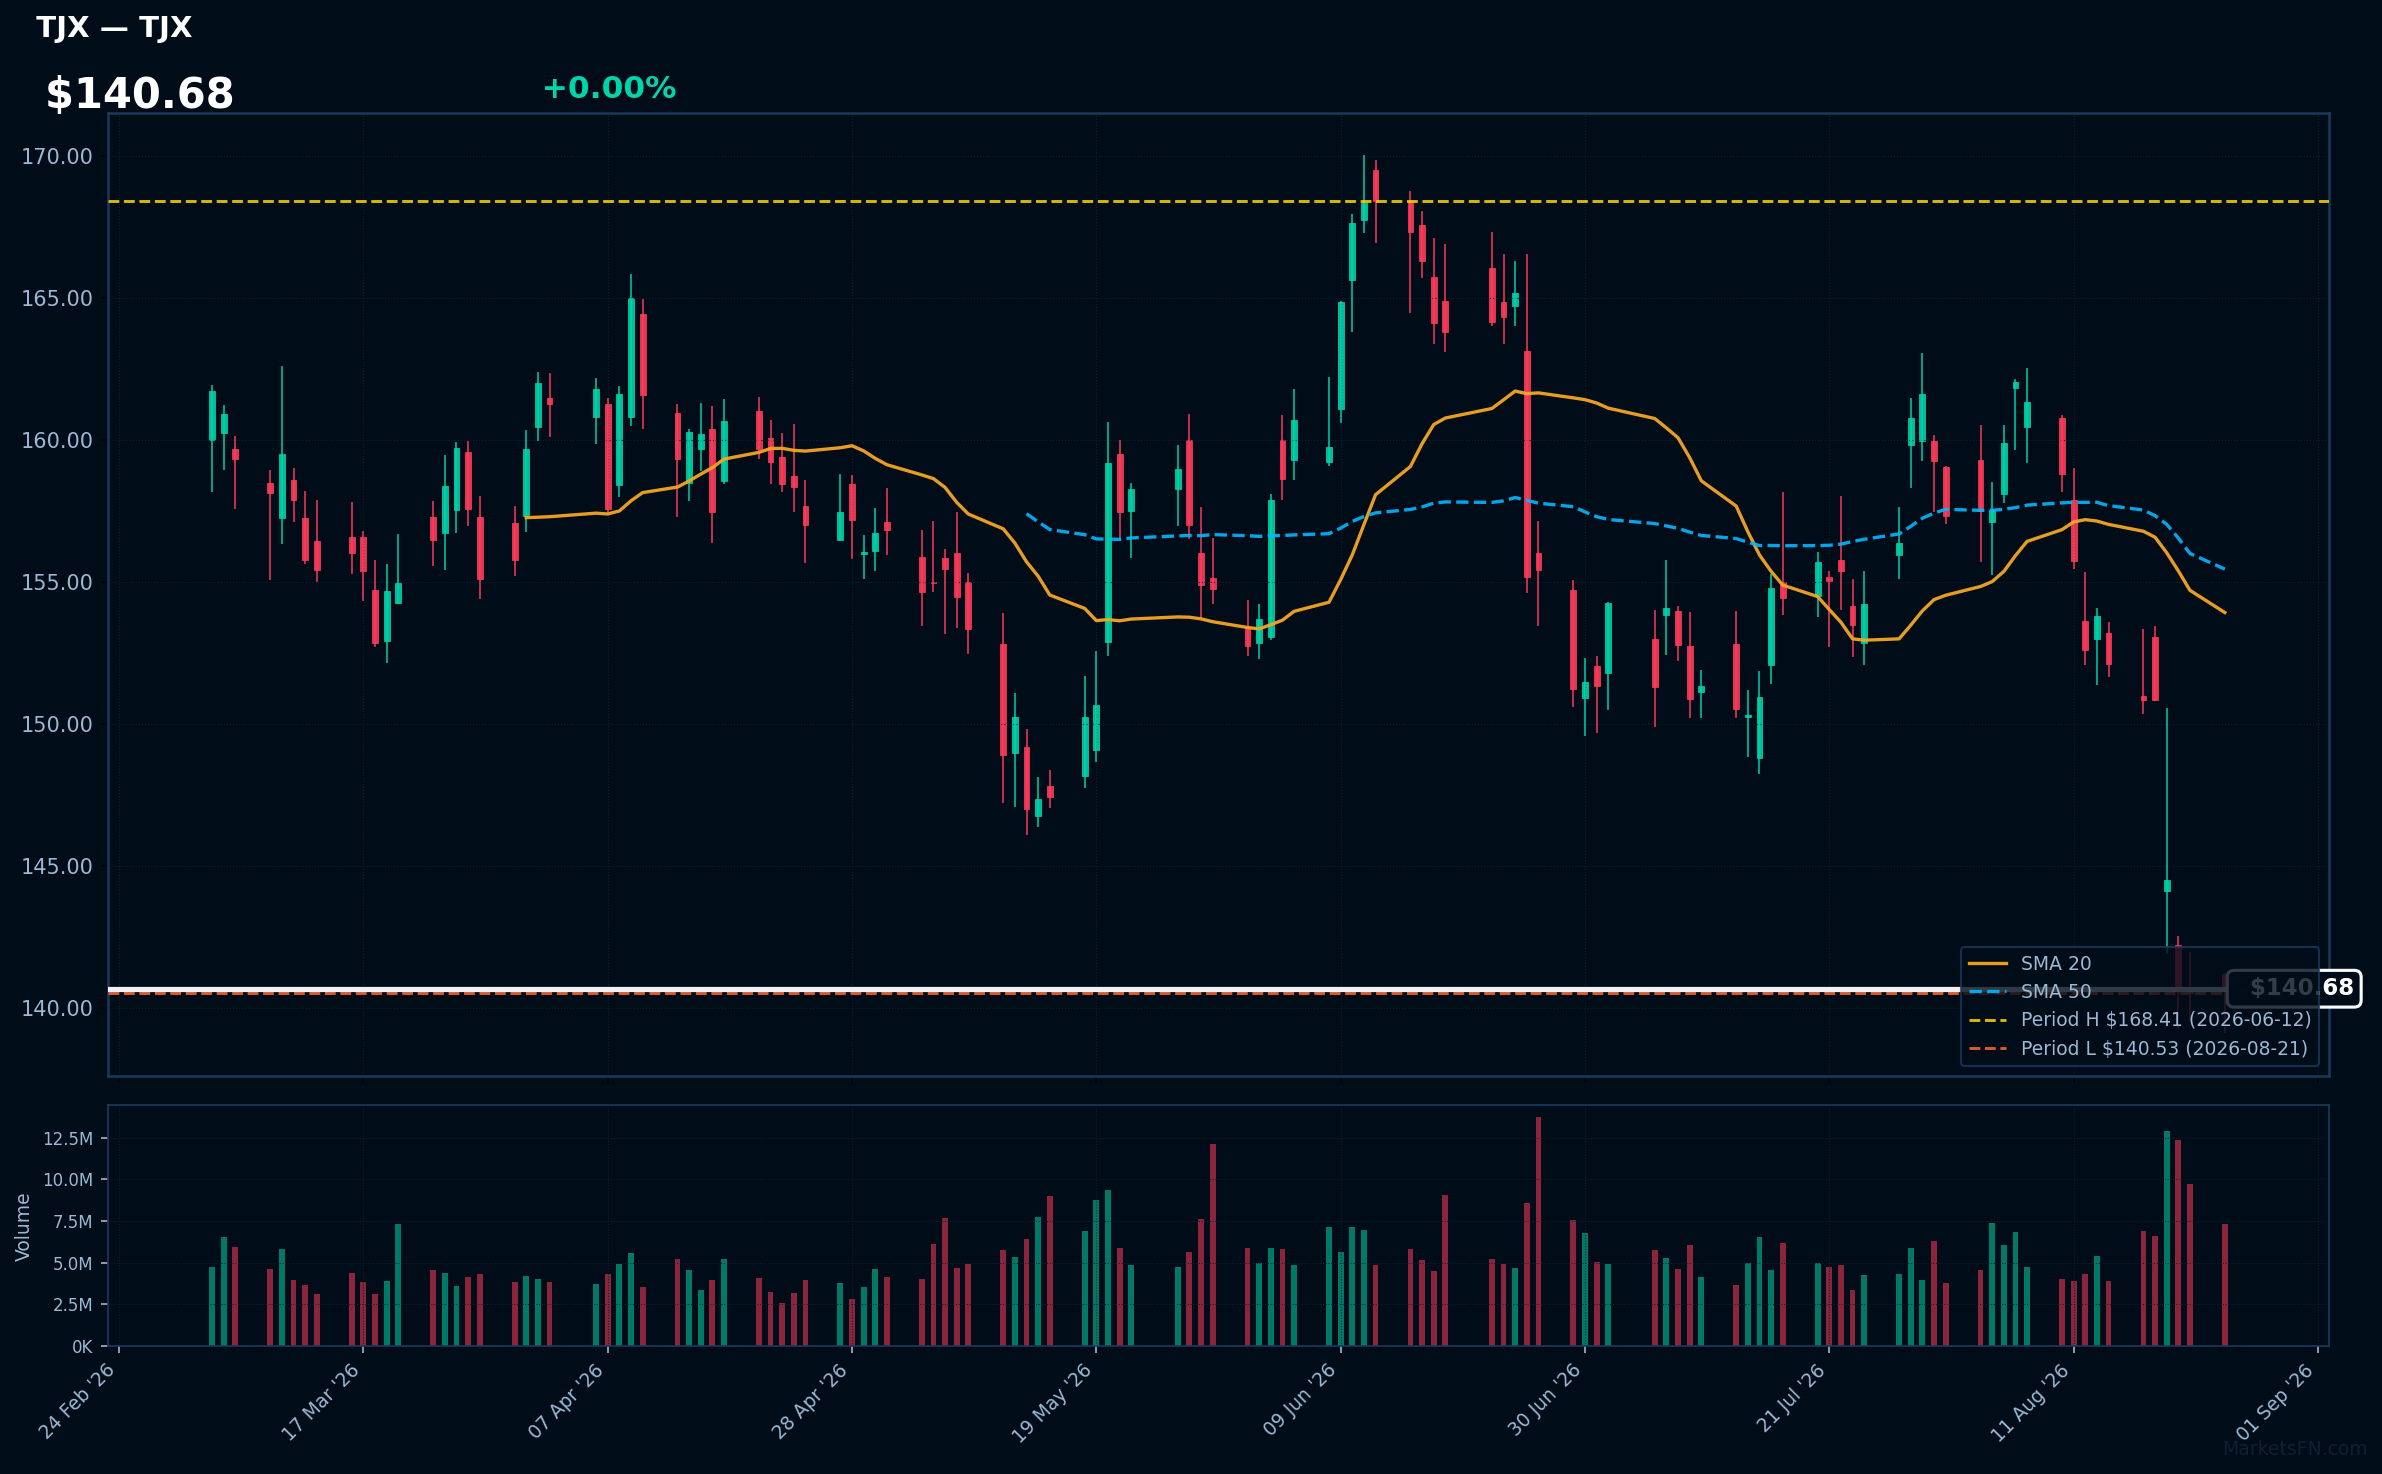
TJX | TJX Companies, Inc | Consumer Cyclical | Price Last: $140.71 | % Realized: -8.80% | RSI: 25.9 | % above MA200: -9.3% | Trend: Below MA20, MA50, MA200
TJX Companies, Inc operates off-price retail chains, including T.J. Maxx and Marshalls, offering brand-name apparel and home goods at discounted prices. Investors should care due to its resilience in economic downturns and ability to attract cost-conscious consumers.
The current technical situation indicates a bearish trend with an RSI(14) of 25.9 and a MA alignment of price < MA20 < MA50 < MA200, suggesting a sustained downtrend and testing major support just 0.1% above its 2026 YTD low.
Related headlines
Market Commentary
The proximity of certain S&P 500 stocks to their 2026 year-to-date extremes indicates a significant divergence in market performance. Stocks like Visa Inc, Mastercard Incorporated, Coca-Cola Co, Charles Schwab Corp, and AMGEN Inc are all at 0.0% from their highs, suggesting strong investor confidence and robust fundamentals. Conversely, companies such as L3Harris Technologies Inc, NRG Energy Inc, Lennox International Inc, Textron Inc, and TJX Companies, Inc are only slightly above their lows, reflecting potential challenges or market skepticism regarding their growth prospects.
This divergence can be attributed to sector-specific themes and broader market conditions. The high-performing stocks are likely benefiting from strong consumer demand, technological advancements, and favorable economic indicators. In contrast, the underperforming stocks may be facing headwinds such as regulatory challenges, supply chain issues, or shifts in consumer behavior that are impacting their earnings outlook.
Investors should closely monitor upcoming earnings reports and economic data releases, as these will provide insights into the sustainability of current trends. Additionally, shifts in interest rates and inflation could influence market sentiment, potentially impacting both high and low-performing stocks. Keeping an eye on sector rotation and investor sentiment will be crucial in navigating the evolving market landscape.
Methodology: All 503 S&P 500 constituents screened. Close prices downloaded from 2026-01-01. Period high = highest close since Jan 1 2026; period low = lowest close since Jan 1 2026. Distance = (current price / period extreme − 1) × 100. Technical indicators computed on up to 1 year of daily OHLCV data.
Disclaimer: For informational purposes only. Not investment advice. Past performance is not indicative of future results.