S&P 500 2026 YTD Highs & Lows Radar: Visa (V), Walmart (WMT) and more
MarketsFN Team

S&P 500 2026 YTD Highs & Lows Radar: Visa (V), Walmart (WMT) and more
Screening all 503 S&P 500 constituents for stocks nearest to their 2026 year-to-date high and their 2026 YTD low. Data as of August 24, 2026. % Realized = total return since Jan 1 2026.
Legend: RSI > 70 = overbought · RSI < 30 = oversold · Green % Realized = positive YTD return · Red = negative.
📈 Nearest to 2026 High
Sectors represented: Financial (3), Consumer Defensive (1), Healthcare (1)
| Ticker | Company | Sector | Price Last | % Realized | 2026 YTD High Date | RSI | % above MA200 | Trend |
|---|---|---|---|---|---|---|---|---|
| V | Visa Inc | Financial | $371.04 | +7.09% | 2026-08-21 | 65.7 | +11.7% | Above MA20, MA50, MA200 |
| MA | Mastercard Incorporated | Financial | $580.63 | +3.11% | 2026-08-21 | 70.5 | +9.8% | Above MA20, MA50, MA200 |
| KO | Coca-Cola Co | Consumer Defensive | $91.10 | +31.80% | 2026-08-21 | 72.5 | +17.4% | Above MA20, MA50, MA200 |
| MRK | Merck & Co Inc | Healthcare | $152.55 | +43.31% | 2026-08-21 | 72.2 | +31.9% | Above MA20, MA50, MA200 |
| SCHW | Charles Schwab Corp | Financial | $112.30 | +10.56% | 2026-08-21 | 71.5 | +16.0% | Above MA20, MA50, MA200 |
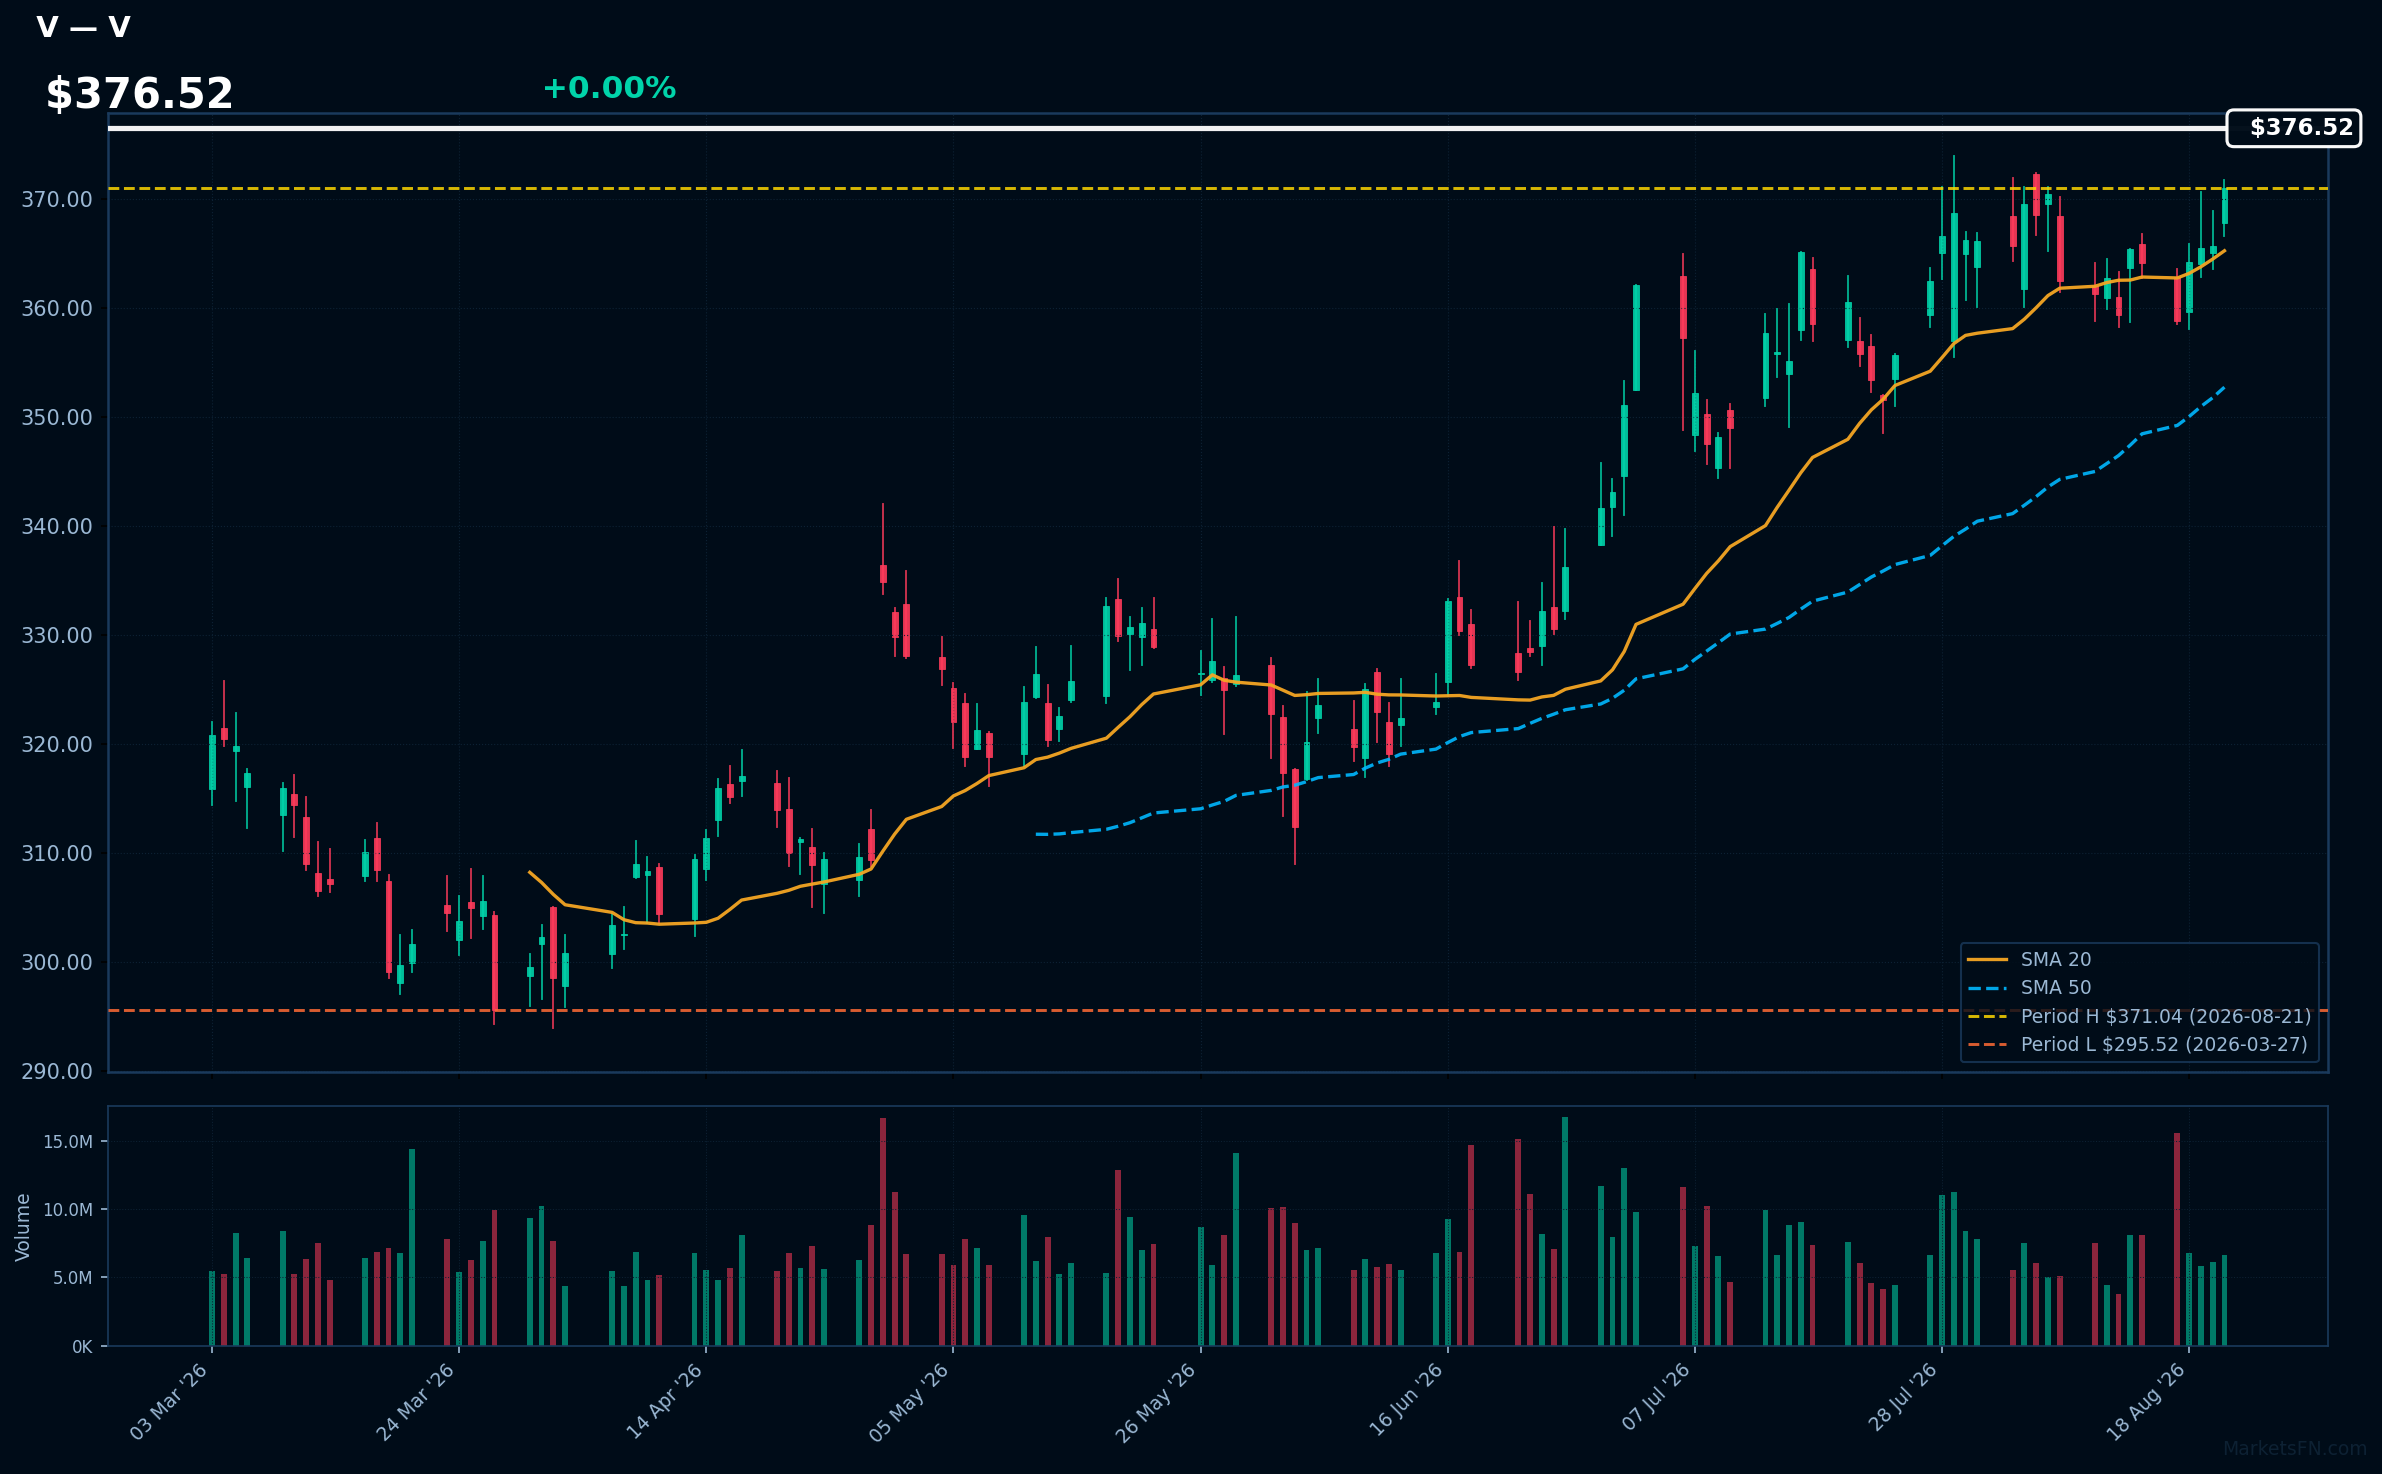
V | Visa Inc | Financial | Price Last: $371.04 | % Realized: +7.09% | RSI: 65.7 | % above MA200: +11.7% | Trend: Above MA20, MA50, MA200
Visa Inc operates a global payments technology network, facilitating electronic funds transfers and enabling secure transactions for consumers and businesses. Investors should care due to its dominant market position and consistent revenue growth, which are critical in the evolving digital payment landscape.
Currently, Visa shows bullish momentum with an RSI(14) of 65.7 and a strong MA alignment: price > MA20 > MA50 > MA200. The stock is also 0.0% below its 2026 YTD high, indicating potential for a breakout.
Related headlines
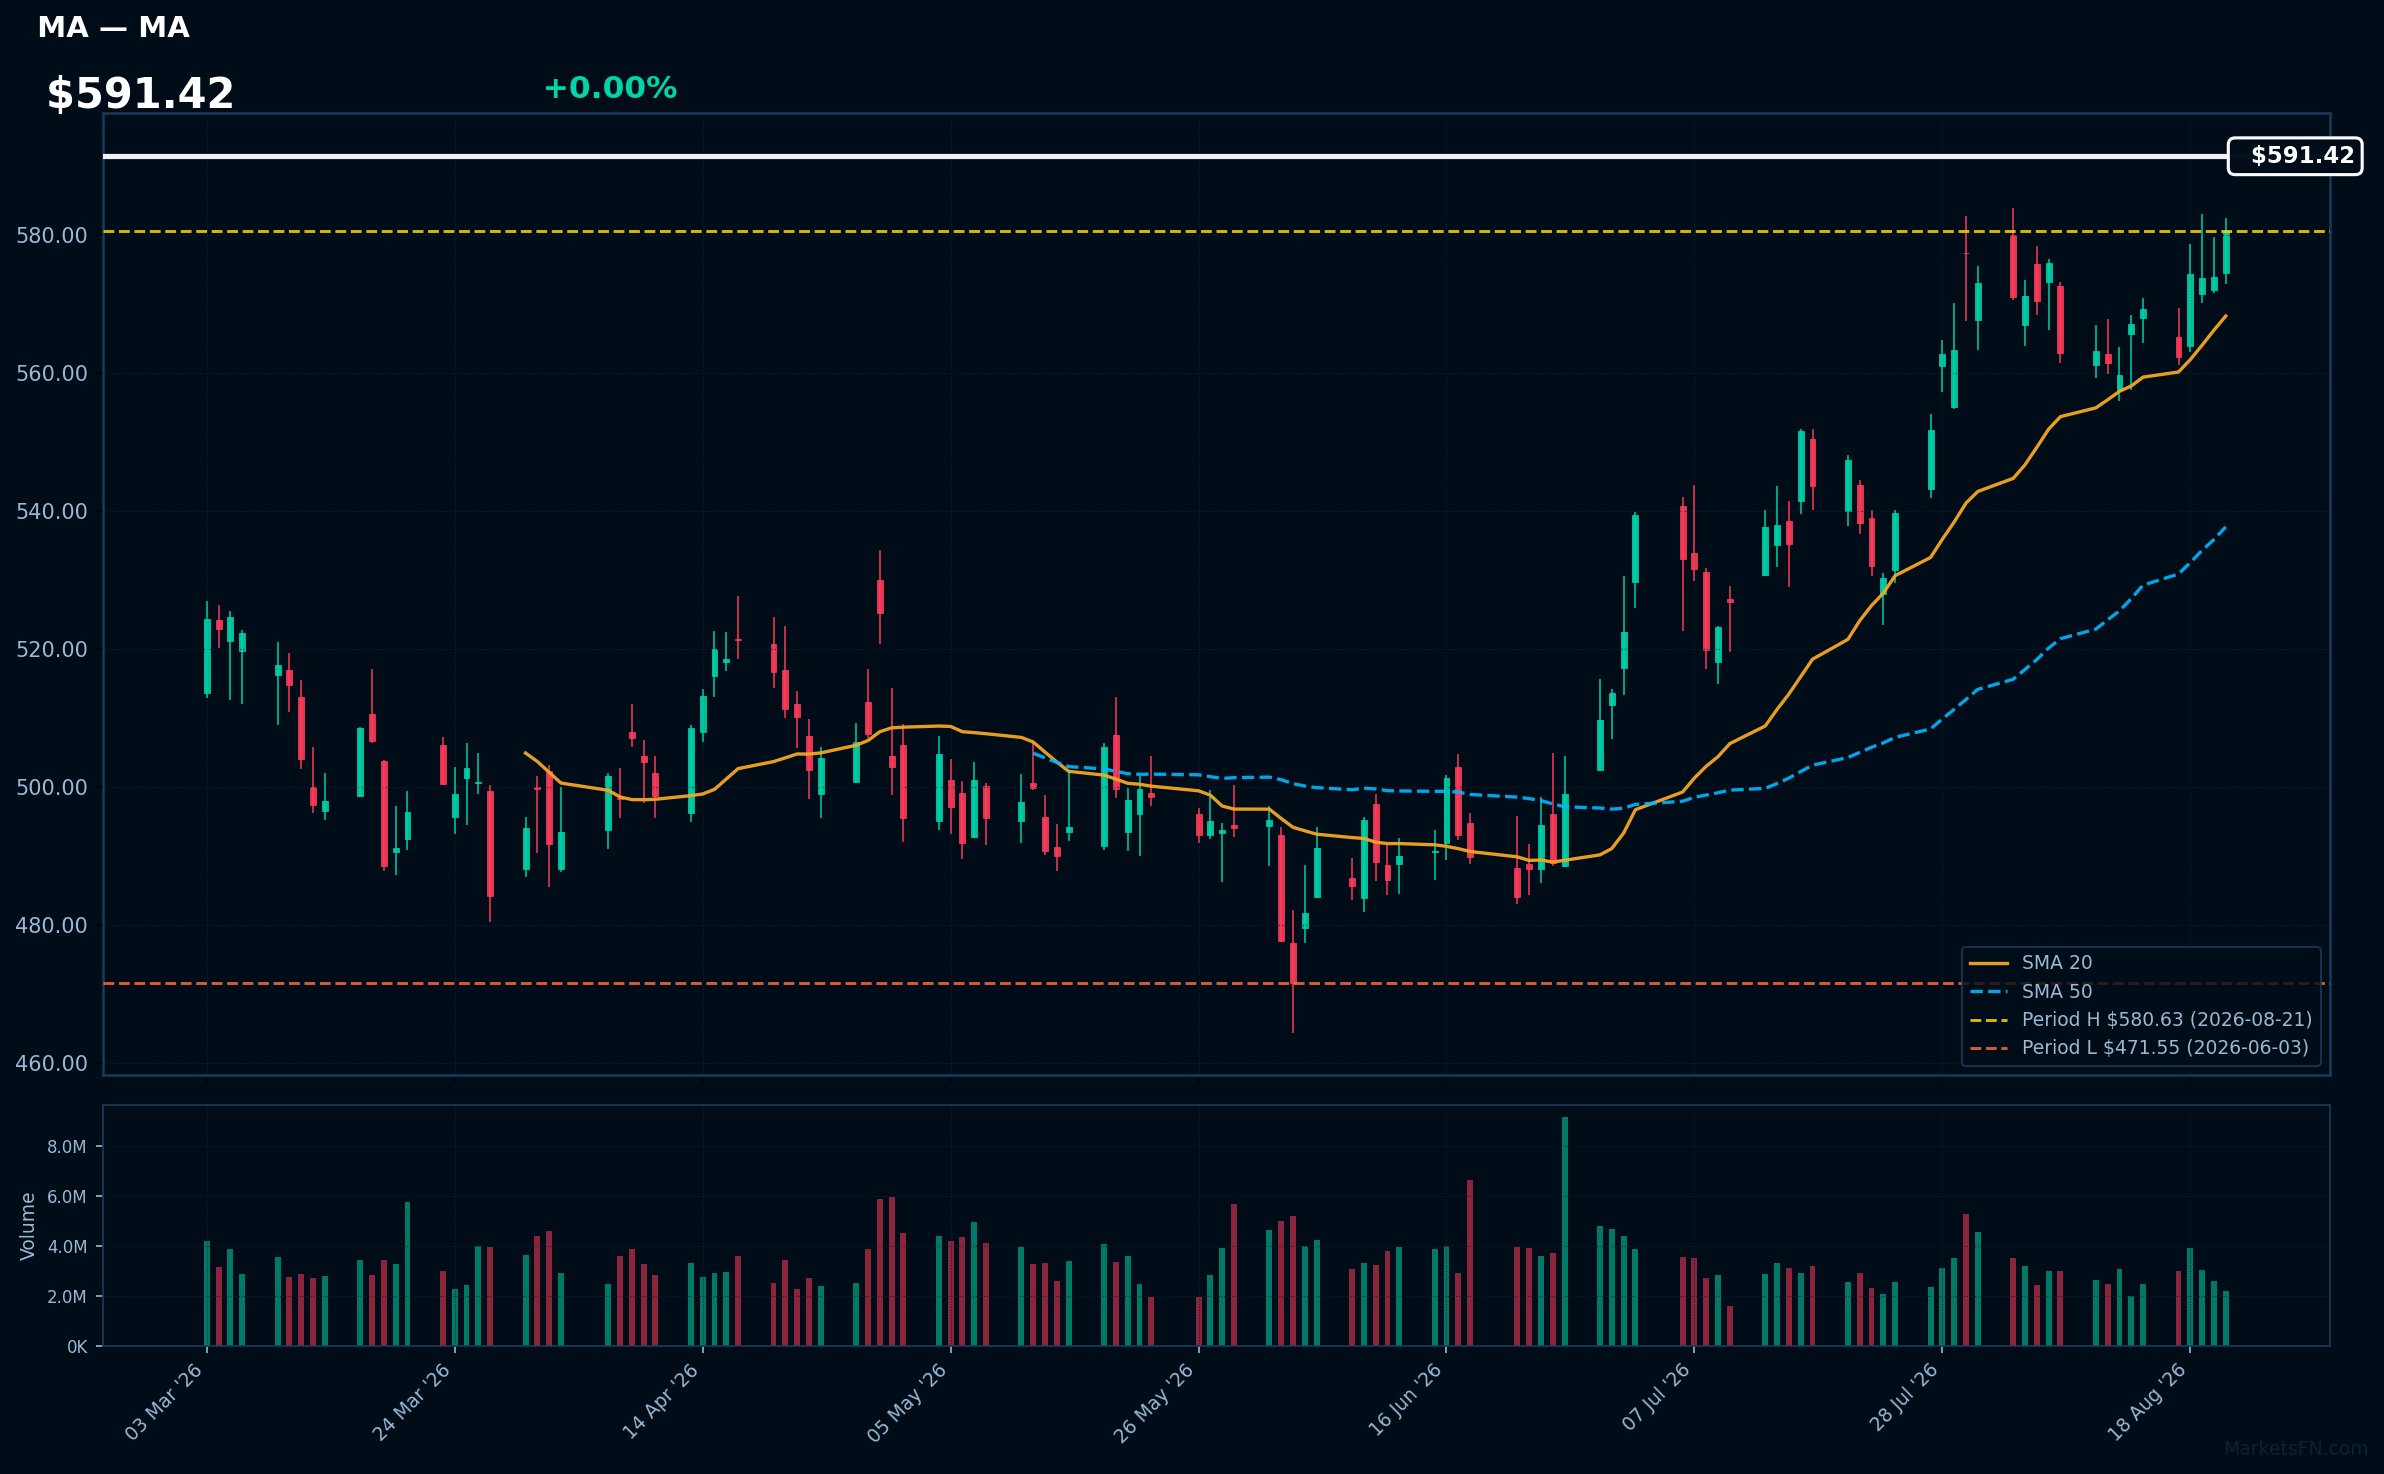
MA | Mastercard Incorporated | Financial | Price Last: $580.63 | % Realized: +3.11% | RSI: 70.5 | % above MA200: +9.8% | Trend: Above MA20, MA50, MA200
Mastercard Incorporated (MA) is a global payments technology company facilitating electronic funds transfers. Investors should care due to its critical role in the growing digital payment ecosystem, which is increasingly vital for consumer spending and e-commerce growth.
Currently, MA shows bullish momentum with an RSI(14) of 70.5 and a strong MA alignment: price > MA20 > MA50 > MA200. The stock is 0.0% below its 2026 YTD high, indicating potential for a breakout.
Related headlines
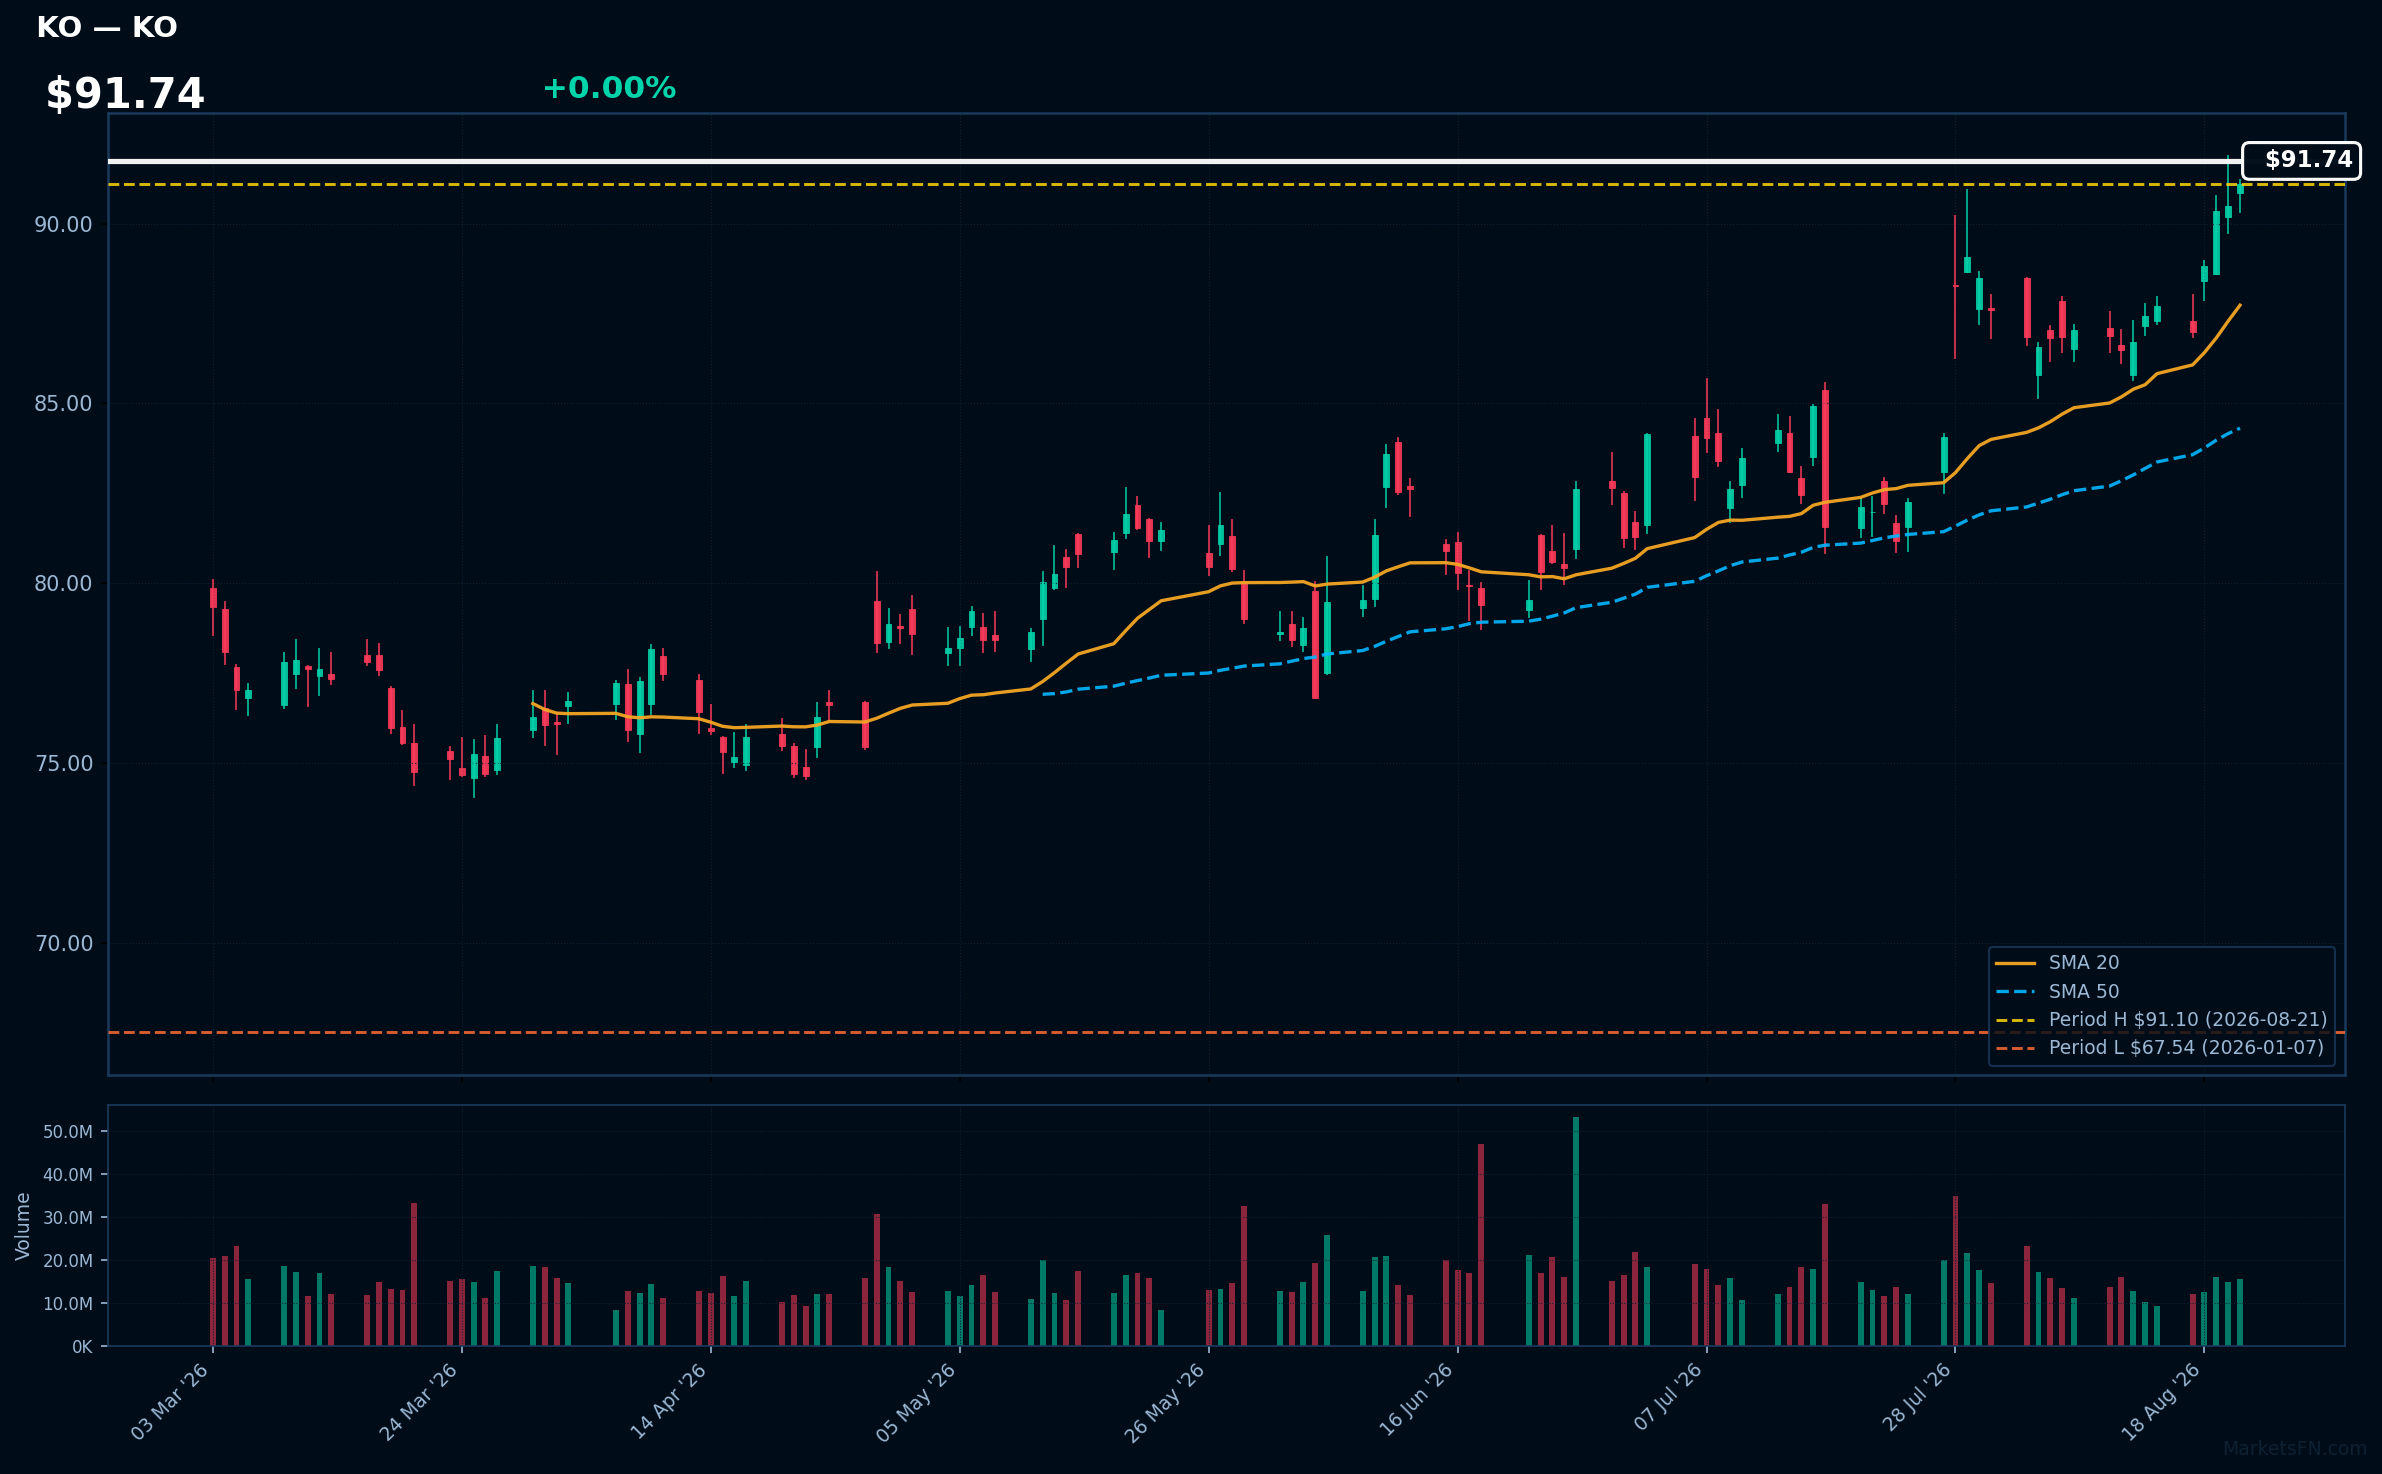
KO | Coca-Cola Co | Consumer Defensive | Price Last: $91.10 | % Realized: +31.80% | RSI: 72.5 | % above MA200: +17.4% | Trend: Above MA20, MA50, MA200
Coca-Cola Co (KO) is a leading beverage company, known for its extensive portfolio of non-alcoholic drinks, including soft drinks, juices, and water. Investors should care due to its strong brand equity and consistent demand, which drive revenue stability and growth potential.
The current technical situation indicates bullish momentum, with an RSI(14) of 72.5 and a bullish MA alignment: price > MA20 > MA50 > MA200. The stock is 0.0% below its 2026 YTD high, suggesting a potential breakout.
Related headlines
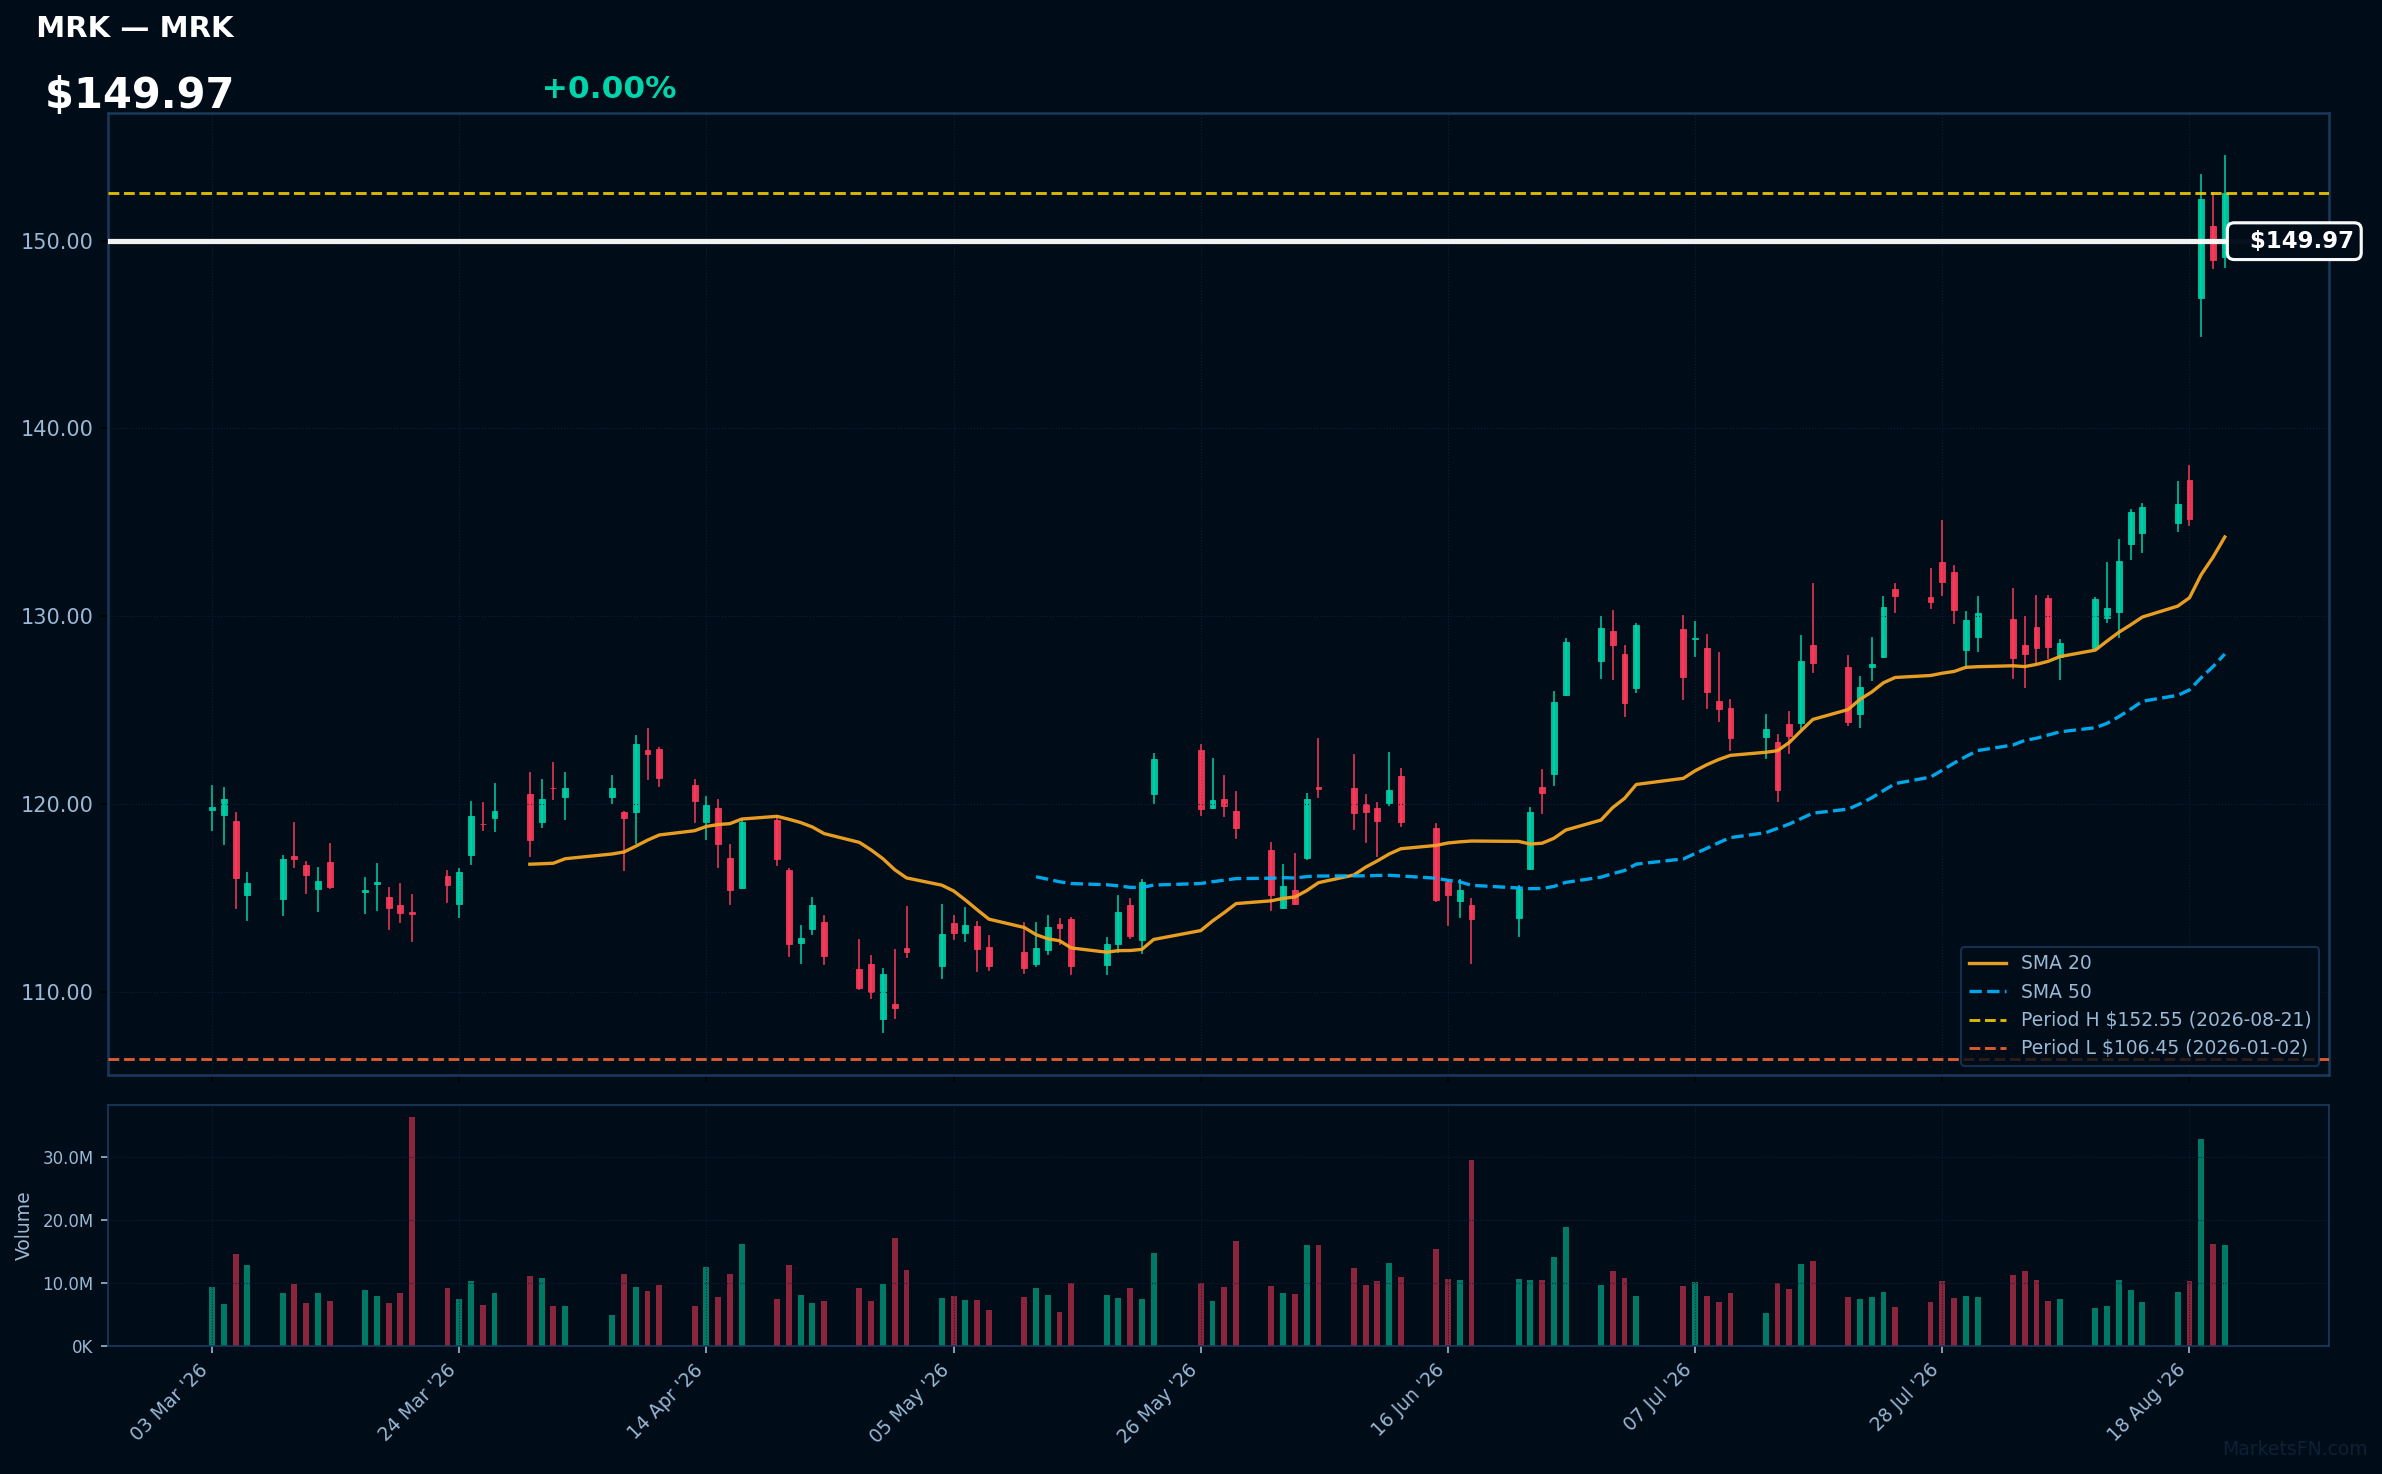
MRK | Merck & Co Inc | Healthcare | Price Last: $152.55 | % Realized: +43.31% | RSI: 72.2 | % above MA200: +31.9% | Trend: Above MA20, MA50, MA200
Merck & Co Inc develops innovative pharmaceuticals and vaccines, focusing on oncology, infectious diseases, and immunology. Investors should care due to its strong pipeline and market position, which can drive growth and profitability in a competitive healthcare landscape.
The current technical situation shows bullish momentum with an RSI(14) of 72.2 and a strong MA alignment: price > MA20 > MA50 > MA200. The stock is 0.0% below its 2026 YTD high, indicating a potential breakout.
Related headlines
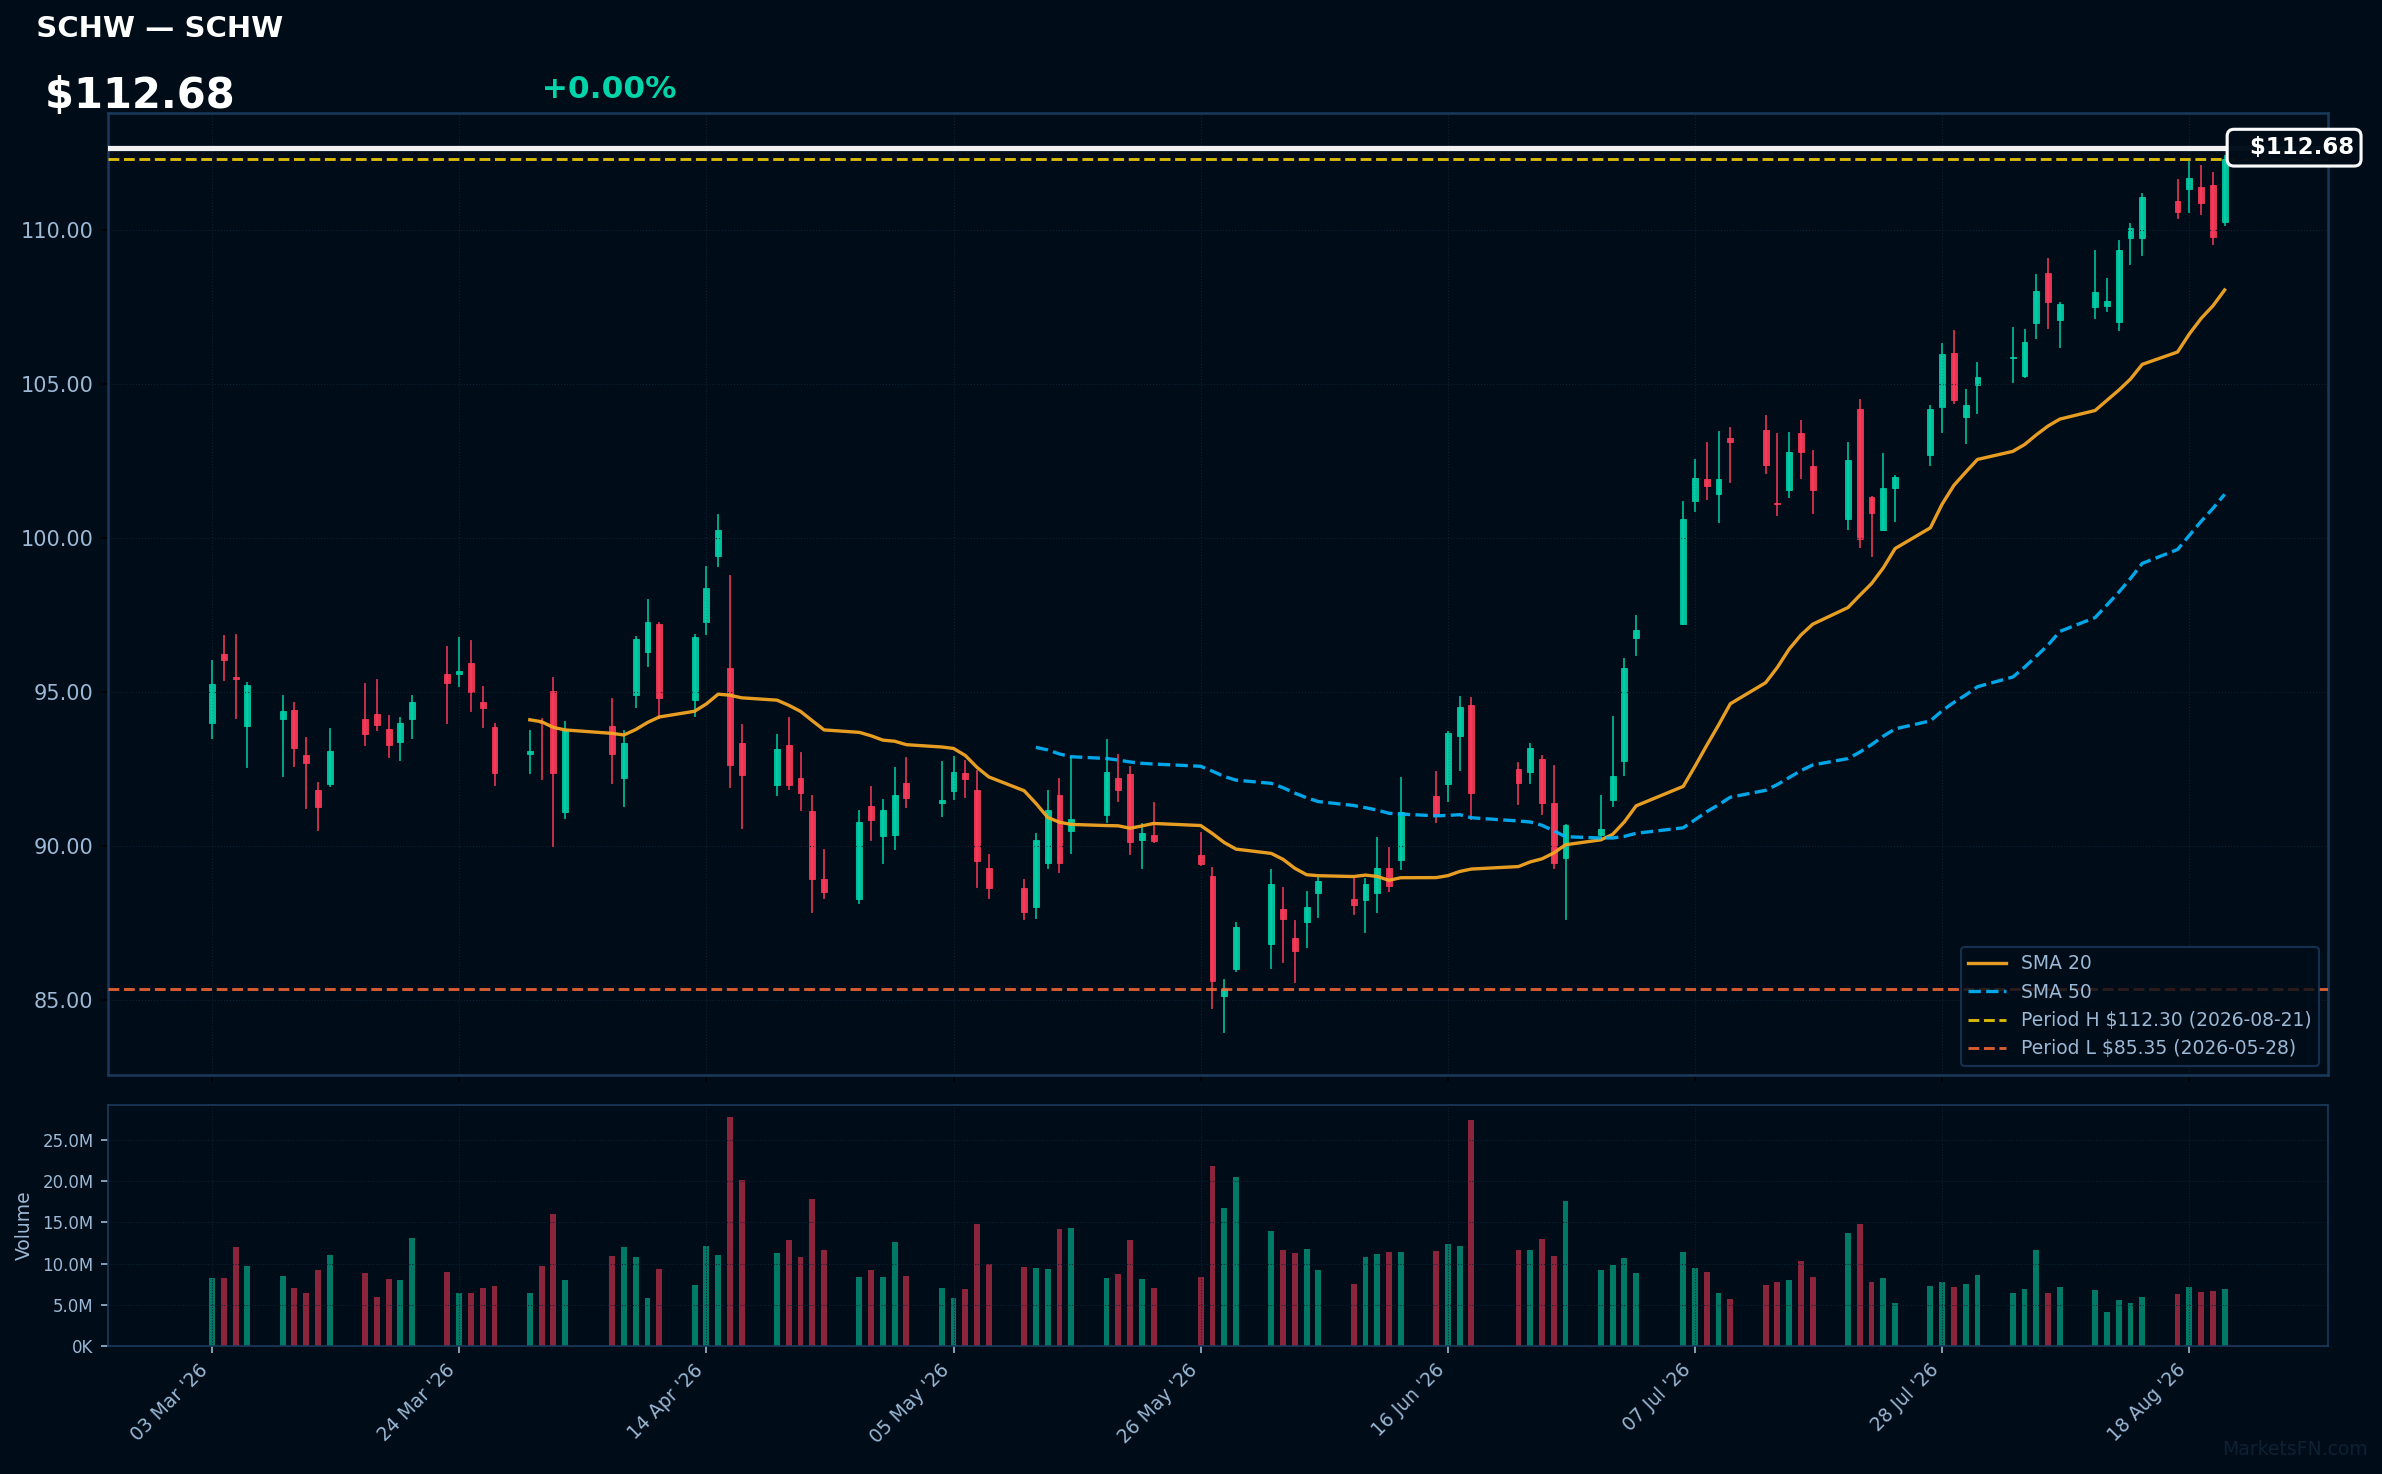
SCHW | Charles Schwab Corp | Financial | Price Last: $112.30 | % Realized: +10.56% | RSI: 71.5 | % above MA200: +16.0% | Trend: Above MA20, MA50, MA200
Charles Schwab Corp provides brokerage and banking services, focusing on investment management and financial planning. Investors should care due to its strong market position and innovative technology, which enhance customer experience and drive growth in a competitive financial services landscape.
The current technical situation indicates bullish momentum, with an RSI(14) of 71.5 and a bullish MA alignment: price > MA20 > MA50 > MA200. The stock is 0.0% below its 2026 YTD high, suggesting a potential breakout.
Related headlines
📉 Nearest to 2026 Low
Sectors represented: Utilities (2), Consumer Defensive (1), Consumer Cyclical (1), Industrials (1)
| Ticker | Company | Sector | Price Last | % Realized | 2026 YTD Low Date | RSI | % above MA200 | Trend |
|---|---|---|---|---|---|---|---|---|
| WMT | Walmart Inc | Consumer Defensive | $103.70 | -8.03% | 2026-08-21 | 34.3 | -12.5% | Below MA20, MA50, MA200 |
| TJX | TJX Companies, Inc | Consumer Cyclical | $140.53 | -8.91% | 2026-08-21 | 24.9 | -9.5% | Below MA20, MA50, MA200 |
| SRE | Sempra | Utilities | $82.89 | -7.60% | 2026-08-21 | 35.7 | -9.3% | Below MA20, MA50, MA200 |
| LHX | L3Harris Technologies Inc | Industrials | $266.73 | -12.40% | 2026-08-21 | 33.4 | -15.4% | Below MA20, MA50, MA200 |
| PEG | Public Service Enterprise Group Inc | Utilities | $72.61 | -10.35% | 2026-08-21 | 28.9 | -9.6% | Below MA20, MA50, MA200 |
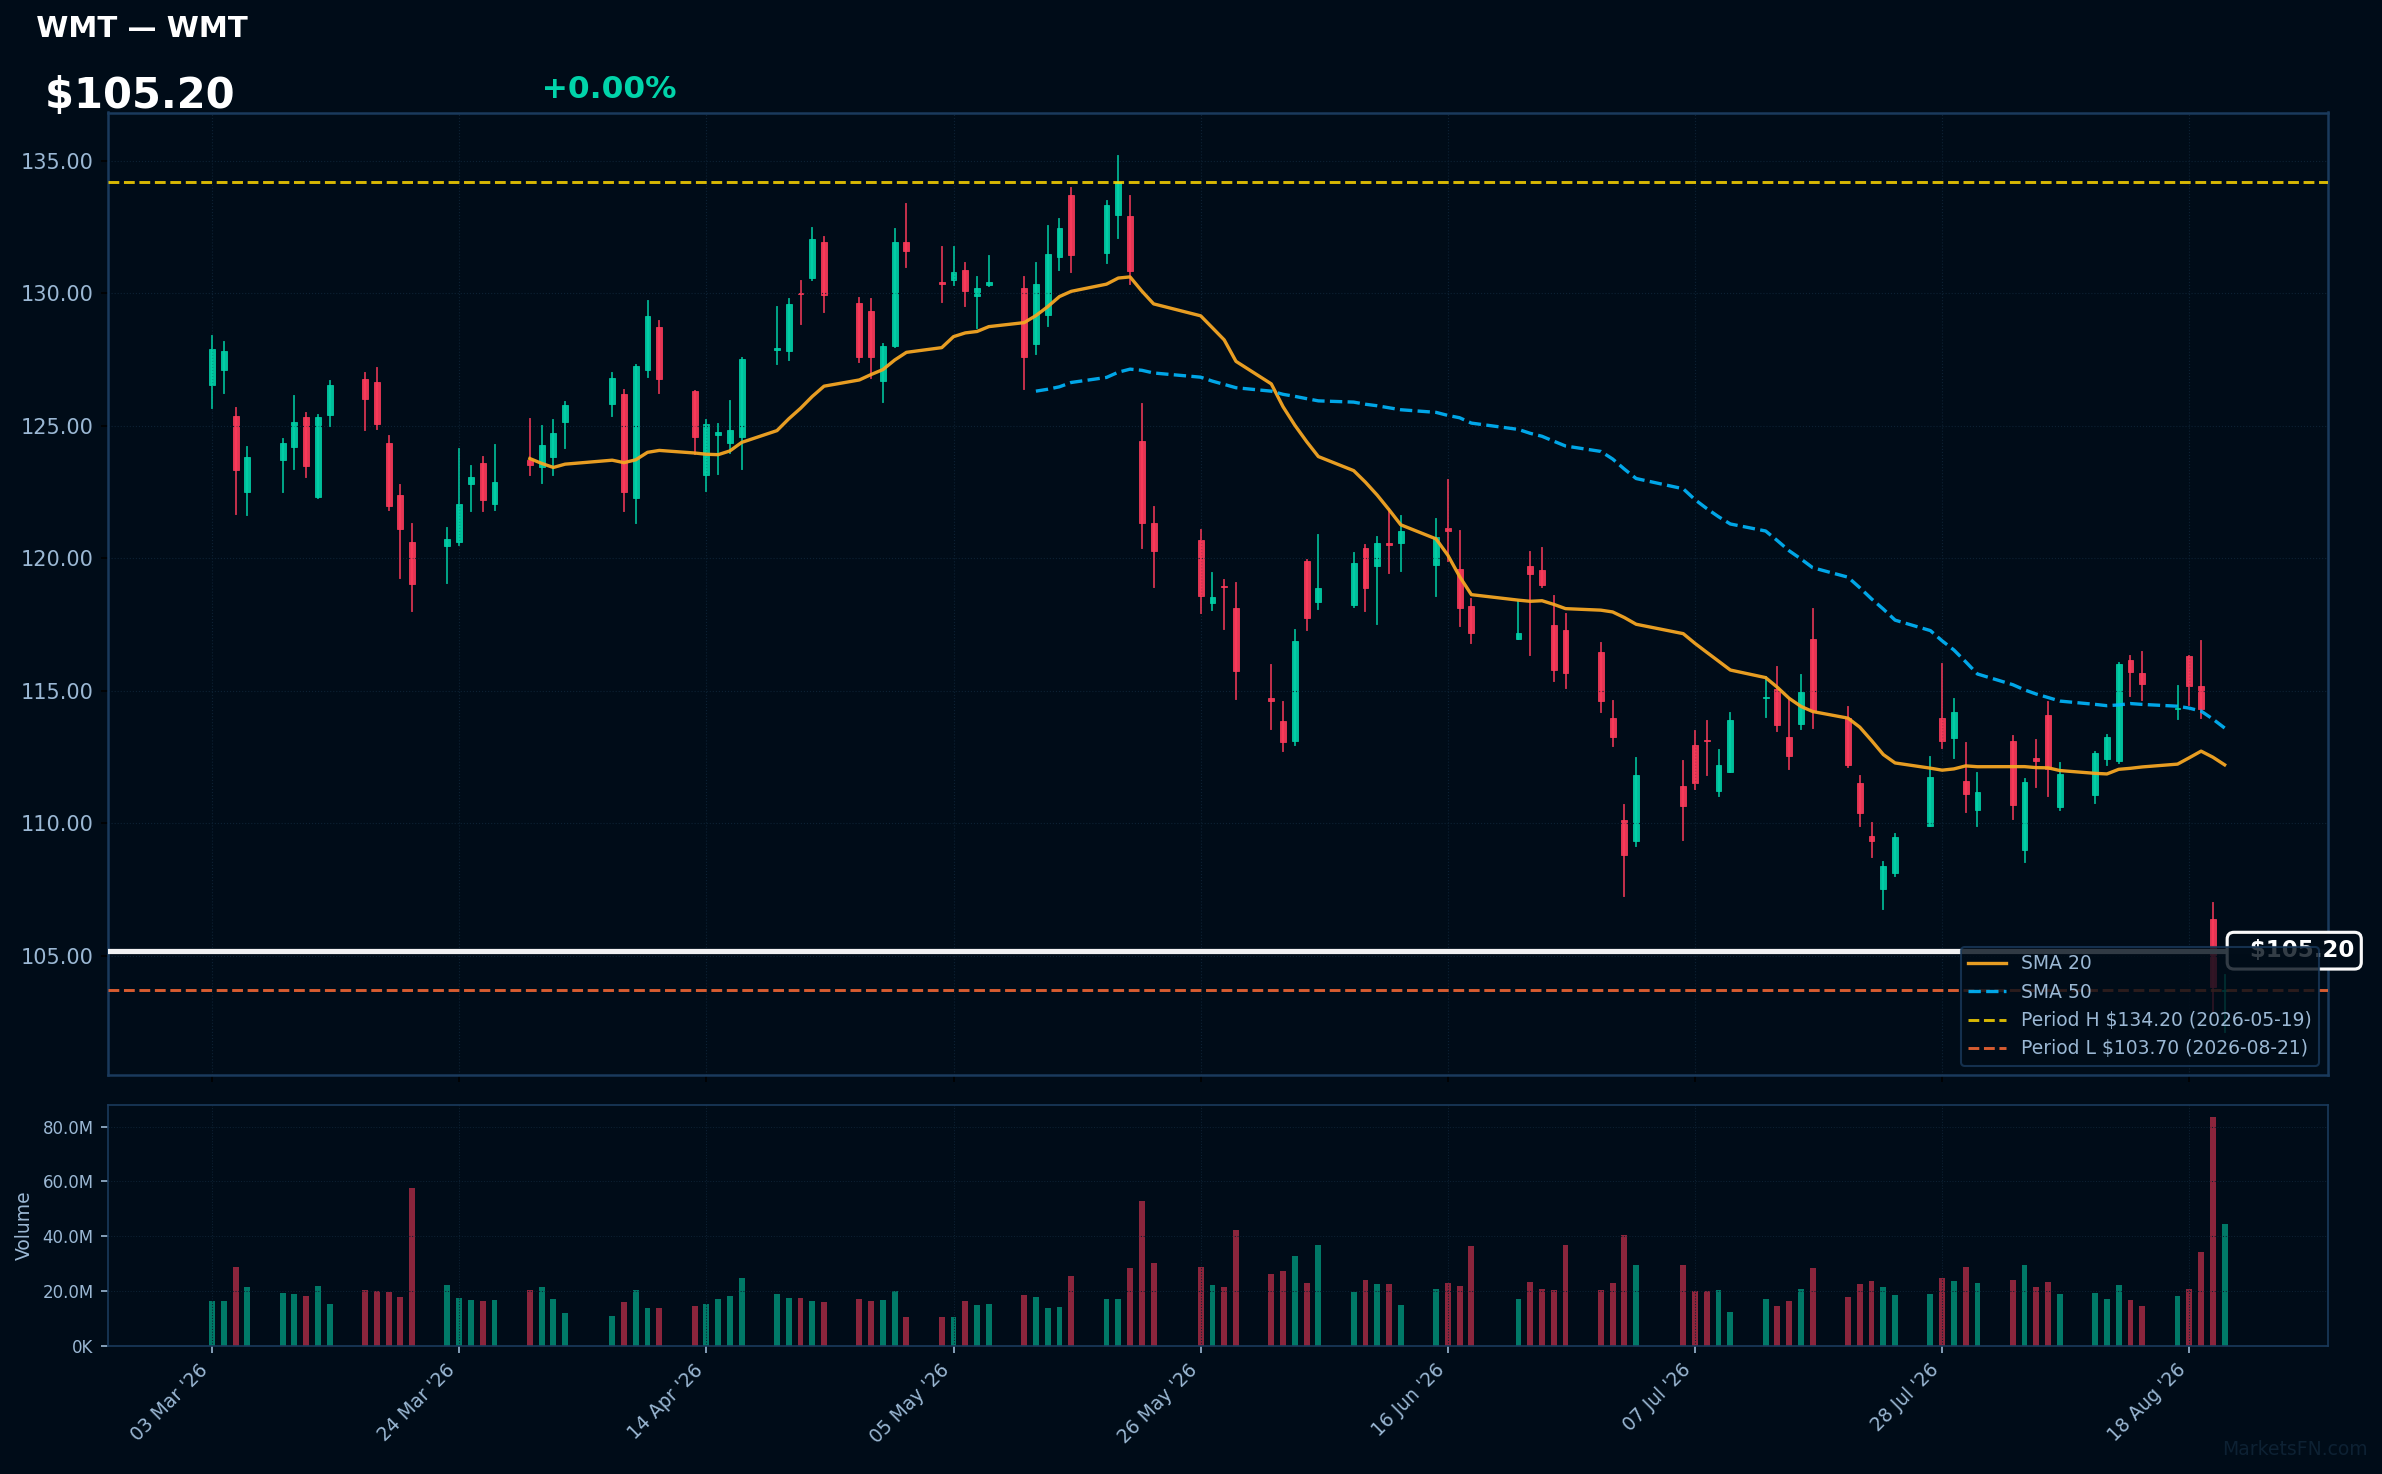
WMT | Walmart Inc | Consumer Defensive | Price Last: $103.70 | % Realized: -8.03% | RSI: 34.3 | % above MA200: -12.5% | Trend: Below MA20, MA50, MA200
Walmart Inc operates as a multinational retail corporation, offering a wide range of products including groceries, electronics, and clothing. Investors should care due to its significant market presence and ability to adapt to consumer trends, impacting revenue and growth potential.
The current technical situation indicates a bearish trend with an RSI(14) of 34.3 and a MA alignment of price < MA20 < MA50 < MA200, suggesting sustained downtrend and testing major support, as the stock is only 0.0% above its 2026 YTD low.
Related headlines
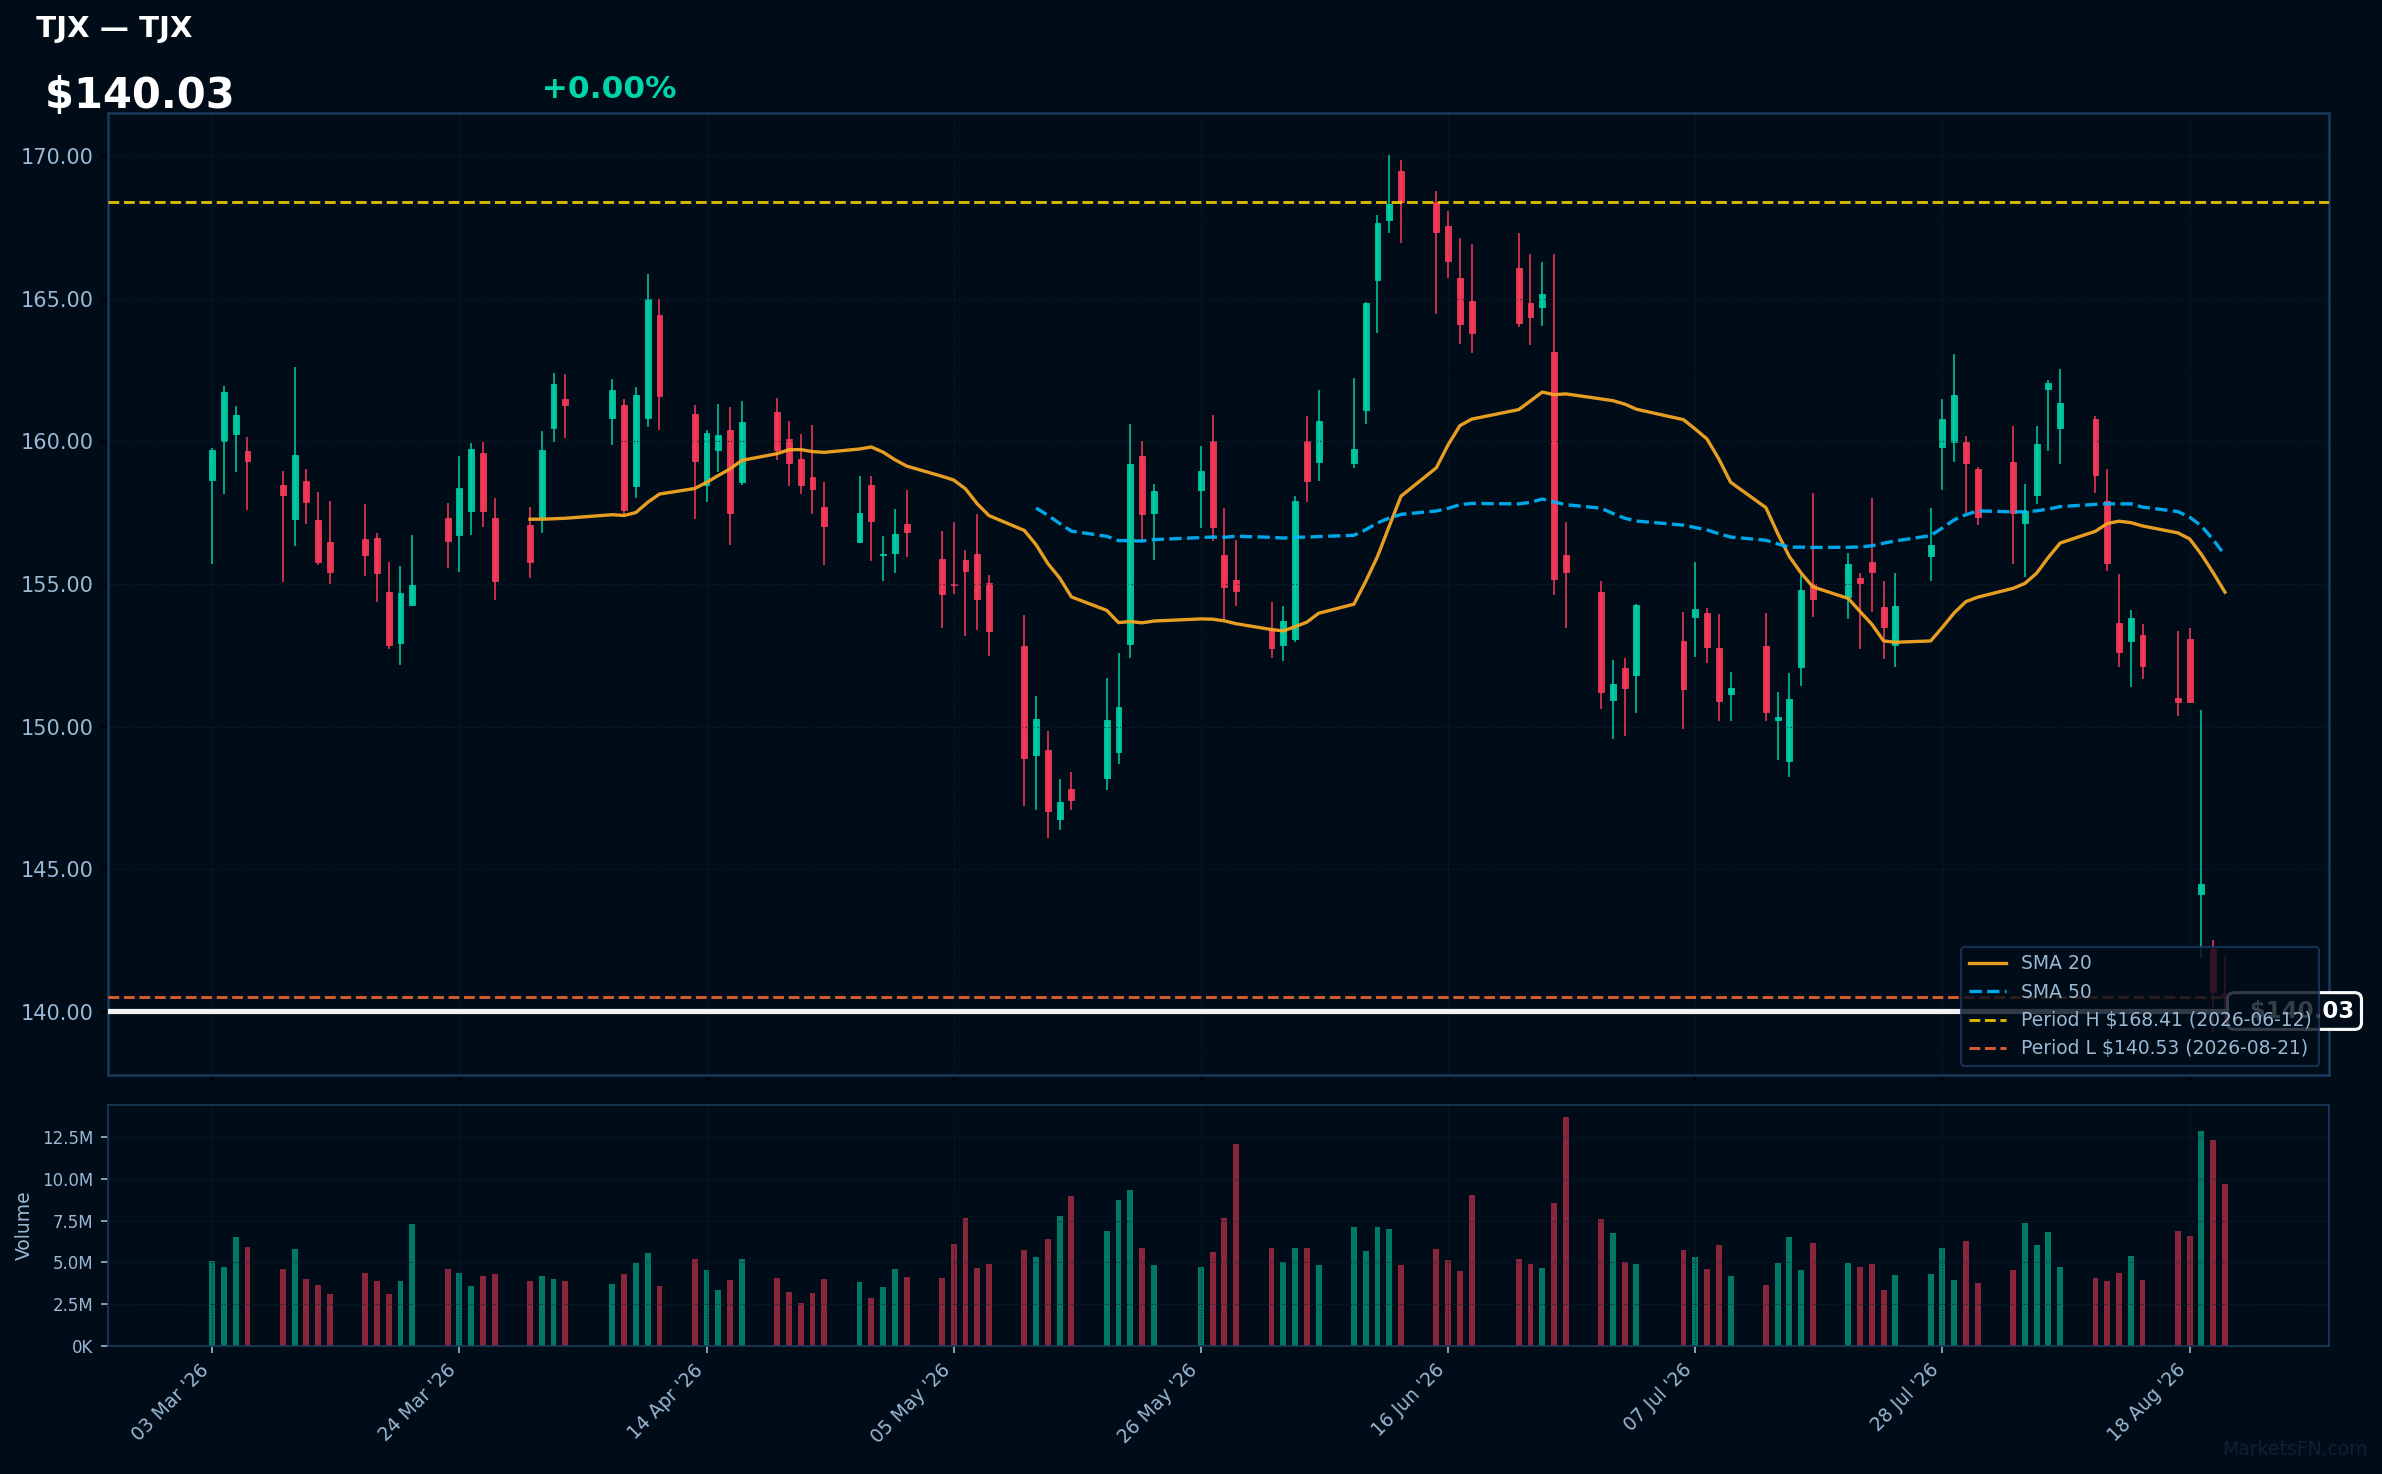
TJX | TJX Companies, Inc | Consumer Cyclical | Price Last: $140.53 | % Realized: -8.91% | RSI: 24.9 | % above MA200: -9.5% | Trend: Below MA20, MA50, MA200
TJX Companies, Inc operates off-price retail chains, offering discounted apparel and home goods. Investors should care due to its ability to attract cost-conscious consumers, especially in economic downturns, positioning it well for resilience and growth in a competitive retail landscape.
The current technical situation indicates a warning sign, with an RSI(14) of 24.9 suggesting oversold conditions. Additionally, the stock is below MA20/MA50/MA200, indicating mixed signals and testing major support, being only 0.0% above its 2026 YTD low.
Related headlines
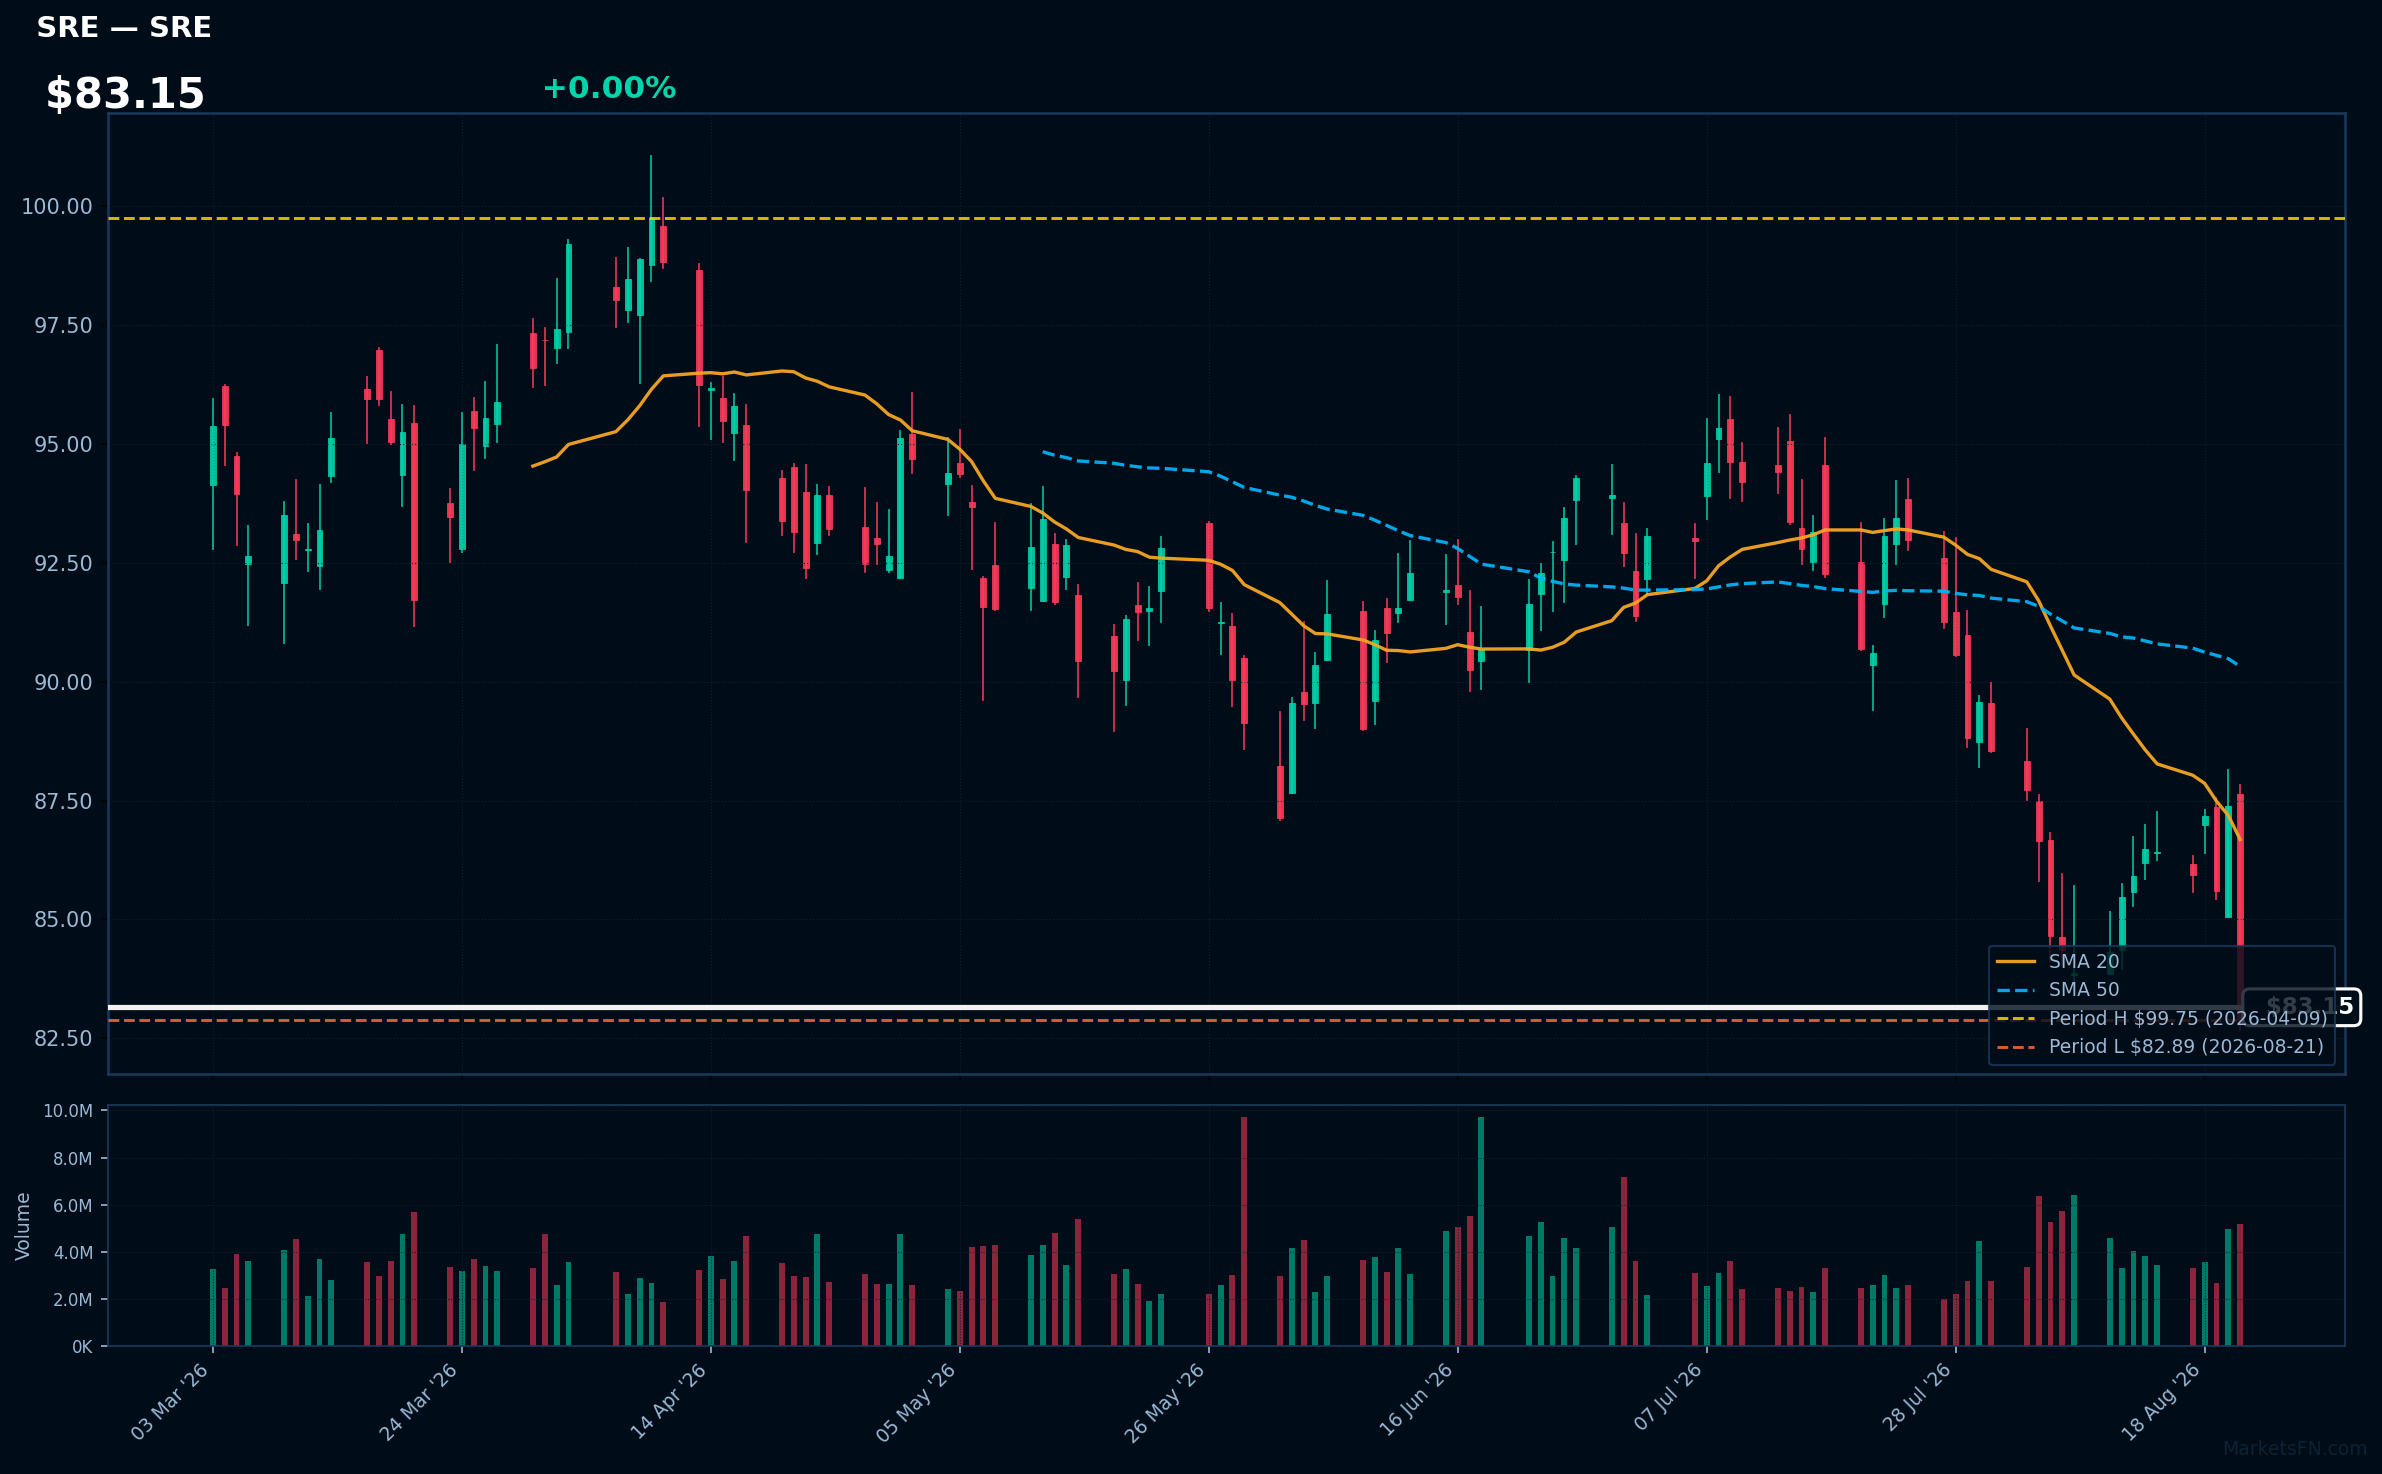
SRE | Sempra | Utilities | Price Last: $82.89 | % Realized: -7.60% | RSI: 35.7 | % above MA200: -9.3% | Trend: Below MA20, MA50, MA200
Sempra (SRE) is a leading energy infrastructure company focused on natural gas and renewable energy. Investors should care due to its strategic position in the energy transition, providing essential services and infrastructure that support both traditional and renewable energy sources.
The current technical situation indicates a bearish trend, with an RSI(14) of 35.7 and a MA alignment of price < MA20 < MA50 < MA200, suggesting sustained downtrend and testing major support, being only 0.0% above its 2026 YTD low.
Related headlines
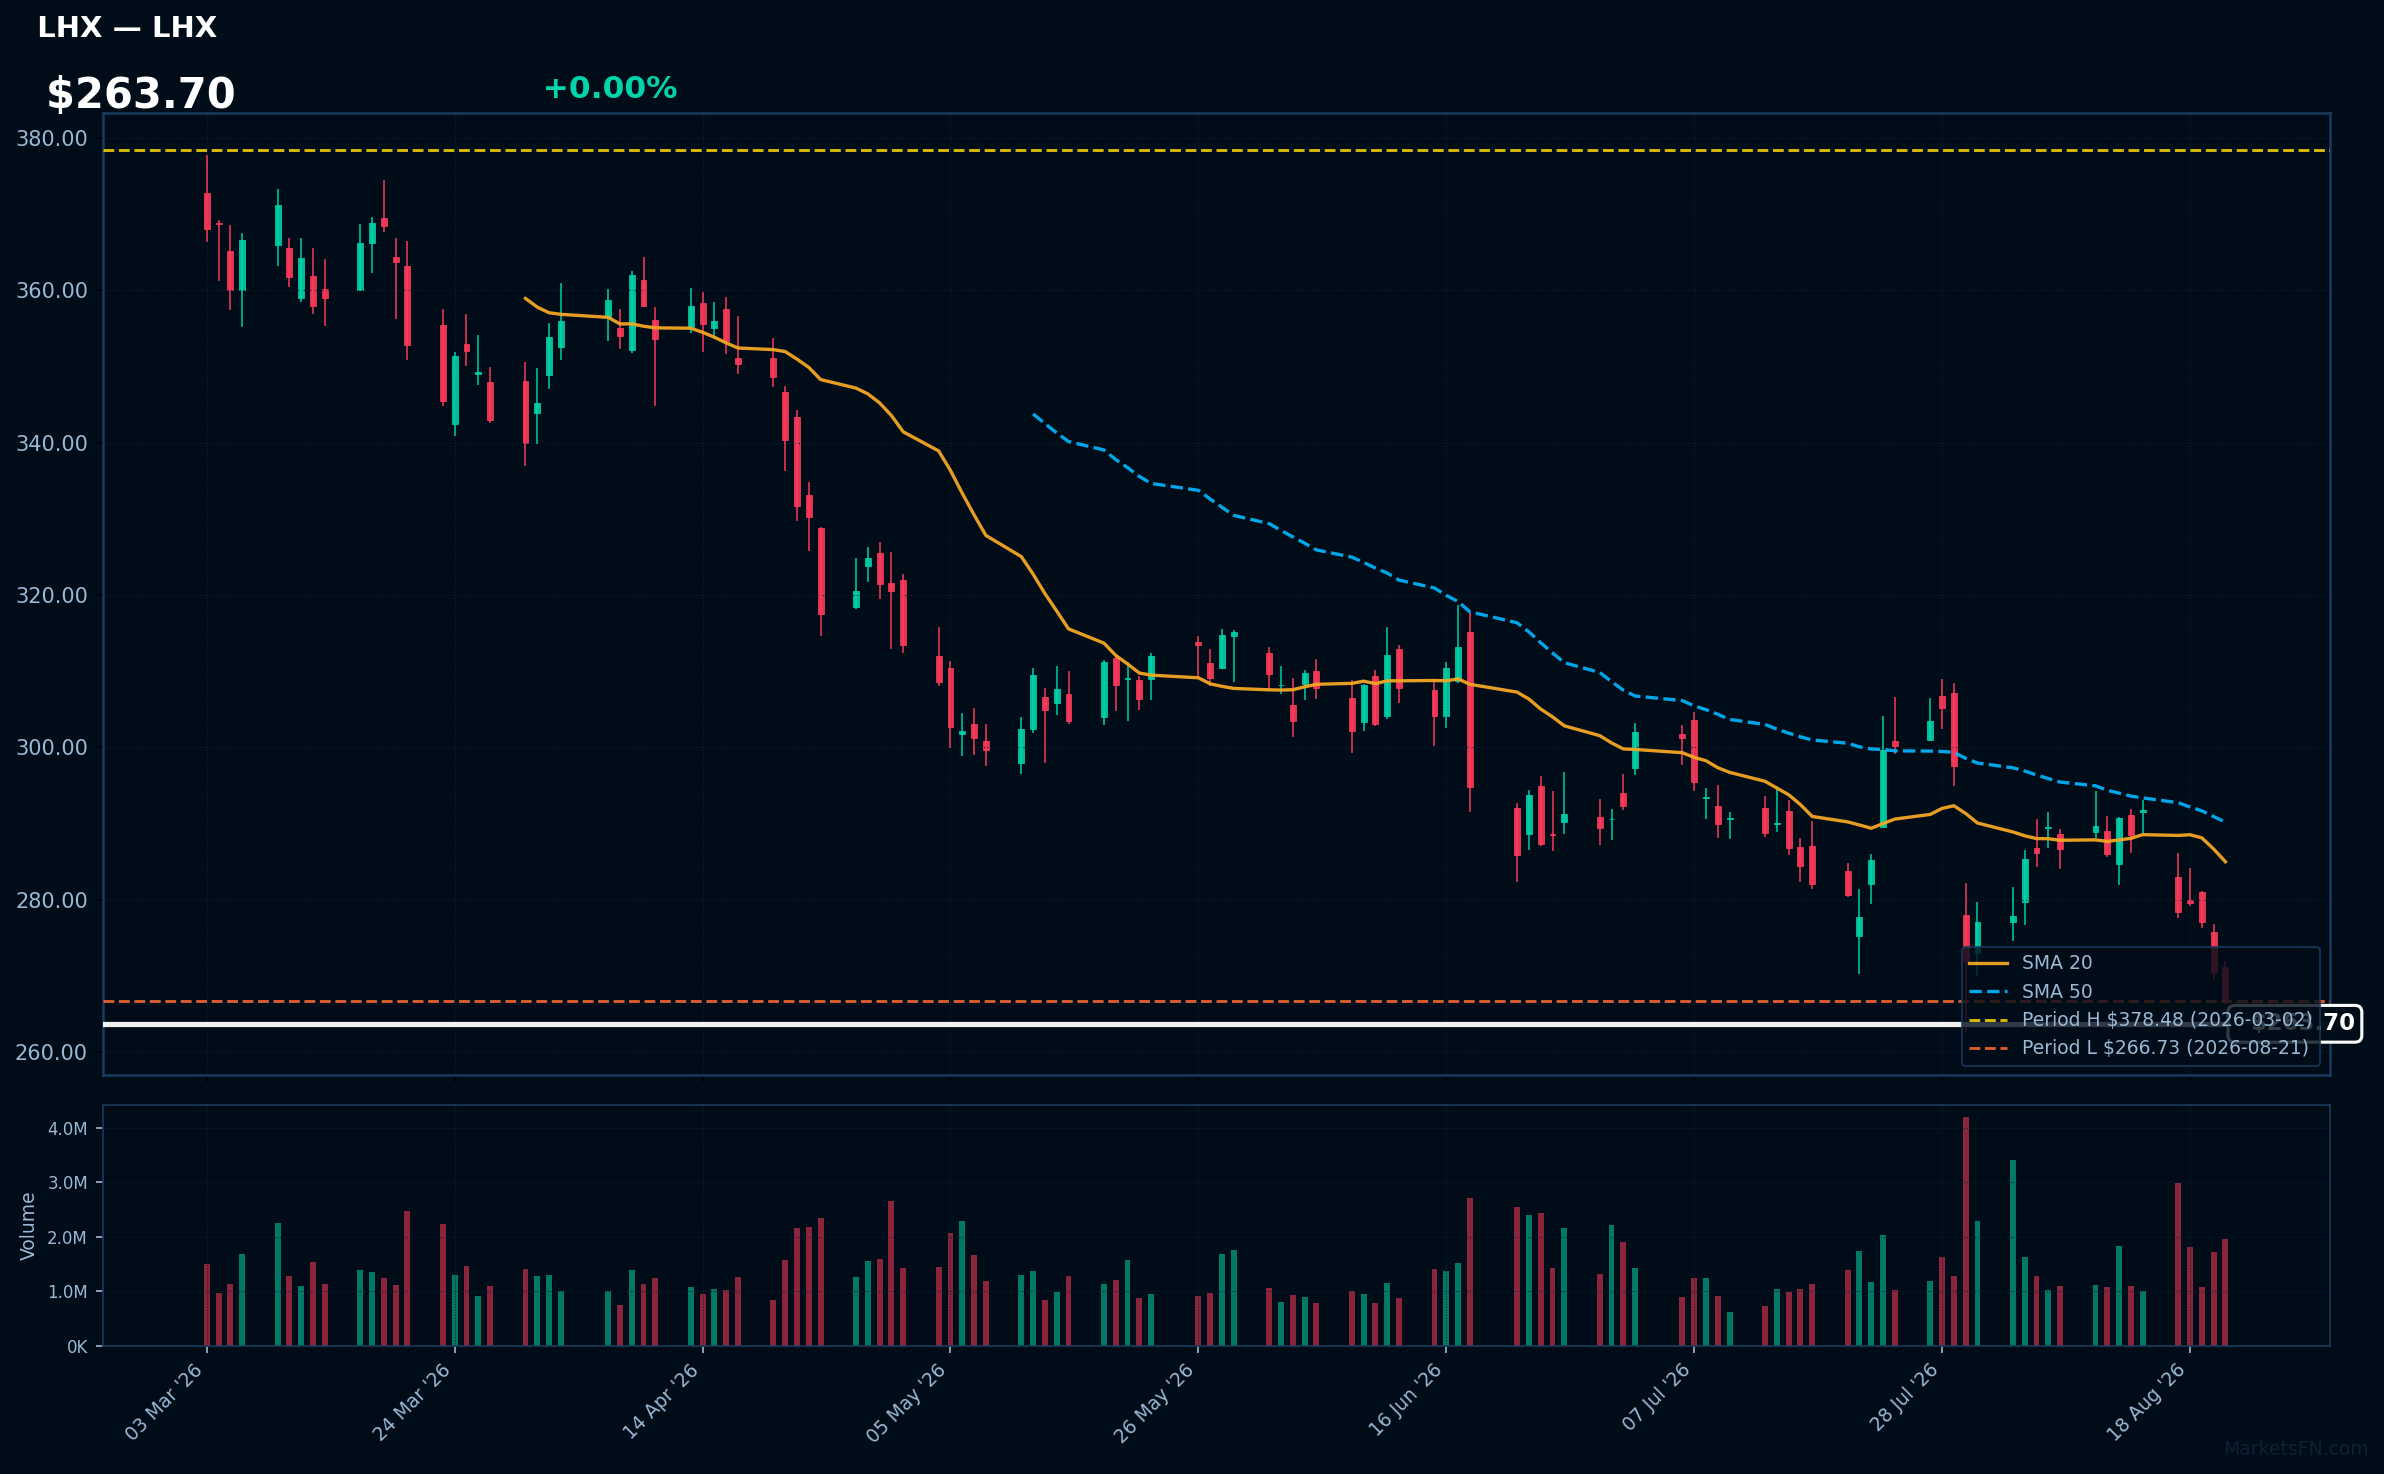
LHX | L3Harris Technologies Inc | Industrials | Price Last: $266.73 | % Realized: -12.40% | RSI: 33.4 | % above MA200: -15.4% | Trend: Below MA20, MA50, MA200
L3Harris Technologies Inc specializes in communication and electronic systems for defense and commercial markets, providing critical technologies for military and civilian applications. Investors should care due to its strategic role in national security and potential growth in defense spending.
The current technical situation indicates a bearish trend with an RSI(14) of 33.4 and a MA alignment of price < MA20 < MA50 < MA200, suggesting a sustained downtrend and testing major support, being only 0.0% above its 2026 YTD low.
Related headlines
- Women at L3Harris Shared Concerns About CEO's Behavior Years Before Ouster
- L3Harris Demonstrates Multi-Domain Supremacy at Annual Project Convergence Exercise
- L3Harris fires CEO Chris Kubasik after conduct investigation
- Ousted L3Harris CEO Chris Kubasik forfeits $45 millionbut hell still walk away with $80 million in stock and options
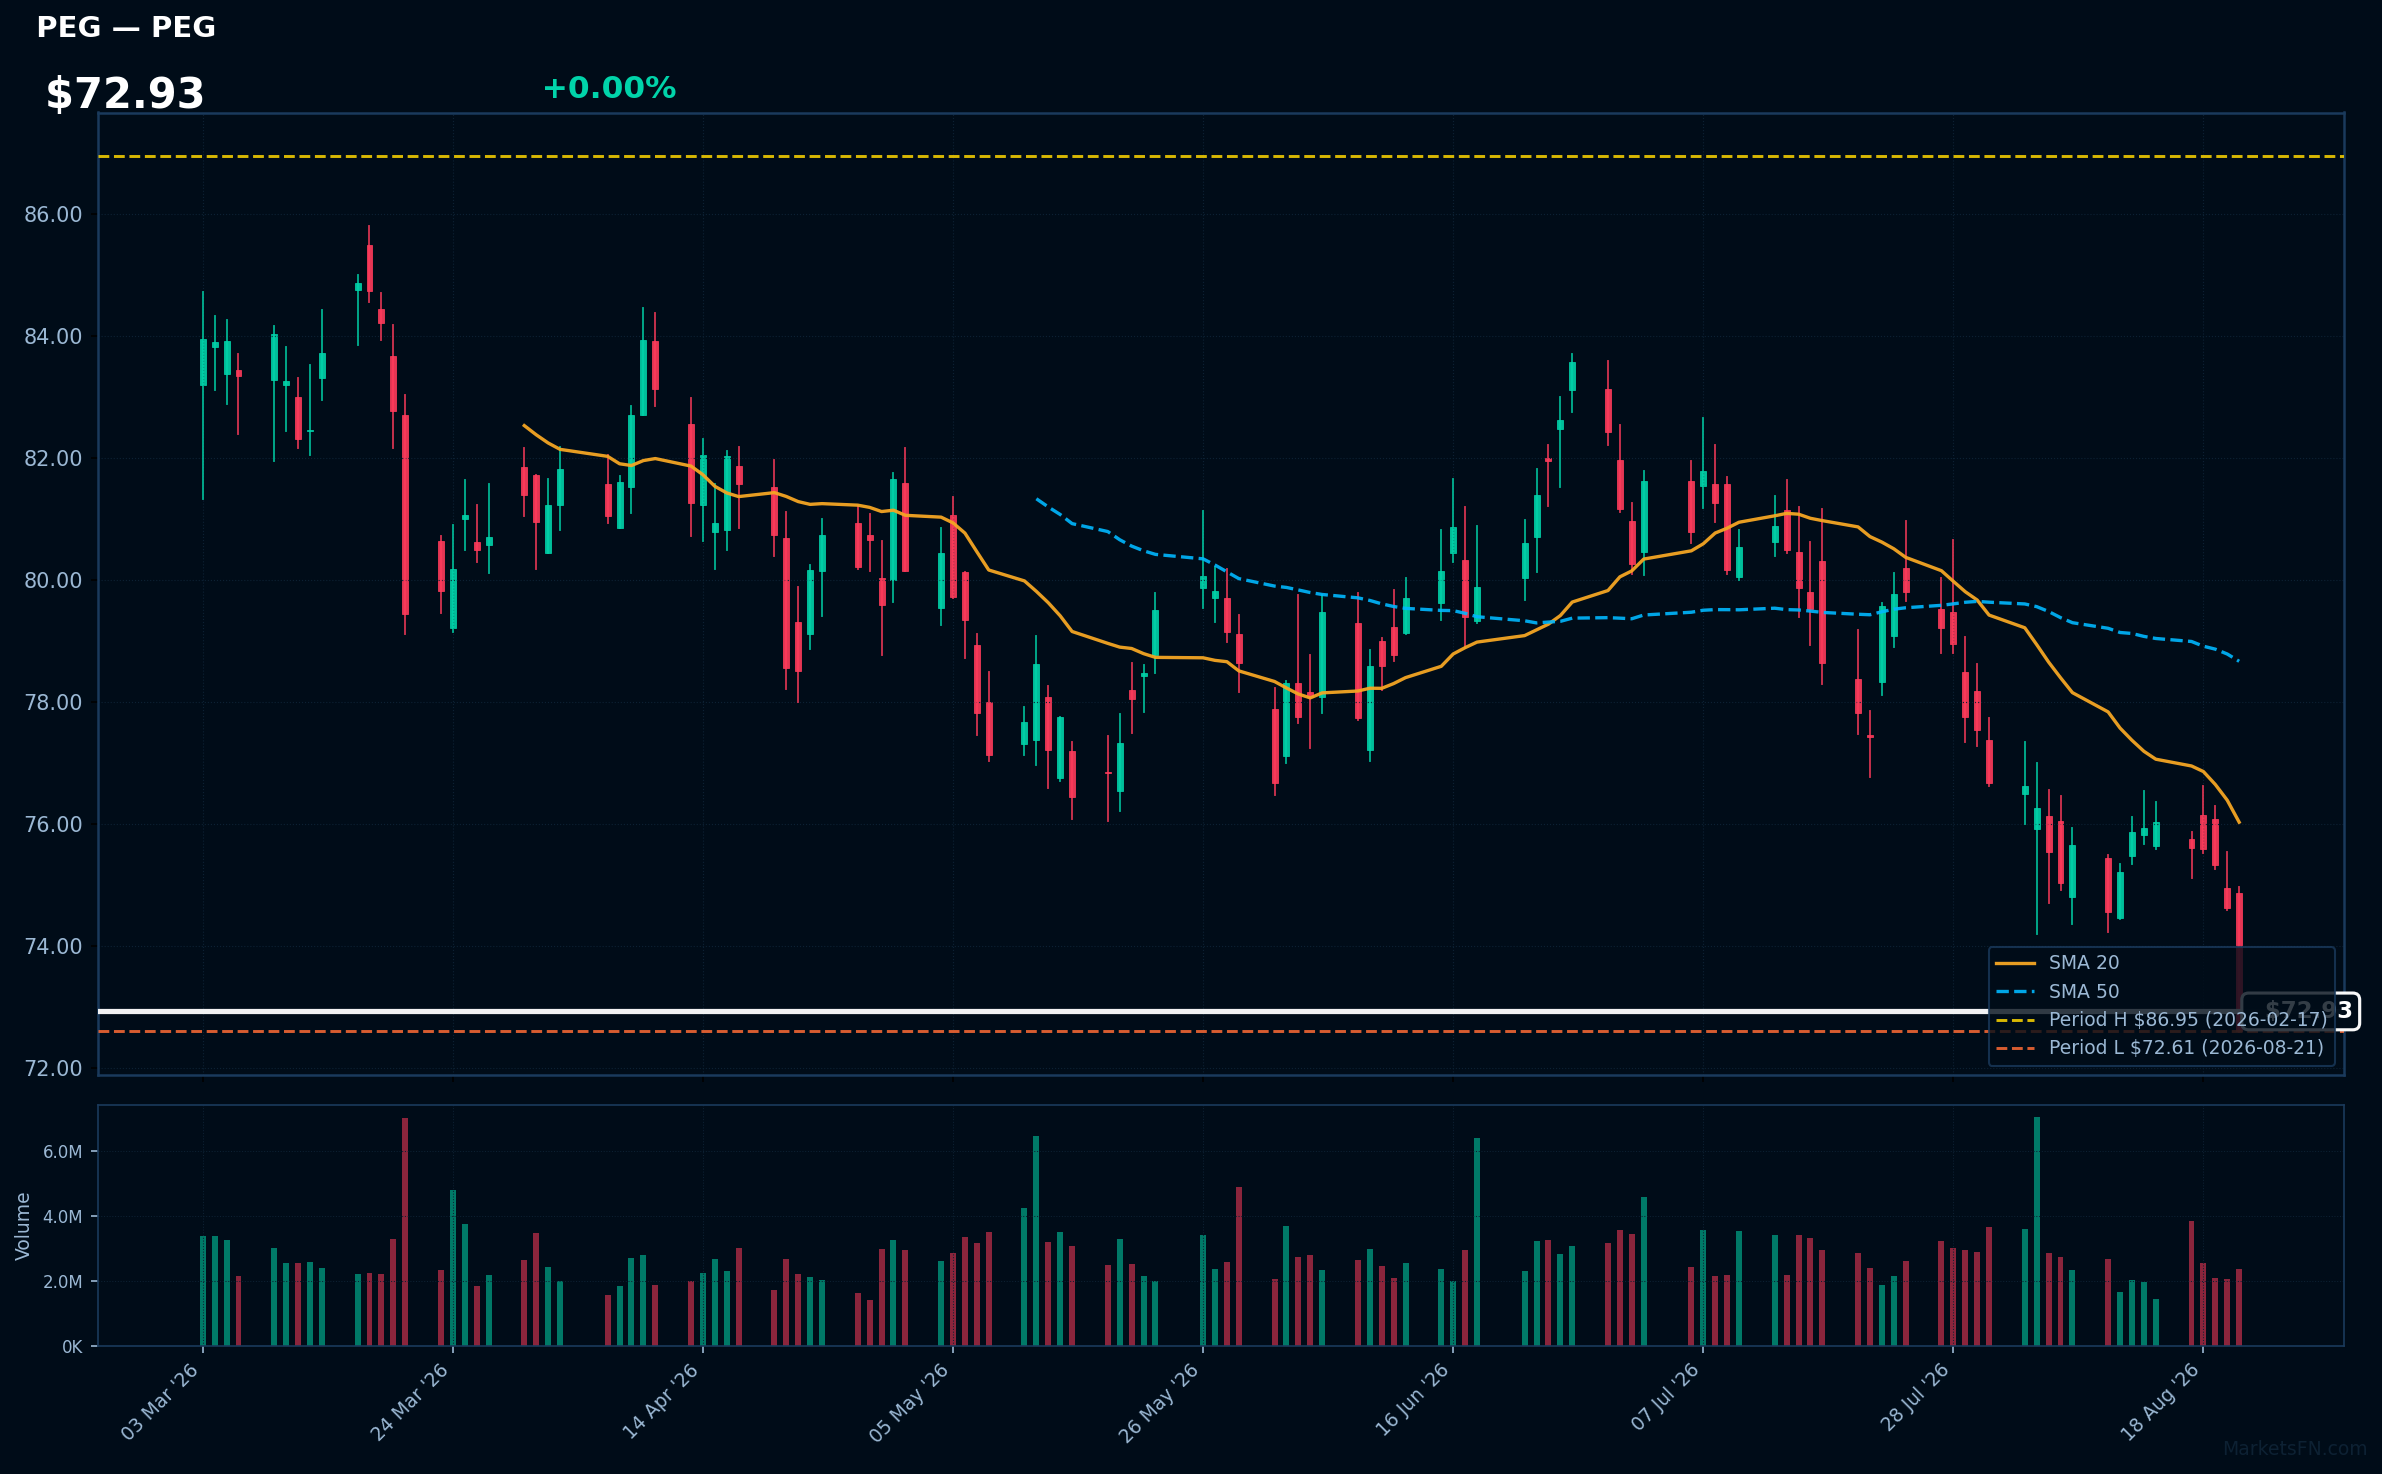
PEG | Public Service Enterprise Group Inc | Utilities | Price Last: $72.61 | % Realized: -10.35% | RSI: 28.9 | % above MA200: -9.6% | Trend: Below MA20, MA50, MA200
Public Service Enterprise Group Inc (PEG) operates as an energy company, providing electric and gas services to millions in the northeastern U.S. Investors should care due to its critical role in energy infrastructure and regulatory environment, impacting both operational stability and growth potential.
The current technical situation indicates a bearish trend, with an RSI(14) of 28.9 and a MA alignment of price < MA20 < MA50 < MA200, suggesting a sustained downtrend and testing major support just 0.0% above its 2026 YTD low.
Related headlines
- Public Service Enterprise Group Inc (PEG) (Q2 2026) Earnings Call Highlights: Reaffirms ...
- Public Service Enterprise Group Incorporated Q2 2026 Earnings Call Summary
- Public Service Enterprise Group Incorporated Q1 2026 Earnings Call Summary
- Is Public Service Enterprise Stock Underperforming the Nasdaq?
Market Commentary
The S&P 500 stocks listed as near their 2026 year-to-date extremes indicate a significant divergence in market performance. Stocks like Visa Inc, Mastercard Incorporated, Coca-Cola Co, Merck & Co Inc, and Charles Schwab Corp are at 0.0% from their highs, suggesting strong investor confidence and robust fundamentals. Conversely, Walmart Inc, TJX Companies, Sempra, L3Harris Technologies Inc, and Public Service Enterprise Group Inc are only slightly above their lows, reflecting potential challenges in their respective sectors.
The performance of these stocks can be attributed to various sector themes and prevailing market conditions. The companies near their highs are primarily in the financial, consumer staples, and healthcare sectors, which have shown resilience amid economic uncertainty. In contrast, those near their lows may be facing headwinds such as supply chain issues, inflationary pressures, or shifts in consumer behavior, particularly in retail and utilities.
Investors should closely monitor upcoming earnings reports and economic indicators that could impact these sectors. Additionally, any changes in monetary policy or consumer sentiment could influence the trajectory of these stocks. Keeping an eye on market trends and sector rotations will be crucial for making informed investment decisions moving forward.
Methodology: All 503 S&P 500 constituents screened. Close prices downloaded from 2026-01-01. Period high = highest close since Jan 1 2026; period low = lowest close since Jan 1 2026. Distance = (current price / period extreme − 1) × 100. Technical indicators computed on up to 1 year of daily OHLCV data.
Disclaimer: For informational purposes only. Not investment advice. Past performance is not indicative of future results.