S&P 500 52-Week Highs & Lows Radar: Coca-Cola (KO), Ulta Beauty (ULTA) and more
MarketsFN Team

S&P 500 52-Week Highs & Lows Radar: Coca-Cola (KO), Ulta Beauty (ULTA) and more
Screening all 503 S&P 500 constituents for stocks nearest to their 52-week high and their 52-week low. Data as of July 08, 2026. % Realized = 52-week total return.
Legend: RSI > 70 = overbought · RSI < 30 = oversold · Green % Realized = positive 52W return · Red = negative.
📈 Nearest to 52-Week High
Sectors represented: Healthcare (2), Consumer Defensive (1), Energy (1), Utilities (1)
| Ticker | Company | Sector | Price Last | % Realized | 52-Week High Date | RSI | % above MA200 | Trend |
|---|---|---|---|---|---|---|---|---|
| KO | Coca-Cola Co | Consumer Defensive | $84.32 | +20.05% | 2026-07-08 | 62.3 | +13.1% | Above MA20, MA50, MA200 |
| UNH | Unitedhealth Group Inc | Healthcare | $428.60 | +39.29% | 2026-07-08 | 63.9 | +26.6% | Above MA20, MA50, MA200 |
| CVS | CVS Health Corp | Healthcare | $104.91 | +56.72% | 2026-07-08 | 65.2 | +27.9% | Above MA20, MA50, MA200 |
| MPC | Marathon Petroleum Corp | Energy | $271.56 | +50.93% | 2026-07-08 | 62.9 | +28.2% | Above MA20, MA50, MA200 |
| D | Dominion Energy Inc | Utilities | $69.91 | +24.13% | 2026-07-08 | 61.5 | +12.0% | Above MA20, MA50, MA200 |
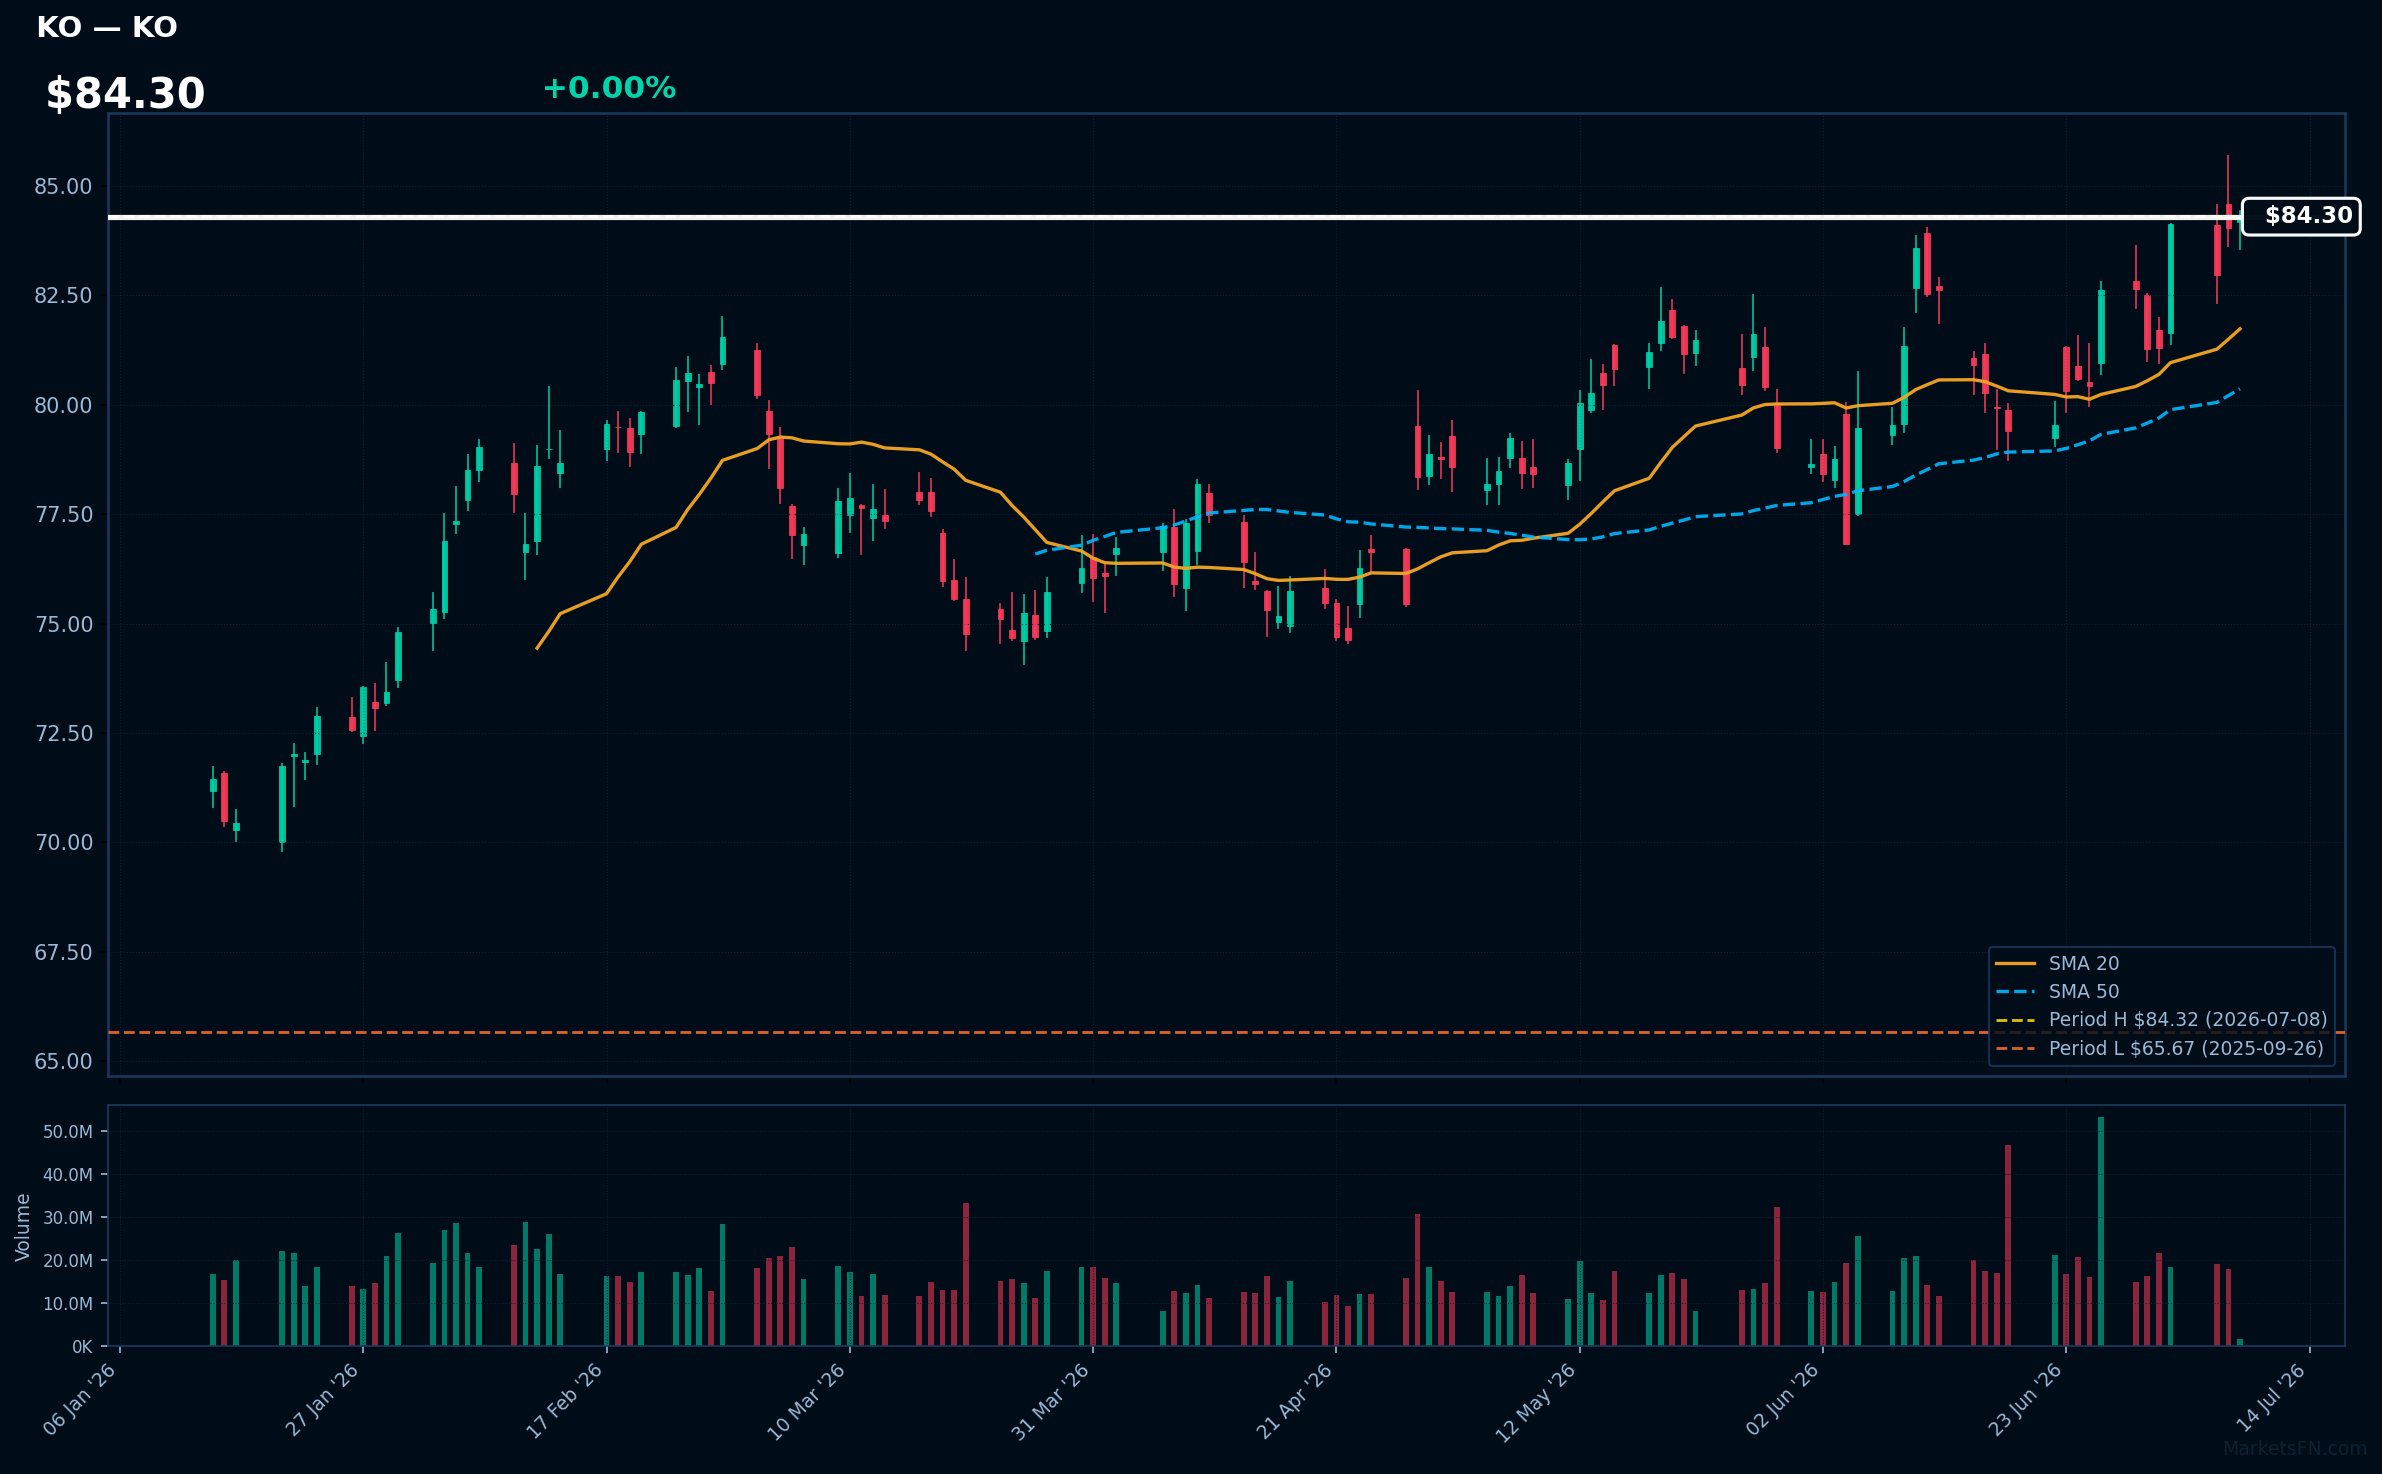
KO | Coca-Cola Co | Consumer Defensive | Price Last: $84.32 | % Realized: +20.05% | RSI: 62.3 | % above MA200: +13.1% | Trend: Above MA20, MA50, MA200
Coca-Cola Co is a beverage company that manufactures and distributes beverages, generating revenue primarily through the sale of its products to retailers and distributors. Investors should care about its brand portfolio and distribution network.
Coca-Cola Co's technicals indicate sustained uptrend with price > MA20 > MA50 > MA200, RSI(14) at 62.3, and 0.0% below 52-Week high, suggesting momentum; the stock has returned 20.1% over the 52-Week period, reinforcing the uptrend.
Related headlines
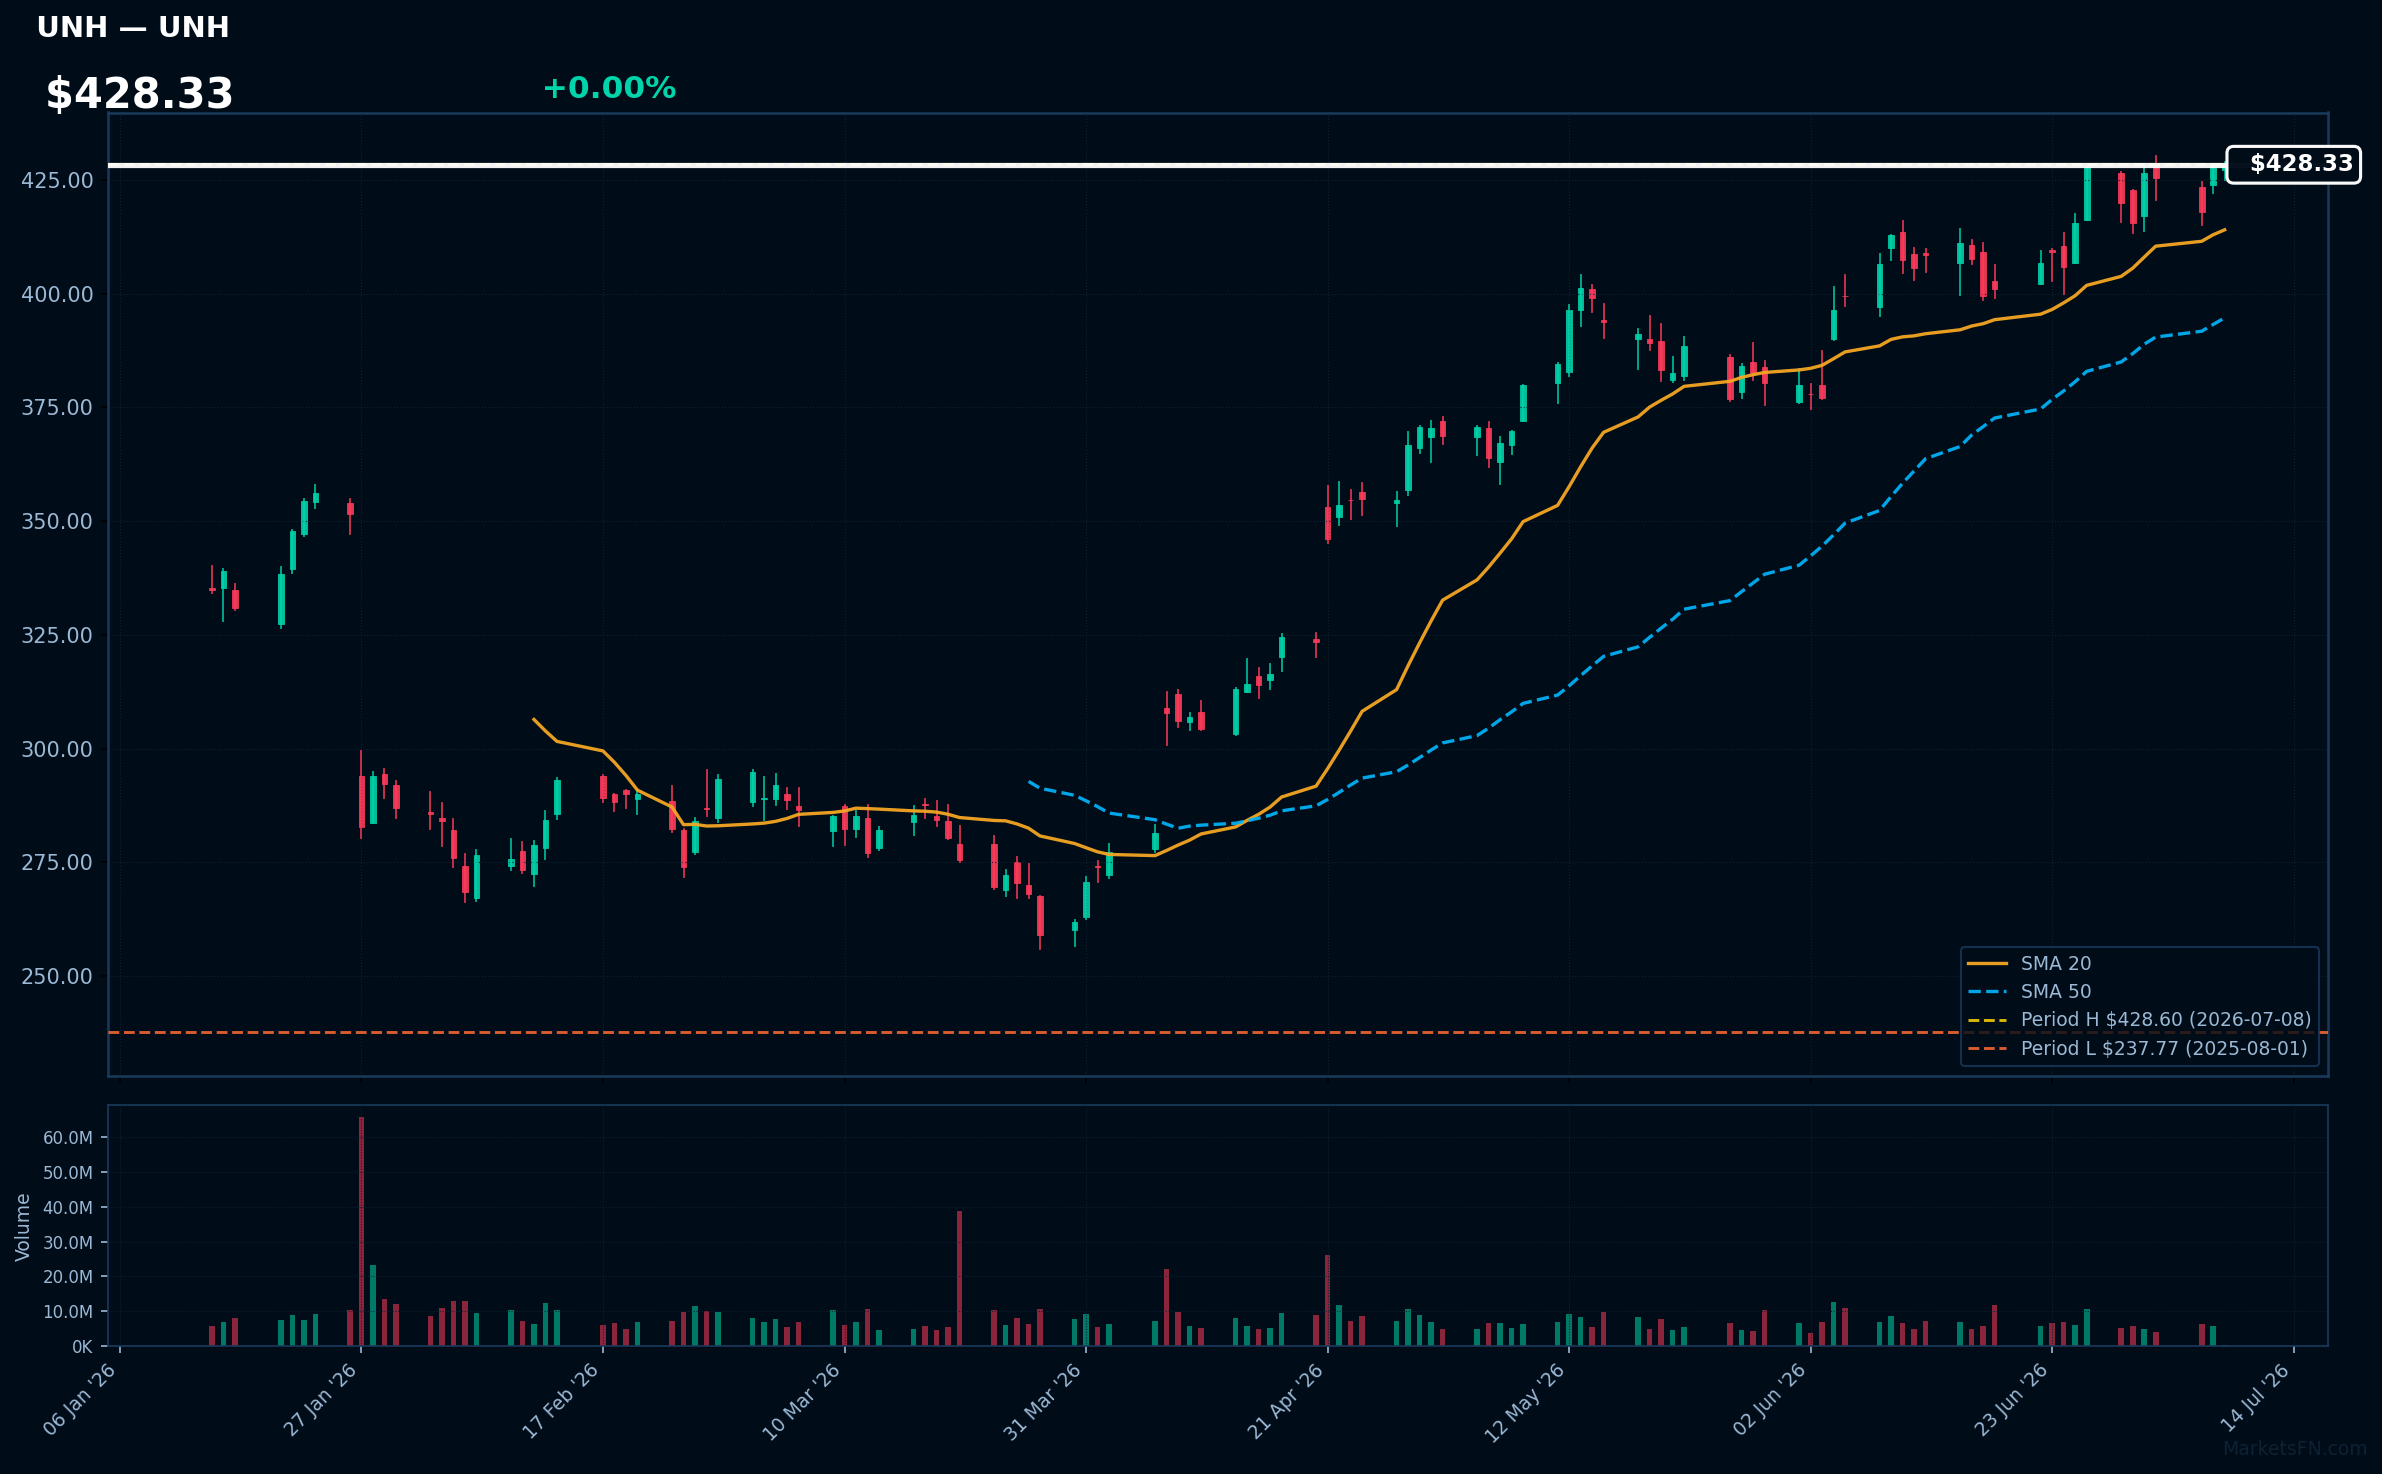
UNH | Unitedhealth Group Inc | Healthcare | Price Last: $428.60 | % Realized: +39.29% | RSI: 63.9 | % above MA200: +26.6% | Trend: Above MA20, MA50, MA200
Unitedhealth Group Inc operates health insurance and healthcare services businesses, with a diversified revenue stream across individual and group health insurance, Medicare, and healthcare delivery. Investors care due to the company's significant presence in the US healthcare market.
UNH's technicals indicate sustained uptrend with price > MA20 > MA50 > MA200, RSI(14) at 63.9, and 0.0% below 52-Week high, suggesting momentum; the stock has returned 39.3% over the 52-Week period, reinforcing the uptrend.
Related headlines
- External audit of UnitedHealth senior home visits finds most diagnoses supported by medical data
- Guardants Shield colon cancer blood test snags UnitedHealth coverage
- GH Stock At Over 5-Year Highs Whats The UnitedHealth Connection?
- UnitedHealthcare Community Plan of Nebraska Invests $385,000 to Expand Programs to Support Older Adults, Caregivers and People with Disabilities
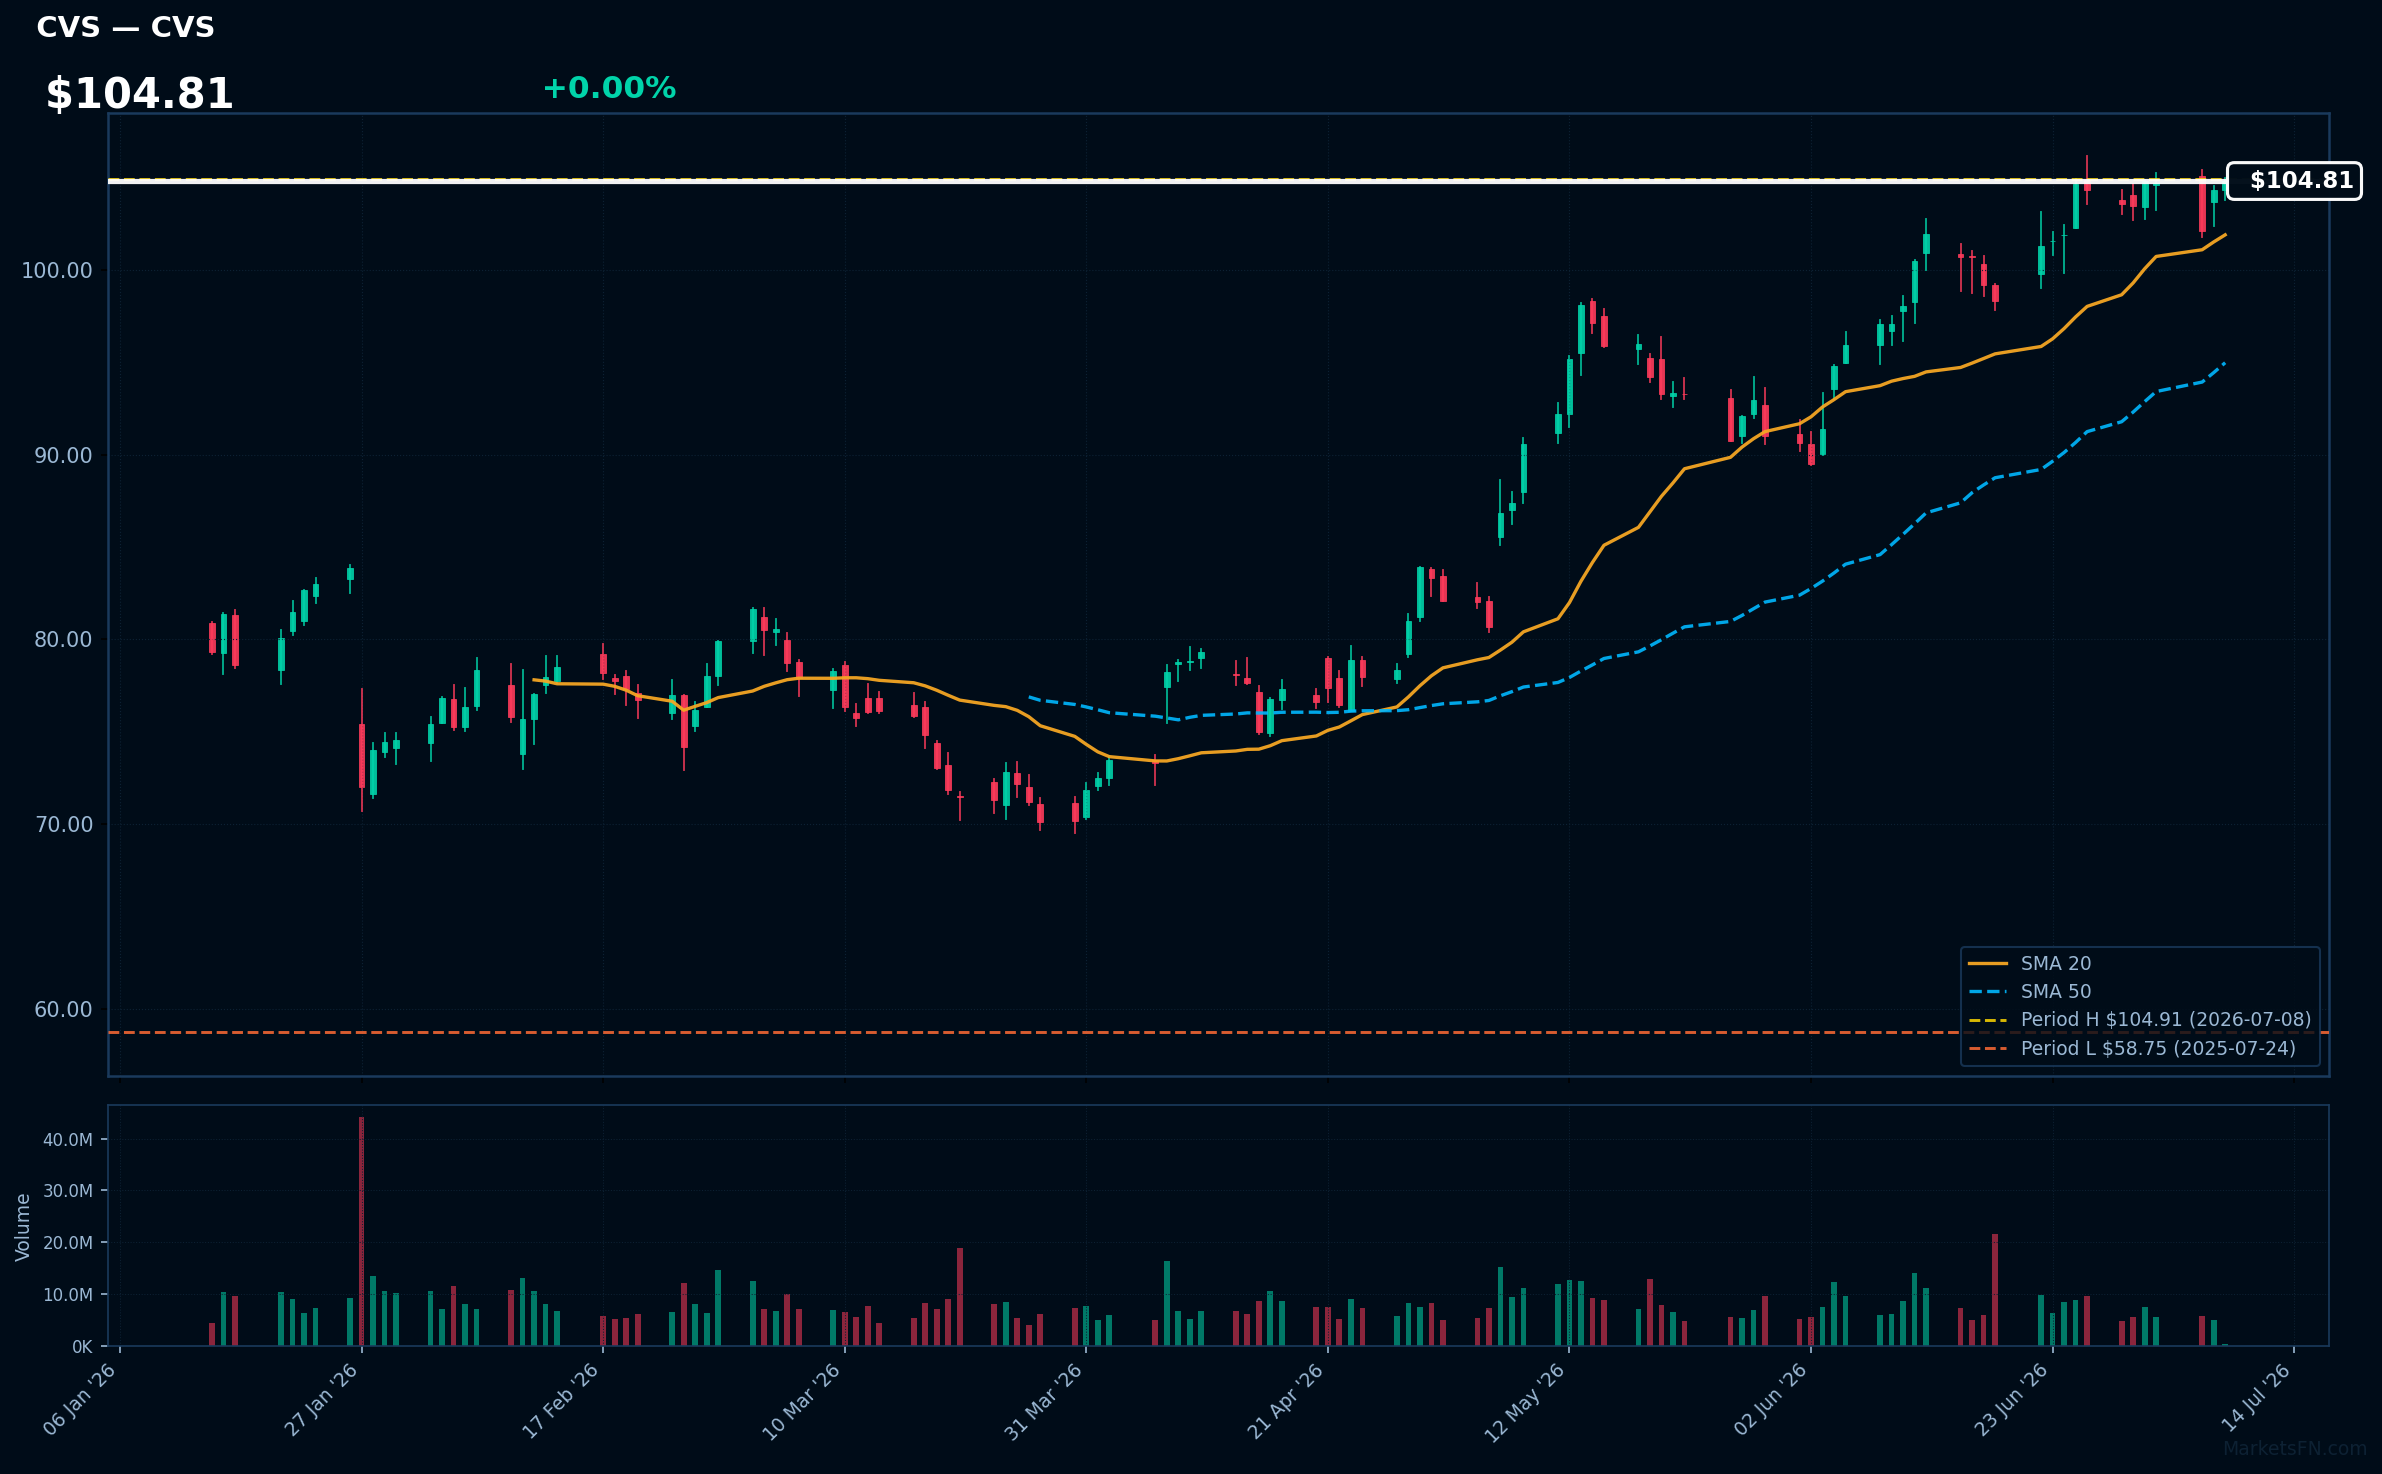
CVS | CVS Health Corp | Healthcare | Price Last: $104.91 | % Realized: +56.72% | RSI: 65.2 | % above MA200: +27.9% | Trend: Above MA20, MA50, MA200
CVS Health Corp operates pharmacies and provides health insurance, generating revenue through prescription dispensing, health insurance premiums, and pharmacy benefit management services. Investors care about its integrated healthcare model and market share.
CVS shows bullish technicals with RSI(14) at 65.2, price above MA20 > MA50 > MA200, and 0.0% below its 52-Week high, indicating sustained uptrend and potential breakout momentum, not a warning sign.
Related headlines
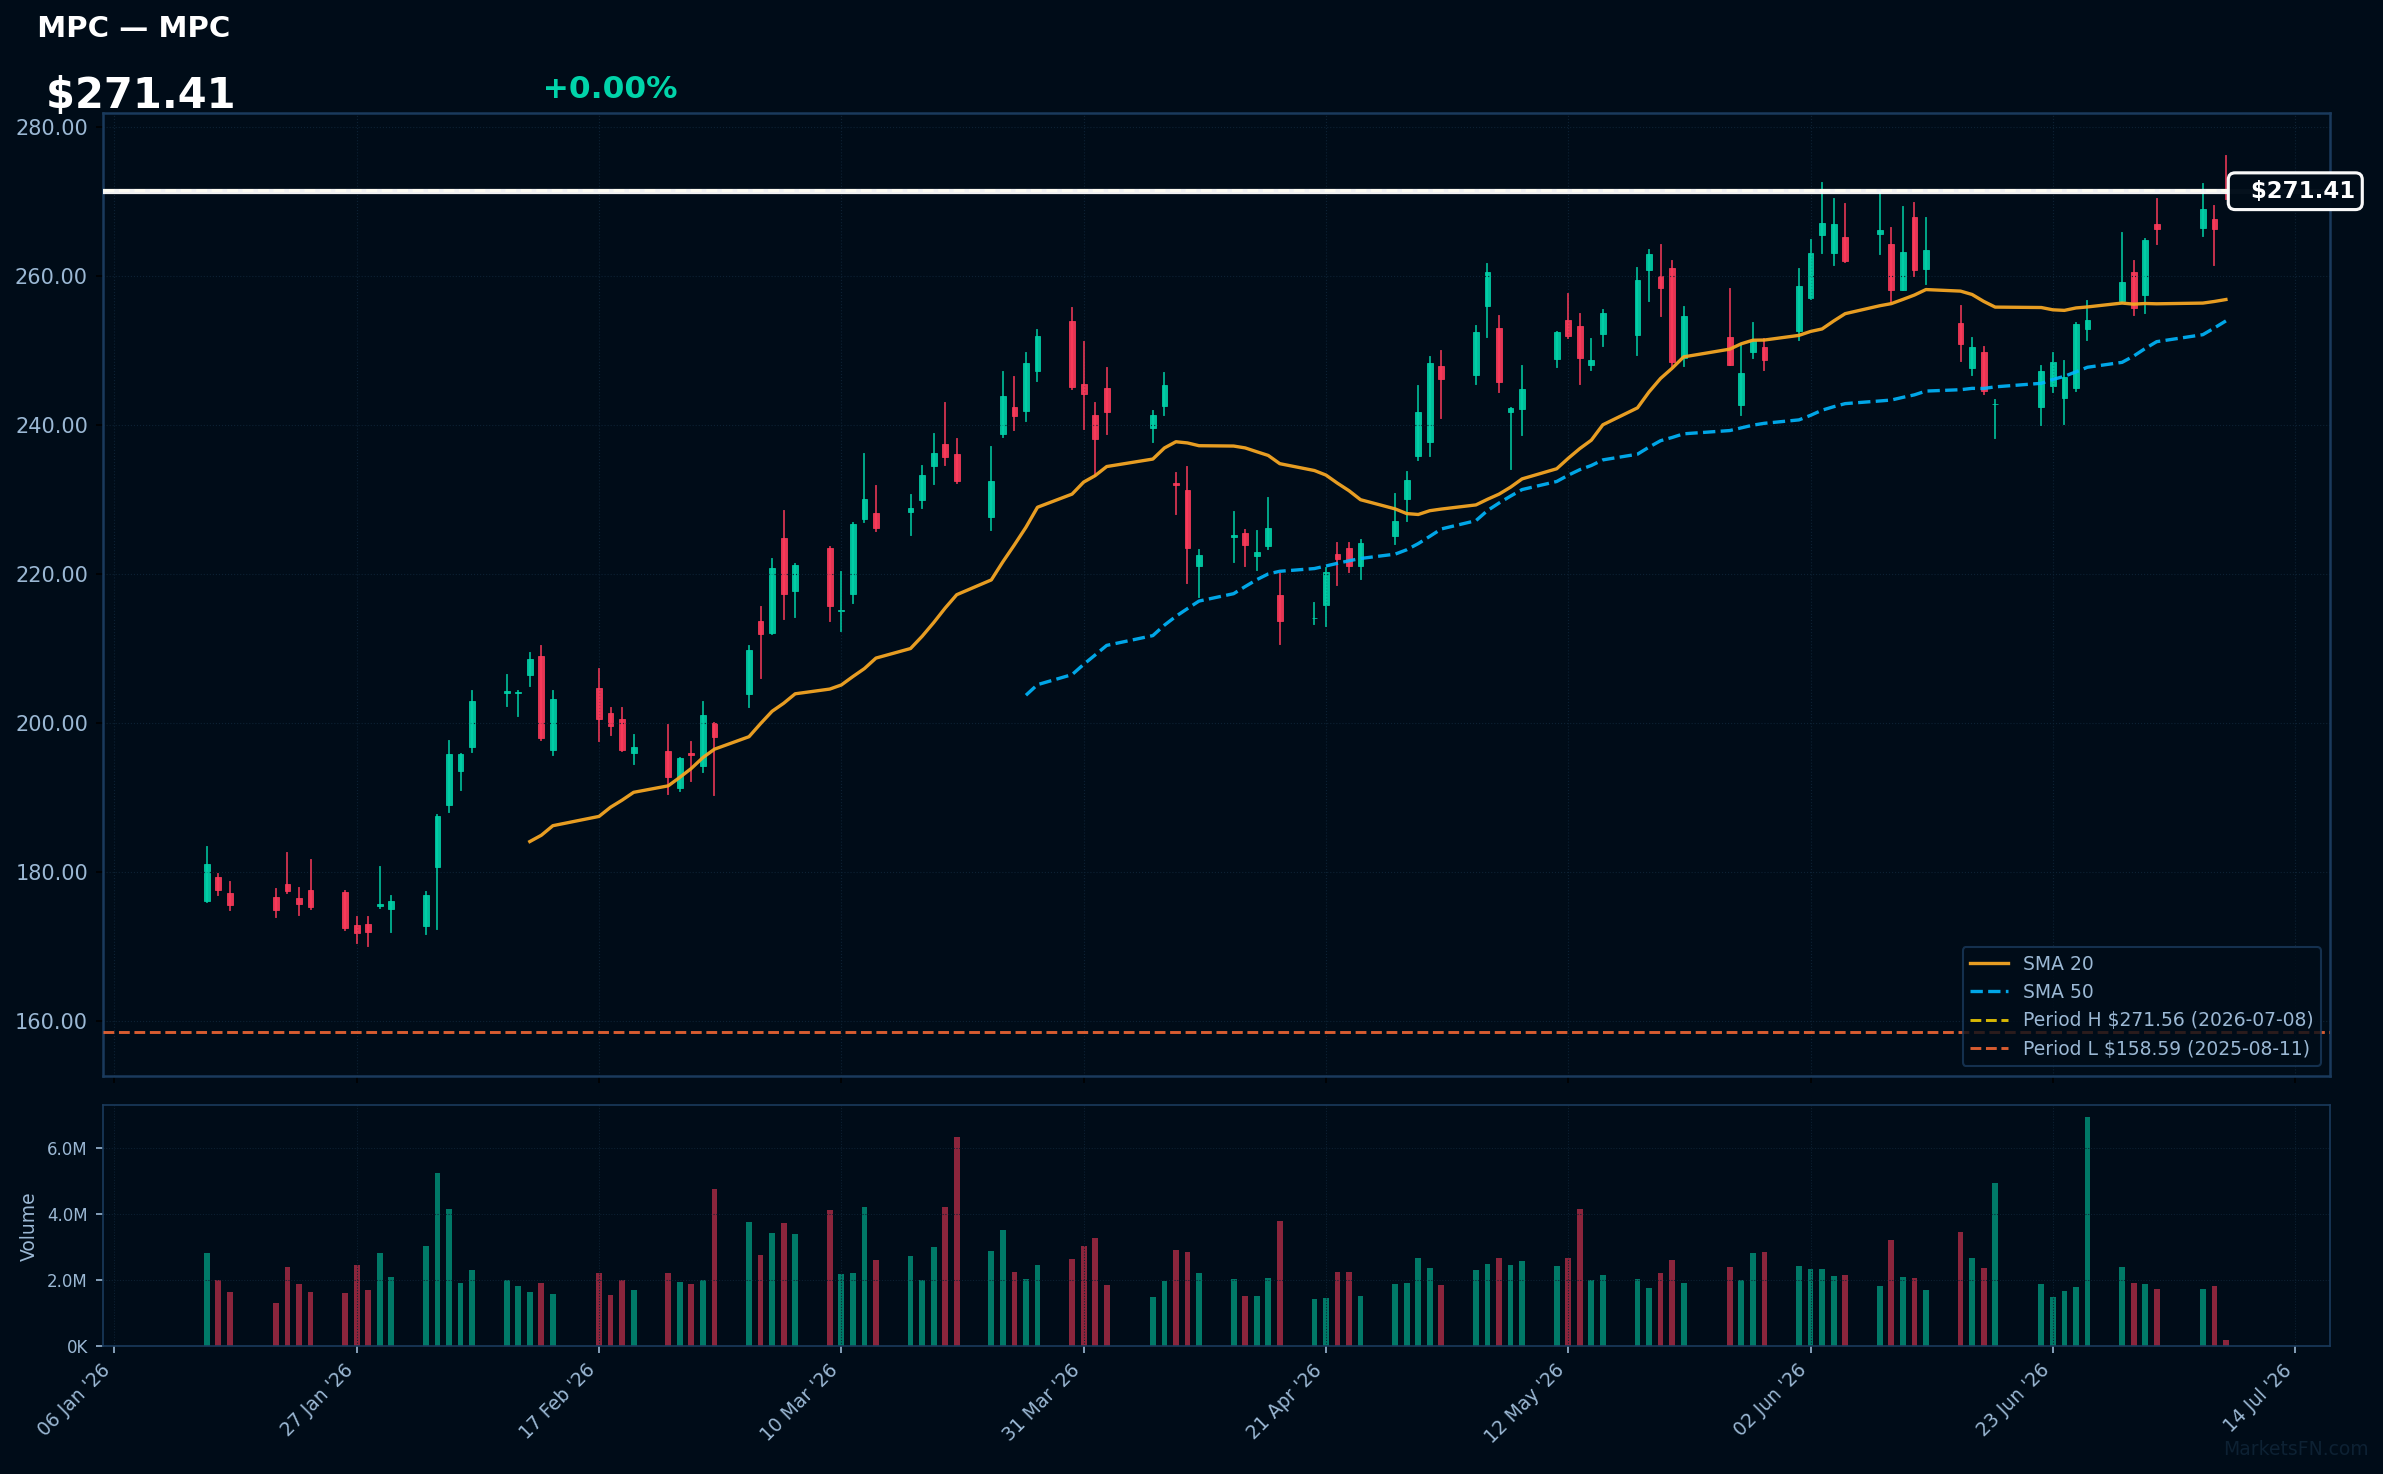
MPC | Marathon Petroleum Corp | Energy | Price Last: $271.56 | % Realized: +50.93% | RSI: 62.9 | % above MA200: +28.2% | Trend: Above MA20, MA50, MA200
Marathon Petroleum Corp is an energy company that refines, markets, and transports petroleum products. Investors should care because its refining and logistics operations are crucial to the energy supply chain, and its performance is tied to global energy demand and refining margins.
Marathon Petroleum Corp is in a sustained uptrend with a bullish MA alignment (price > MA20 > MA50 > MA200) and RSI(14) at 62.9, indicating strong momentum. The stock is near its 52-Week high, 0.0% below, suggesting a potential breakout.
Related headlines
- BP, Marathon, 7-Eleven, Walmart sued for allegedly using AI to boost California gas prices
- Marathon Petroleum Corp. to Report Second-Quarter Financial Results on August 4, 2026
- Marathon Petroleum Corp. names Brian Worthington vice president, Investor Relations; Kristina Kazarian to become vice president, Finance and Treasurer
- MPC- A US Refiner Benefitting from Tighter Jet Fuel Market
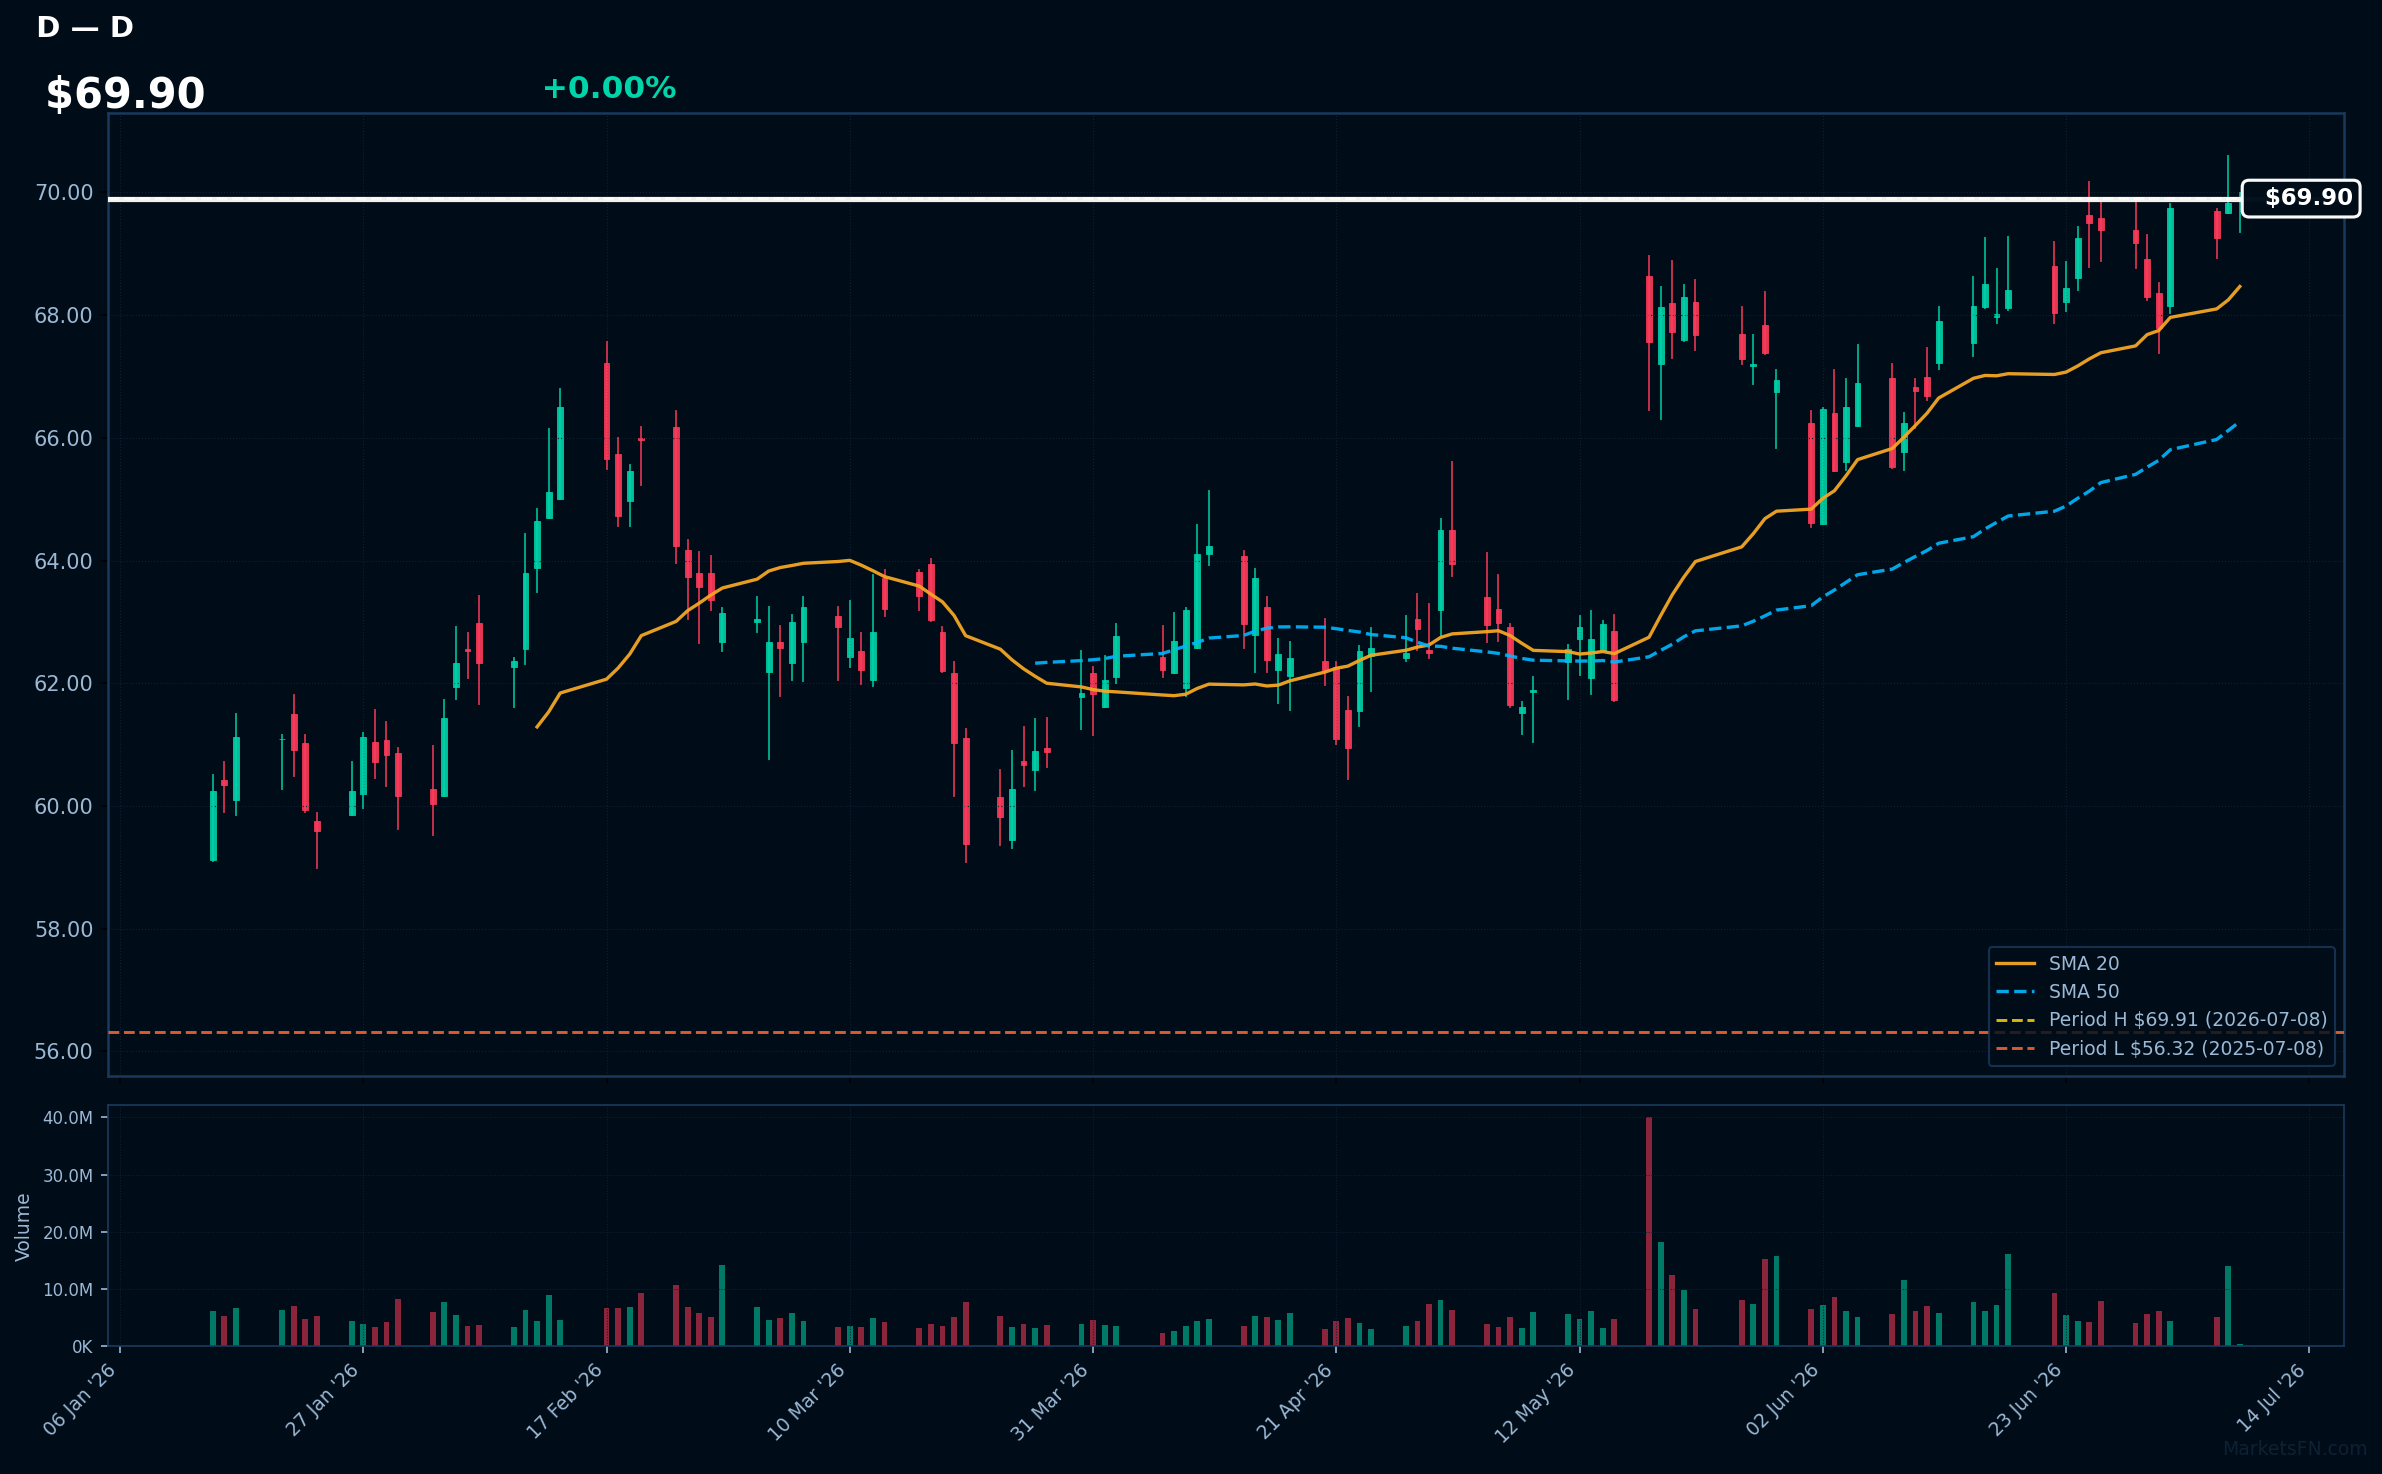
D | Dominion Energy Inc | Utilities | Price Last: $69.91 | % Realized: +24.13% | RSI: 61.5 | % above MA200: +12.0% | Trend: Above MA20, MA50, MA200
Dominion Energy Inc is a utility company that generates and distributes electricity and natural gas. Investors should care because its stable cash flows and dividend yield can provide a defensive component to a portfolio, especially during economic downturns.
Dominion Energy Inc is in a sustained uptrend with price > MA20 > MA50 > MA200. The RSI(14) is 61.5, indicating building momentum. The stock is 0.0% below its 52-Week high, near a potential breakout level, with a 24.1% return over the 52-Week period.
Related headlines
📉 Nearest to 52-Week Low
Sectors represented: Consumer Cyclical (4), Real Estate (1)
| Ticker | Company | Sector | Price Last | % Realized | 52-Week Low Date | RSI | % above MA200 | Trend |
|---|---|---|---|---|---|---|---|---|
| ULTA | Ulta Beauty Inc | Consumer Cyclical | $452.11 | -6.44% | 2026-06-17 | 41.0 | -19.3% | Below MA20, MA50, MA200 |
| LVS | Las Vegas Sands Corp | Consumer Cyclical | $46.65 | -5.01% | 2026-07-07 | 38.7 | -17.2% | Below MA20, MA50, MA200 |
| ORLY | O'Reilly Automotive, Inc | Consumer Cyclical | $85.37 | -6.84% | 2026-07-06 | 41.6 | -9.7% | Below MA20, MA50, MA200 |
| VICI | VICI Properties Inc | Real Estate | $26.51 | -19.69% | 2026-06-22 | 42.4 | -8.2% | Below MA20, MA50, MA200 |
| TSCO | Tractor Supply Co | Consumer Cyclical | $29.65 | -47.78% | 2026-06-03 | 40.4 | -36.3% | Below MA20, MA50, MA200 |
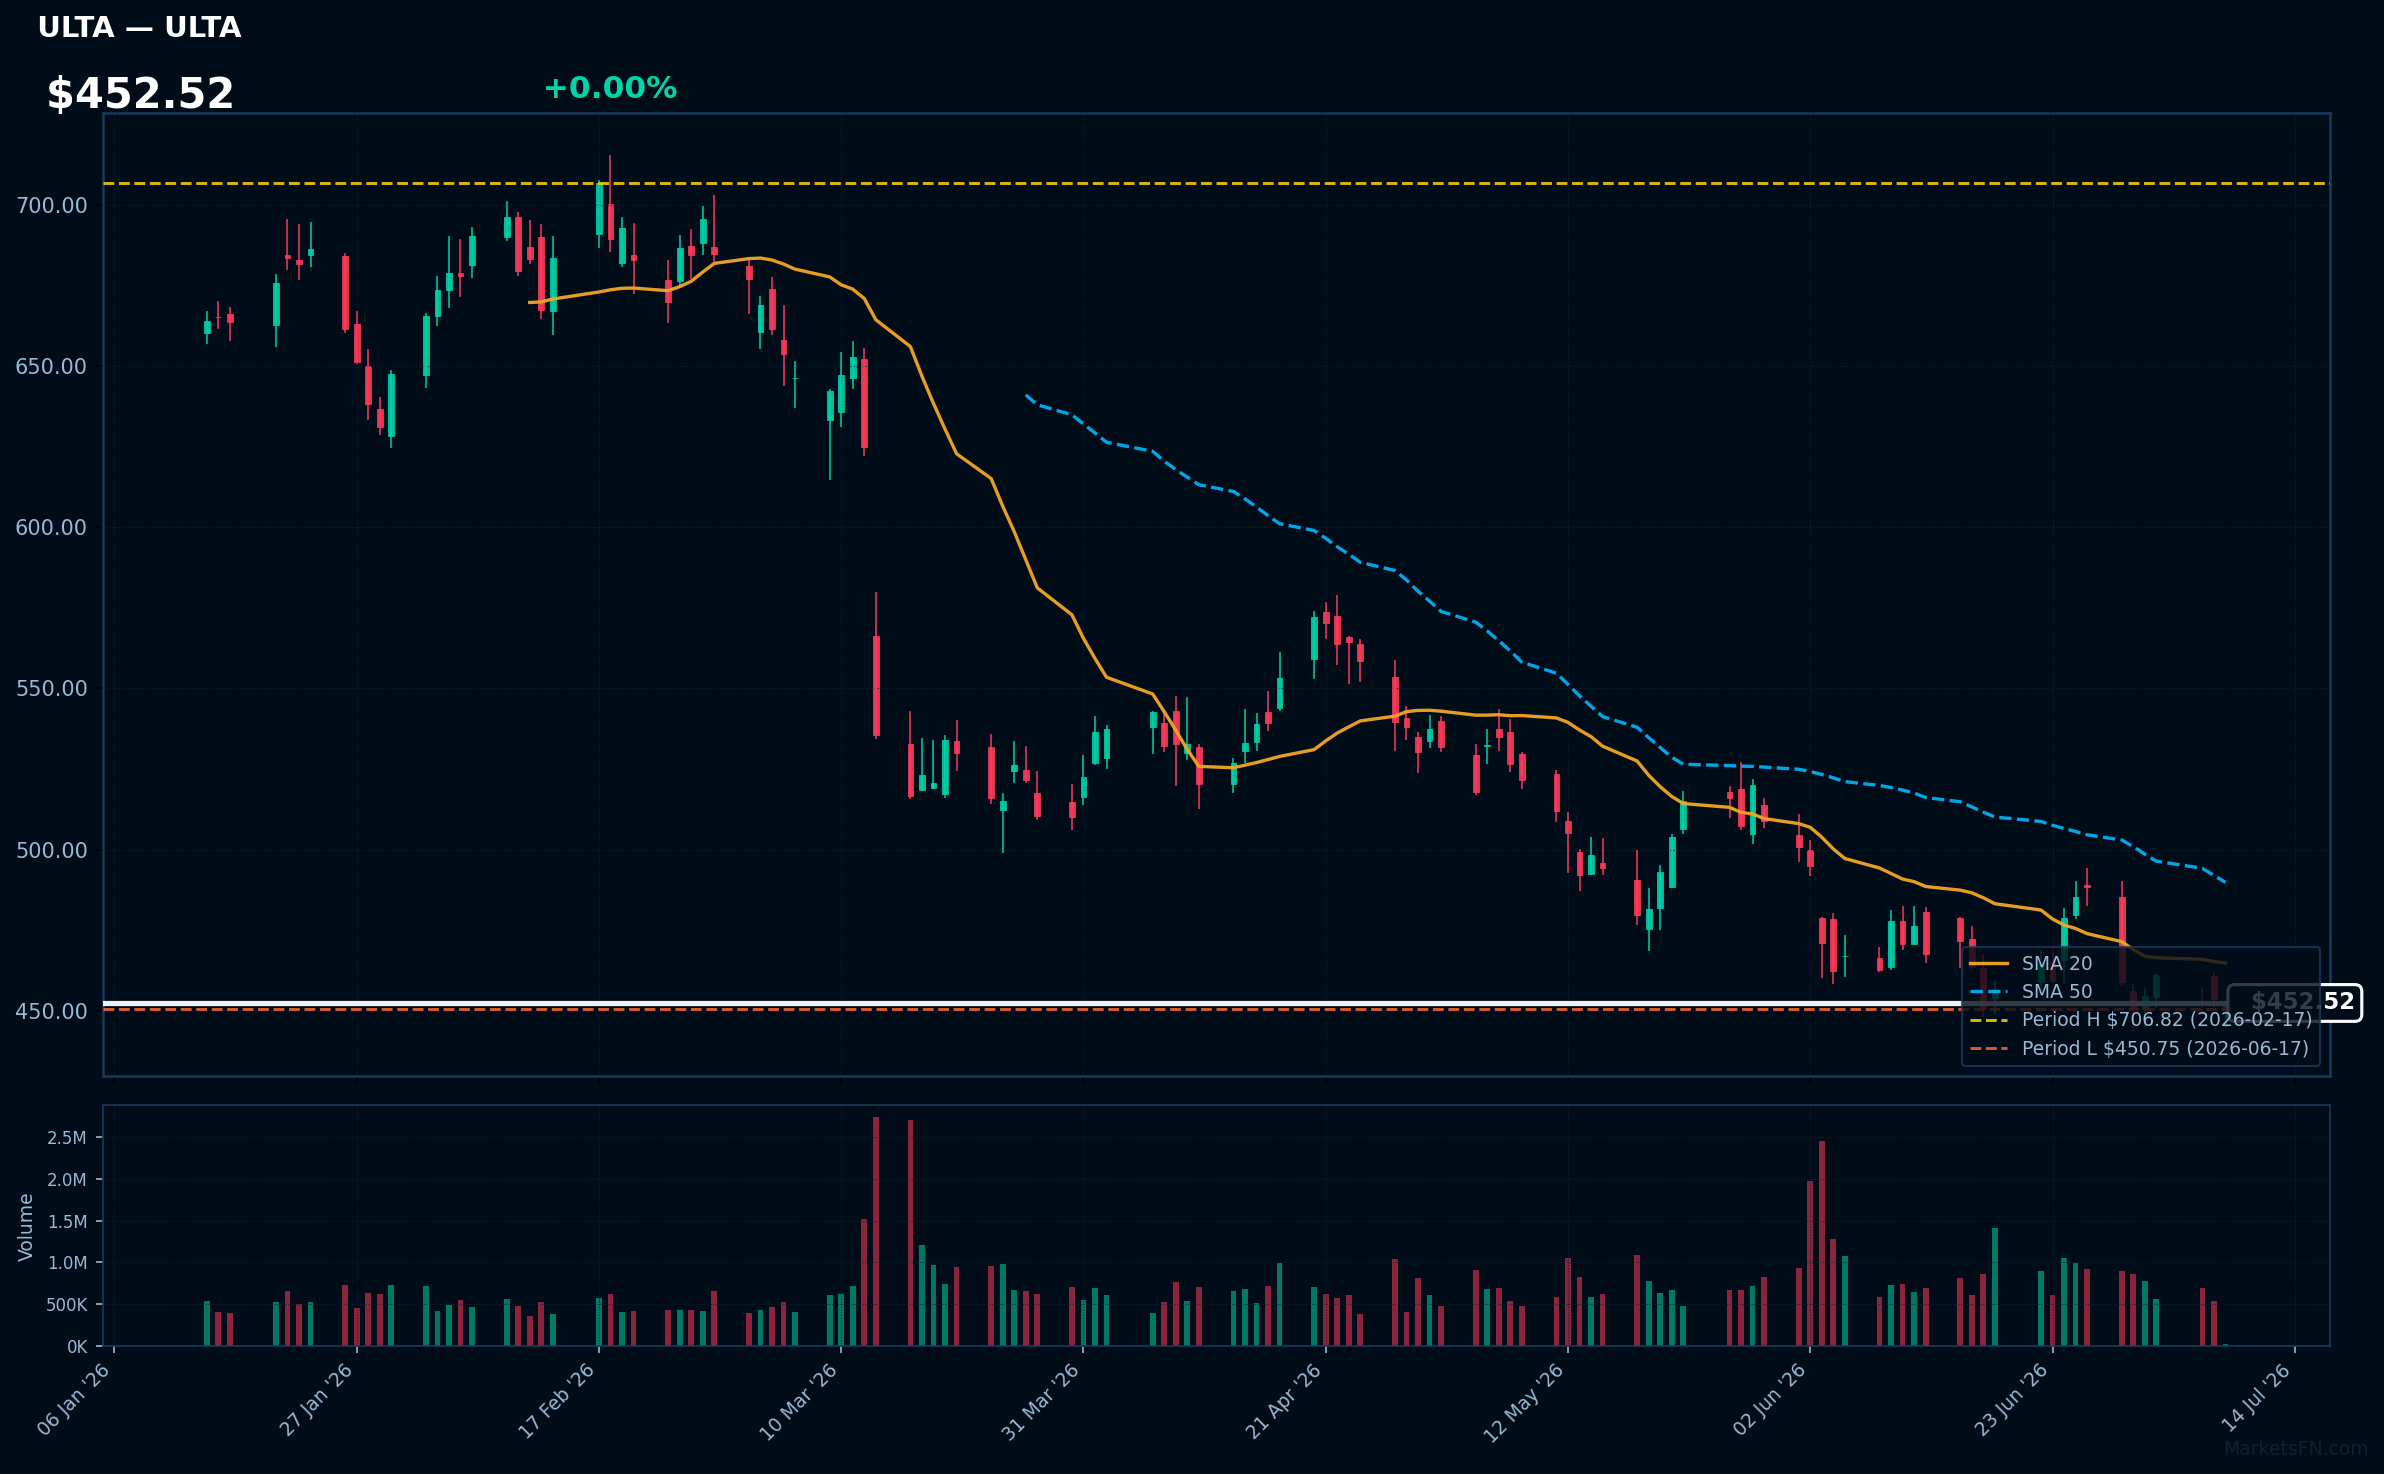
ULTA | Ulta Beauty Inc | Consumer Cyclical | Price Last: $452.11 | % Realized: -6.44% | RSI: 41.0 | % above MA200: -19.3% | Trend: Below MA20, MA50, MA200
Ulta Beauty Inc operates as a beauty retailer, offering a wide range of cosmetics, skincare, and fragrances. Investors should care because its performance reflects consumer spending habits and trends in the beauty industry.
Ulta Beauty Inc's technicals indicate a sustained downtrend with price ($452.52) below MA20, MA50, and MA200. RSI(14) is 41.0, nearing oversold territory. The stock is 0.3% above its 52-Week low, testing major support, and has returned -6.4% over the 52-Week period.
Related headlines
- Target to replace Ulta shops in 600+ stores with its in-house Beauty Studio
- Bath & Body Works Ulta Beauty launch may expand reach, but channel shift risks remain: Jefferies
- Ulta Beauty CMO on Evolving a 47 Million-Member Loyalty Program into a Relationship Engine
- Bath & Body Works is bringing its products to 600 Ulta Beauty stores
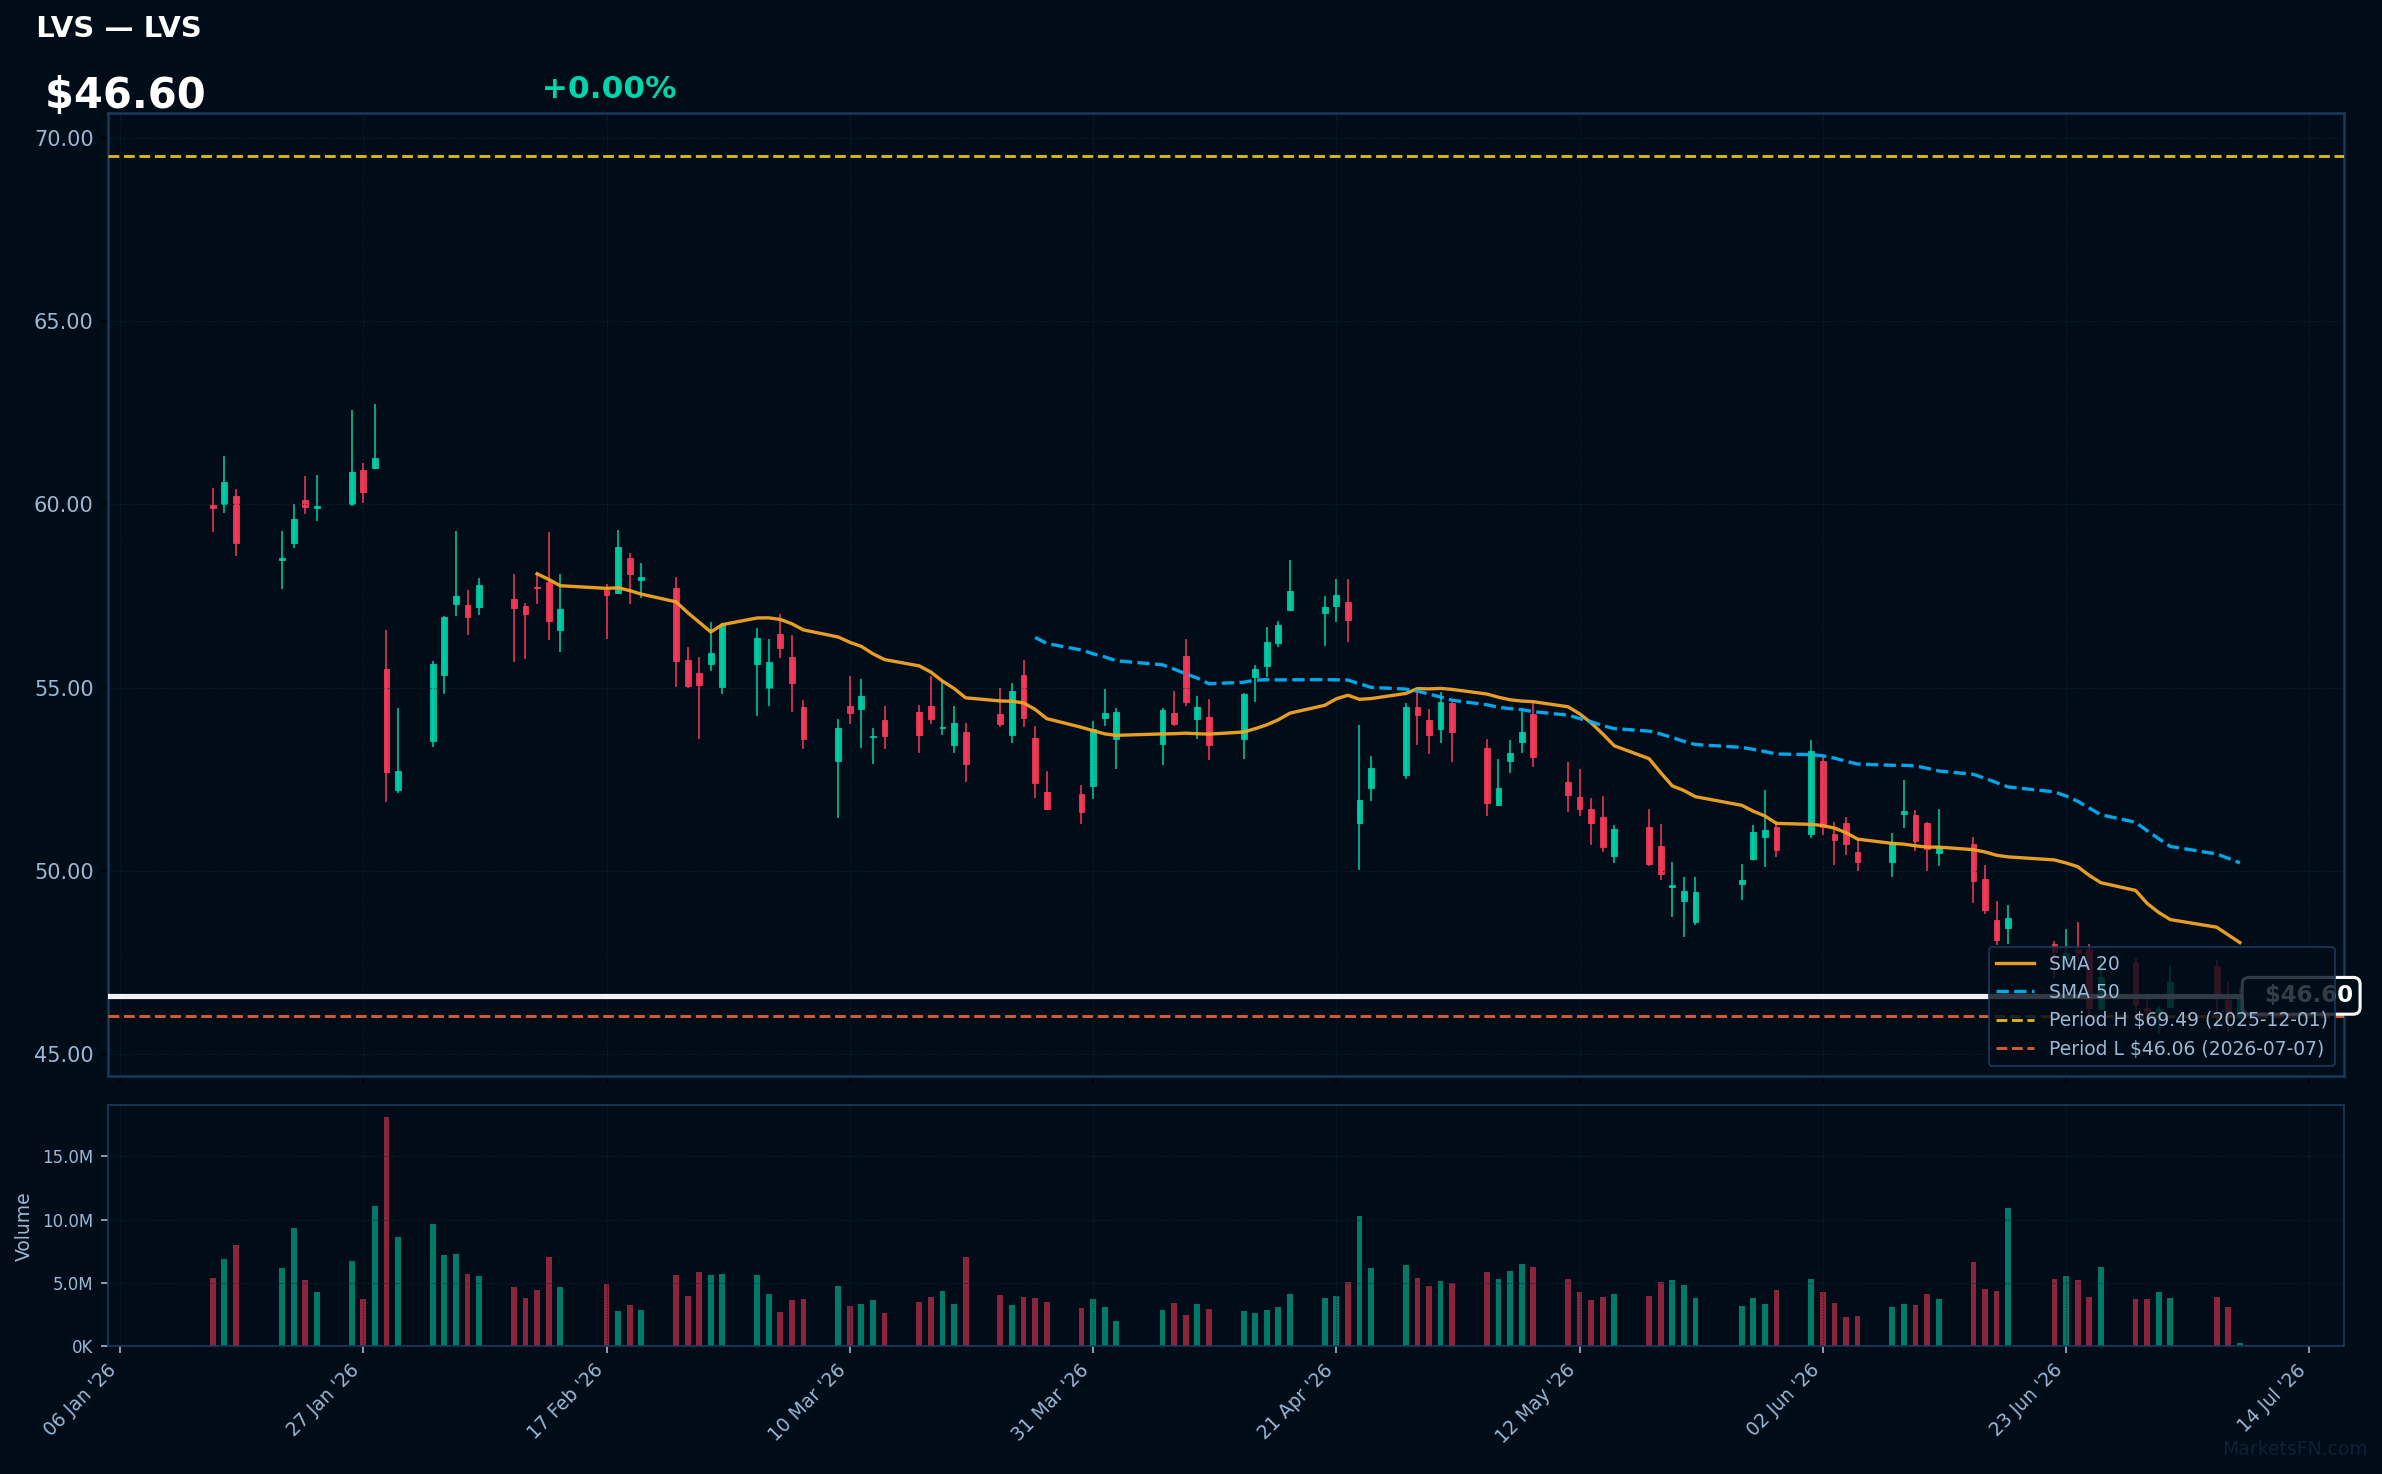
LVS | Las Vegas Sands Corp | Consumer Cyclical | Price Last: $46.65 | % Realized: -5.01% | RSI: 38.7 | % above MA200: -17.2% | Trend: Below MA20, MA50, MA200
Las Vegas Sands Corp operates integrated resorts, including casinos and entertainment venues, generating revenue primarily from gaming and hospitality services. Investors should care about its performance as it reflects demand for luxury entertainment and travel.
The stock is in a sustained downtrend with price ($46.60) below MA20, MA50, and MA200. RSI(14) is 38.7, nearing oversold territory, and is 1.3% above its 52-Week low, indicating potential support testing.
Related headlines
- Las Vegas Sands Continues its Commitment to Ending Youth Homelessness in Nevada with a $300,000 Donation to Nevada Partnership for Homeless Youth
- Las Vegas Sands Donates $150,000 to The LGBTQ+ Center of Las Vegas for a Workforce Development Program Supporting Housing-Insecure Youth
- MGMs $18B Bid Proves Las Vegas Sands Is Undervalued
- Las Vegas Sands Continues on the Dow Jones Best-in-Class Indices for World and North America
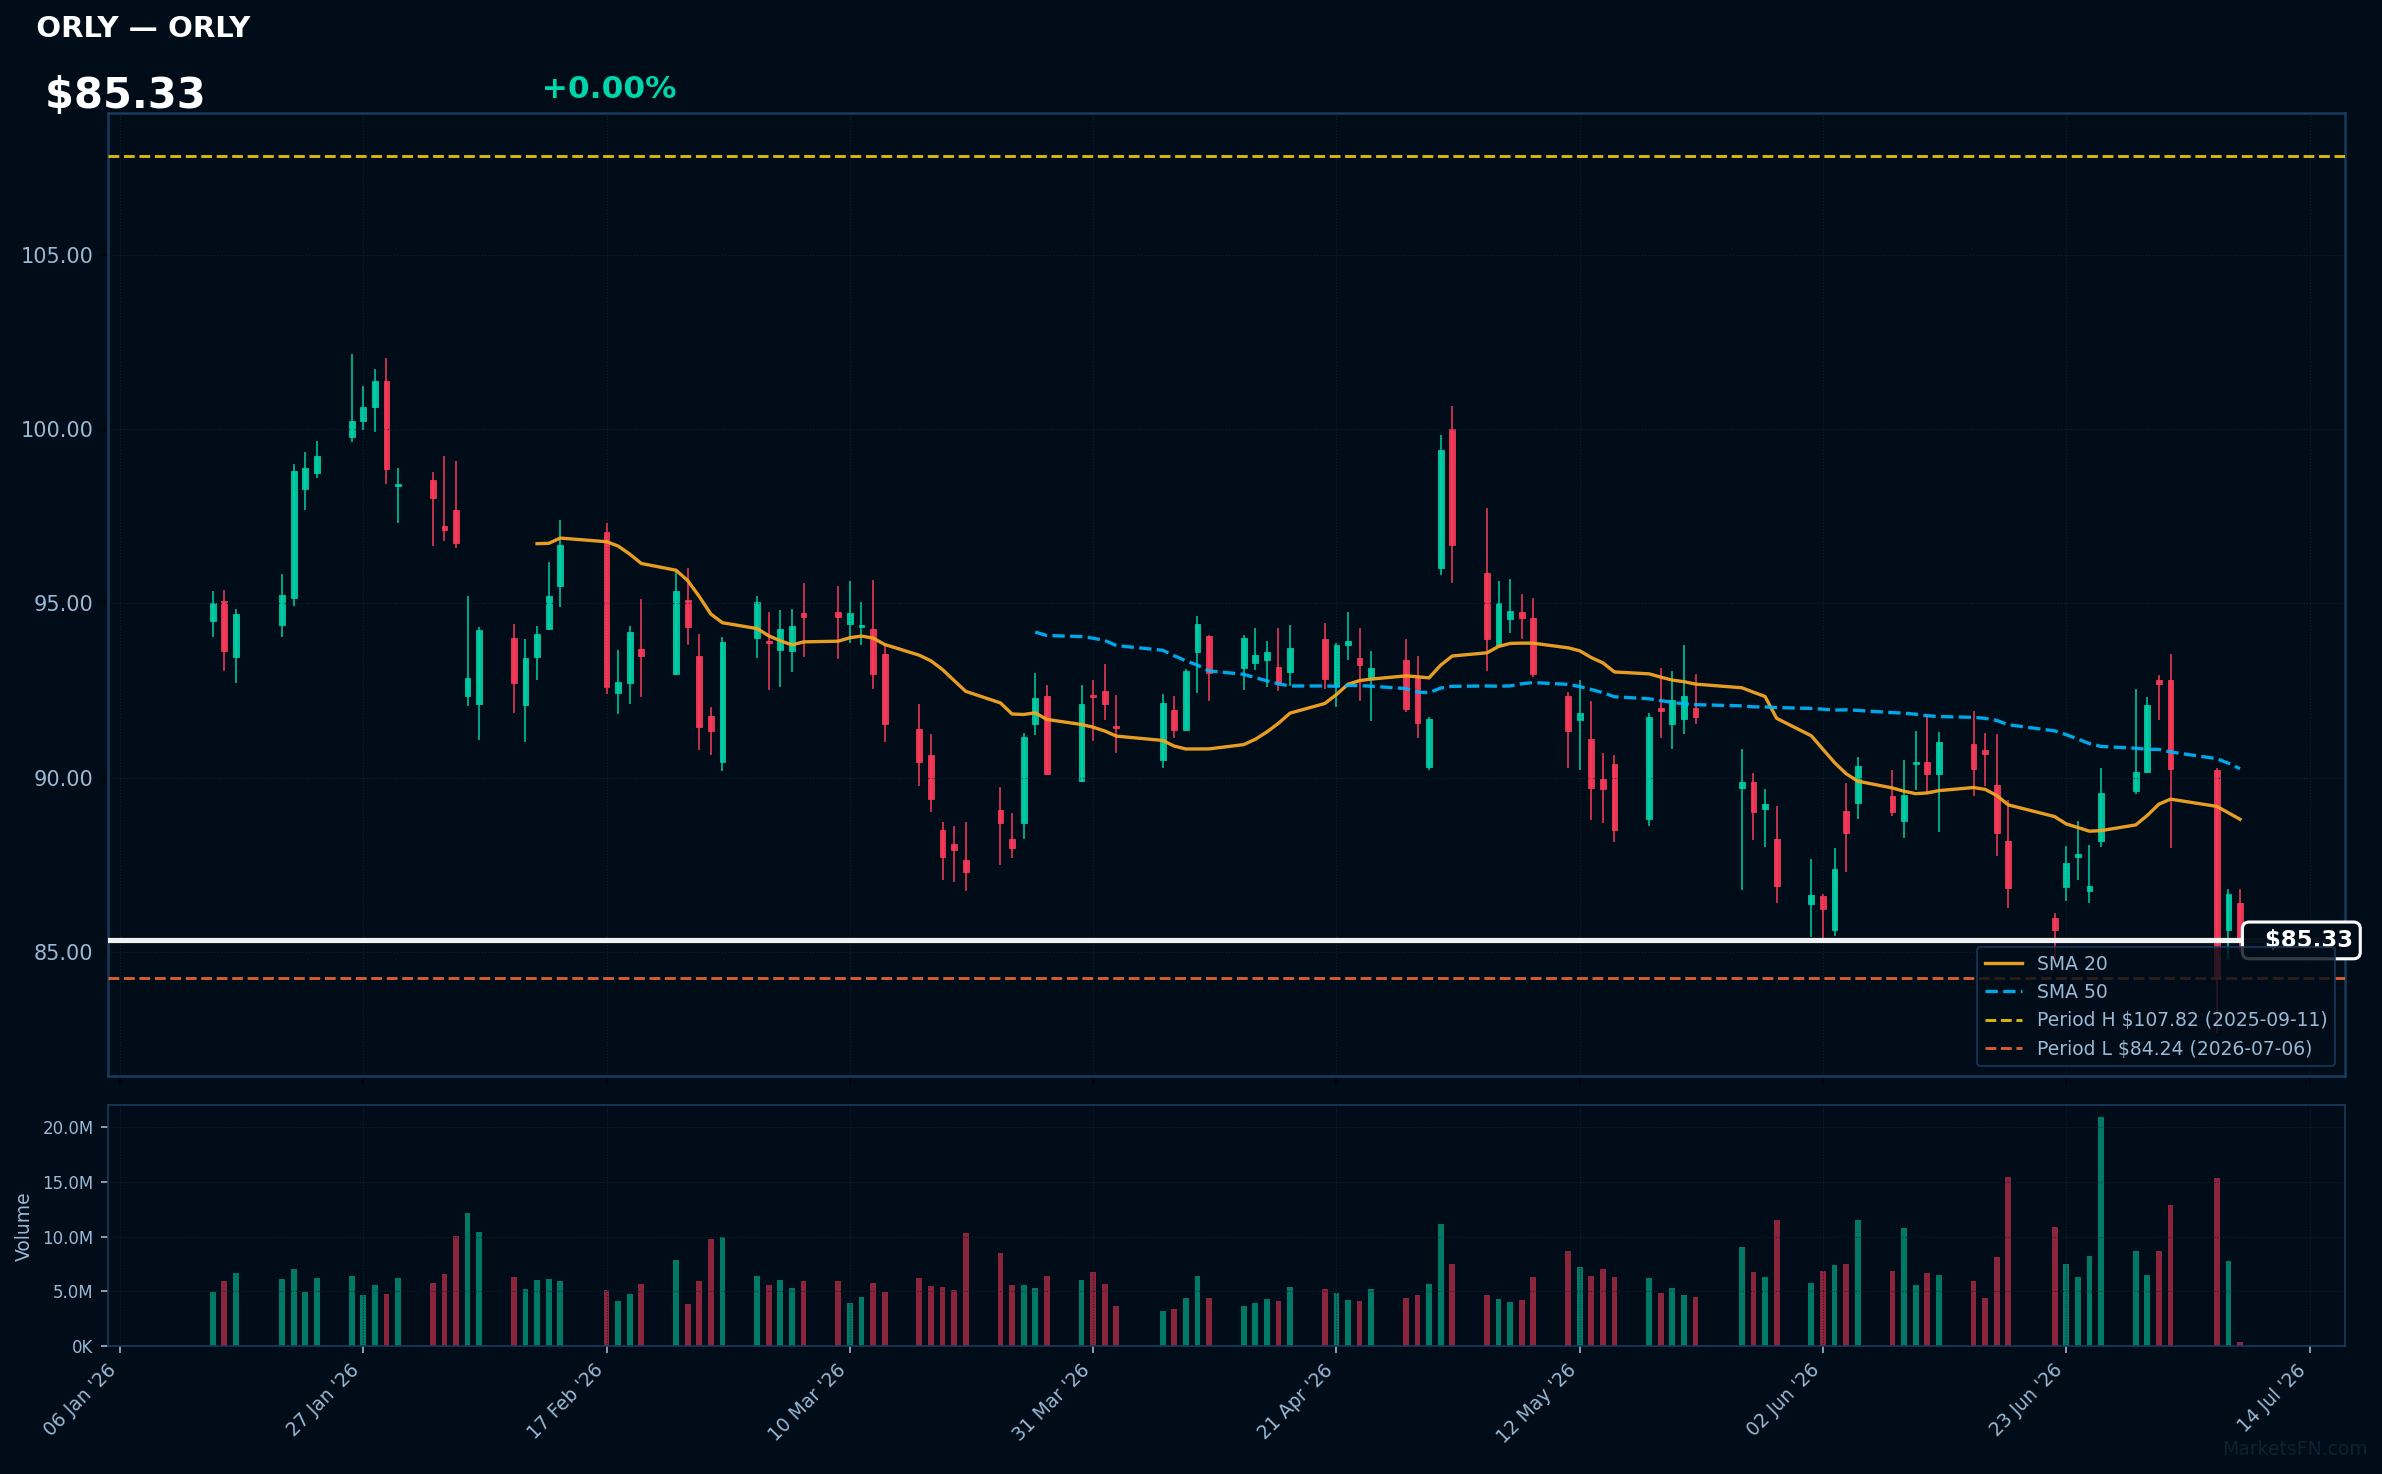
ORLY | O'Reilly Automotive, Inc | Consumer Cyclical | Price Last: $85.37 | % Realized: -6.84% | RSI: 41.6 | % above MA200: -9.7% | Trend: Below MA20, MA50, MA200
O'Reilly Automotive, Inc (ORLY) operates a network of retail stores selling automotive aftermarket parts, tools, and supplies. Investors care due to its market share and exposure to the large and relatively stable automotive repair industry.
ORLY's technicals indicate a sustained downtrend with price ($85.33) below MA20, MA50, and MA200. RSI(14) is 41.6, nearing oversold territory. The stock is 1.3% above its 52-Week low, testing major support, with a -6.8% 52-Week return, signaling potential further downside.
Related headlines
- Why Did REE, HTZ, ORLY Stocks Slump To 52-Week Lows Today?
- O'Reilly Stock Sinks on Report of Possible NAPA Bid
- GPC Stock Pops 13%, ORLY Falls 5% OReilly Makes Cash Bid For Genuine Parts $10B Auto Unit, Says Report
- O'Reilly Automotive, Inc. Announces Dates for Its Second Quarter 2026 Earnings Release and Conference Call
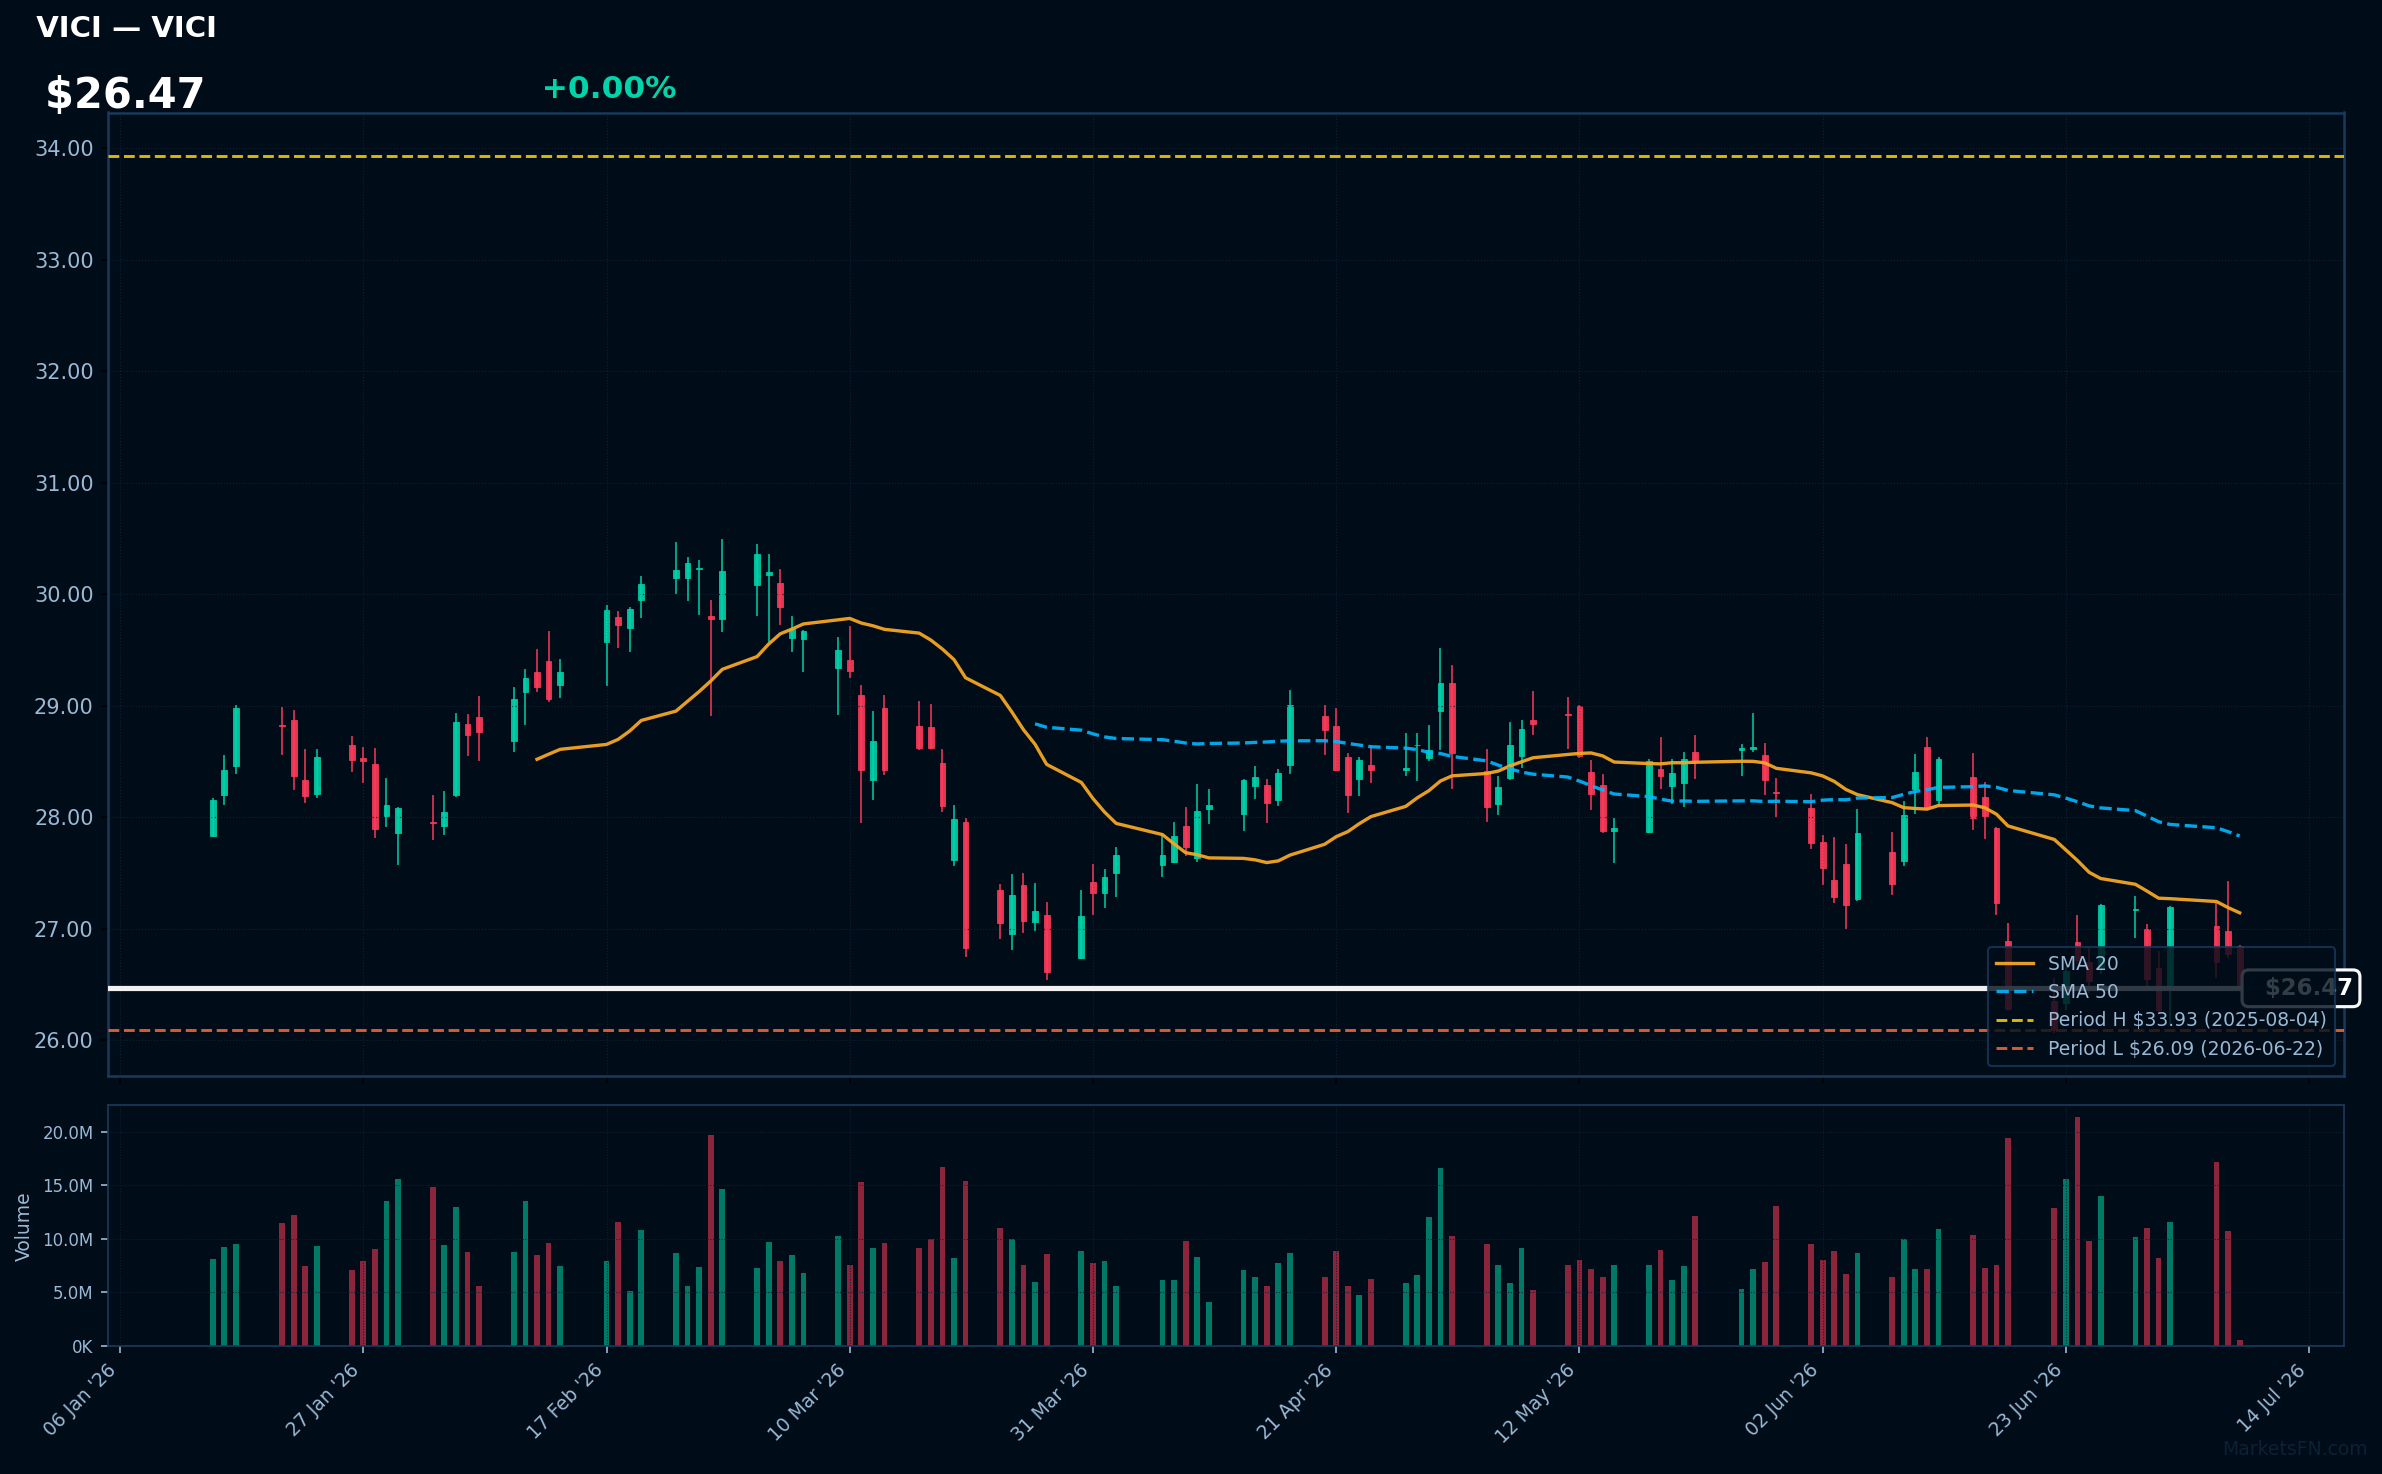
VICI | VICI Properties Inc | Real Estate | Price Last: $26.51 | % Realized: -19.69% | RSI: 42.4 | % above MA200: -8.2% | Trend: Below MA20, MA50, MA200
VICI Properties Inc is a real estate investment trust (REIT) that owns and acquires entertainment, hospitality, and gaming properties. Investors should care because its performance is tied to the recovery and growth of these industries.
VICI is testing major support with its price 1.6% above its 52-Week low and an RSI(14) of 42.4, indicating a sustained downtrend as price < MA20 < MA50 < MA200, potentially a warning sign for further decline.
Related headlines
- VICI Properties Inc. Announces Release Date for Second Quarter 2026 Results
- VICI Properties Inc. Completes Sale-Leaseback of Canadian Portfolio in Connection With Pure Casino Entertainment's Acquisition of Gamehost
- VICI Properties and Club Med Announce Acquisition and Redevelopment of Carambola Beach Resort in St. Croix
- CLUB MED ADVANCES STRATEGIC NORTH AMERICAN EXPANSION WITH THE REDEVELOPMENT OF CARAMBOLA BEACH RESORT IN ST. CROIX IN PARTNERSHIP WITH VICI PROPERTIES
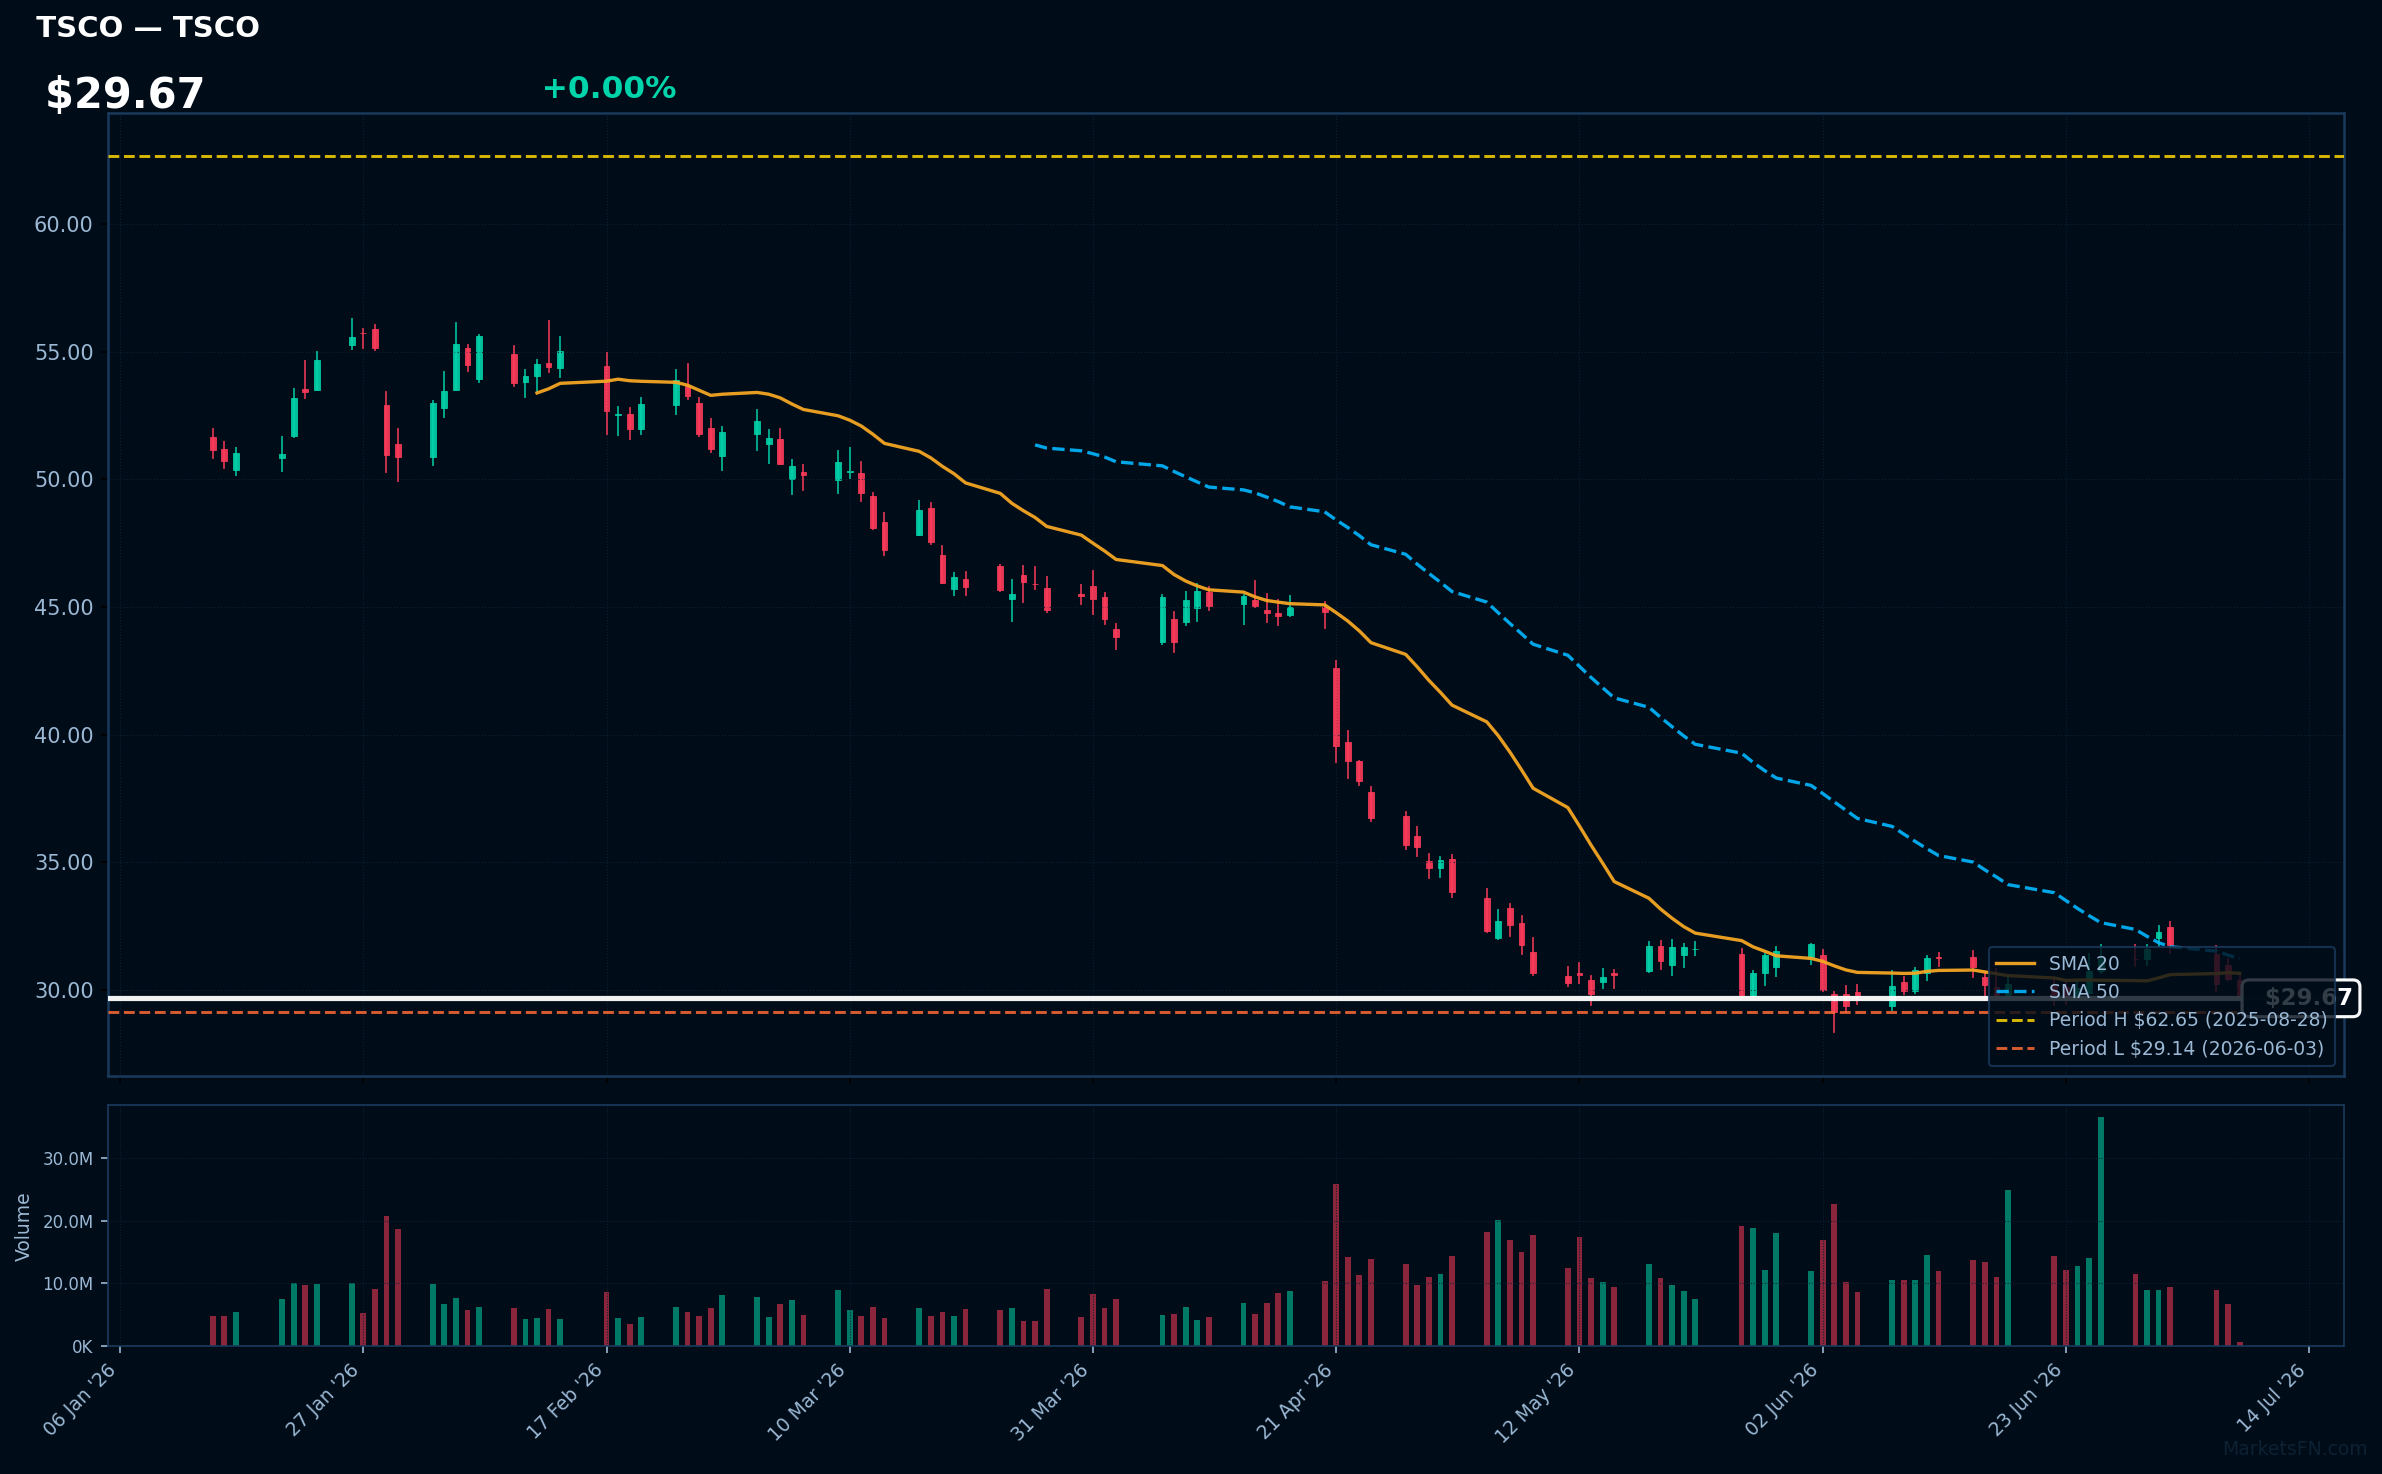
TSCO | Tractor Supply Co | Consumer Cyclical | Price Last: $29.65 | % Realized: -47.78% | RSI: 40.4 | % above MA200: -36.3% | Trend: Below MA20, MA50, MA200
Tractor Supply Co is a rural lifestyle retailer selling products for farming, pets, and outdoor living. Investors should care because its performance reflects rural consumer spending and agricultural industry trends.
Tractor Supply Co's technicals indicate a sustained downtrend with price ($29.67) below MA20, MA50, and MA200. RSI(14) is 40.4, nearing oversold territory. The stock is 1.7% above its 52-Week low, testing major support after a -47.8% 52-Week return.
Related headlines
- Tractor Supply's Weak Pet Business Is Hiding Its Long-Term Growth Potential
- Tractor Supply and 4-H Collaborate With Starlink to Bridge the Digital Divide in Rural Communities
- Tractor Supply Gears up for a Star-Spangled Fourth of July With Special Offers, Giveaways and a Full Assortment of Americana Items
- Tractor Supply Celebrates Fathers Day With Practical, Project-Ready Gifts, Exclusive Deals and a Free In-Store Family Event
Market Commentary
The S&P 500 stocks listed are currently near 52-week extremes, with some at all-time highs and others at yearly lows. Stocks at 52-week highs include KO, UNH, CVS, MPC, and D, all exactly at their 52-week highs. Conversely, ULTA, LVS, ORLY, VICI, and TSCO are near their 52-week lows, but slightly above them. This indicates a divergence in market performance among S&P 500 constituents.
The stocks at 52-week highs are primarily from the consumer staples, healthcare, and energy sectors, suggesting a rotation towards defensive and essential services. In contrast, those near 52-week lows are from consumer discretionary and leisure sectors, potentially indicating a cautious outlook on consumer spending. Macro themes such as economic stability and sector-specific growth drivers may be influencing these price levels.
Key levels to watch include the 52-week highs for KO, UNH, CVS, MPC, and D, and the 52-week lows for ULTA, LVS, ORLY, VICI, and TSCO. Potential catalysts for movement away from these extremes could include earnings reports, sector-specific news, and broader economic indicators. Monitoring these levels and catalysts will be crucial for understanding future market direction.
Methodology: All 503 S&P 500 constituents screened. 52-week high = highest daily close over the past 252 trading days (approx. 1 year). 52-week low = lowest daily close over the same period. Distance = (current price / extreme − 1) × 100. Technical indicators computed on up to 1 year of daily OHLCV data.
Disclaimer: For informational purposes only. Not investment advice. Past performance is not indicative of future results.

