Nasdaq 100 52-Week Highs & Lows Radar: Electronic Arts, (EA), O'Reilly Automotive, (ORLY) and more
MarketsFN Team

Nasdaq 100 52-Week Highs & Lows Radar: Electronic Arts, (EA), O'Reilly Automotive, (ORLY) and more
Screening all 101 Nasdaq 100 constituents for stocks nearest to their 52-week high and their 52-week low. Data as of July 08, 2026. % Realized = 52-week total return.
Legend: RSI > 70 = overbought · RSI < 30 = oversold · Green % Realized = positive 52W return · Red = negative.
📈 Nearest to 52-Week High
Sectors represented: Communication Services (1), Utilities (1), Industrials (1), Consumer Defensive (1), Technology (1)
| Ticker | Company | Sector | Price Last | % Realized | 52-Week High Date | RSI | % above MA200 | Trend |
|---|---|---|---|---|---|---|---|---|
| EA | Electronic Arts, Inc | Communication Services | $205.38 | +34.55% | 2026-07-01 | 67.4 | +2.0% | Above MA20, MA50, MA200 |
| AEP | American Electric Power Company Inc | Utilities | $137.64 | +32.40% | 2026-06-26 | 60.6 | +10.5% | Above MA20, MA50, MA200 |
| CSX | CSX Corp | Industrials | $48.47 | +45.16% | 2026-07-02 | 61.7 | +21.2% | Above MA20, MA50, MA200 |
| MNST | Monster Beverage Corp | Consumer Defensive | $96.16 | +56.13% | 2026-06-29 | 63.8 | +23.2% | Above MA20, MA50, MA200 |
| AAPL | Apple Inc | Technology | $309.27 | +47.26% | 2026-06-02 | 59.4 | +13.8% | Above MA20, MA50, MA200 |
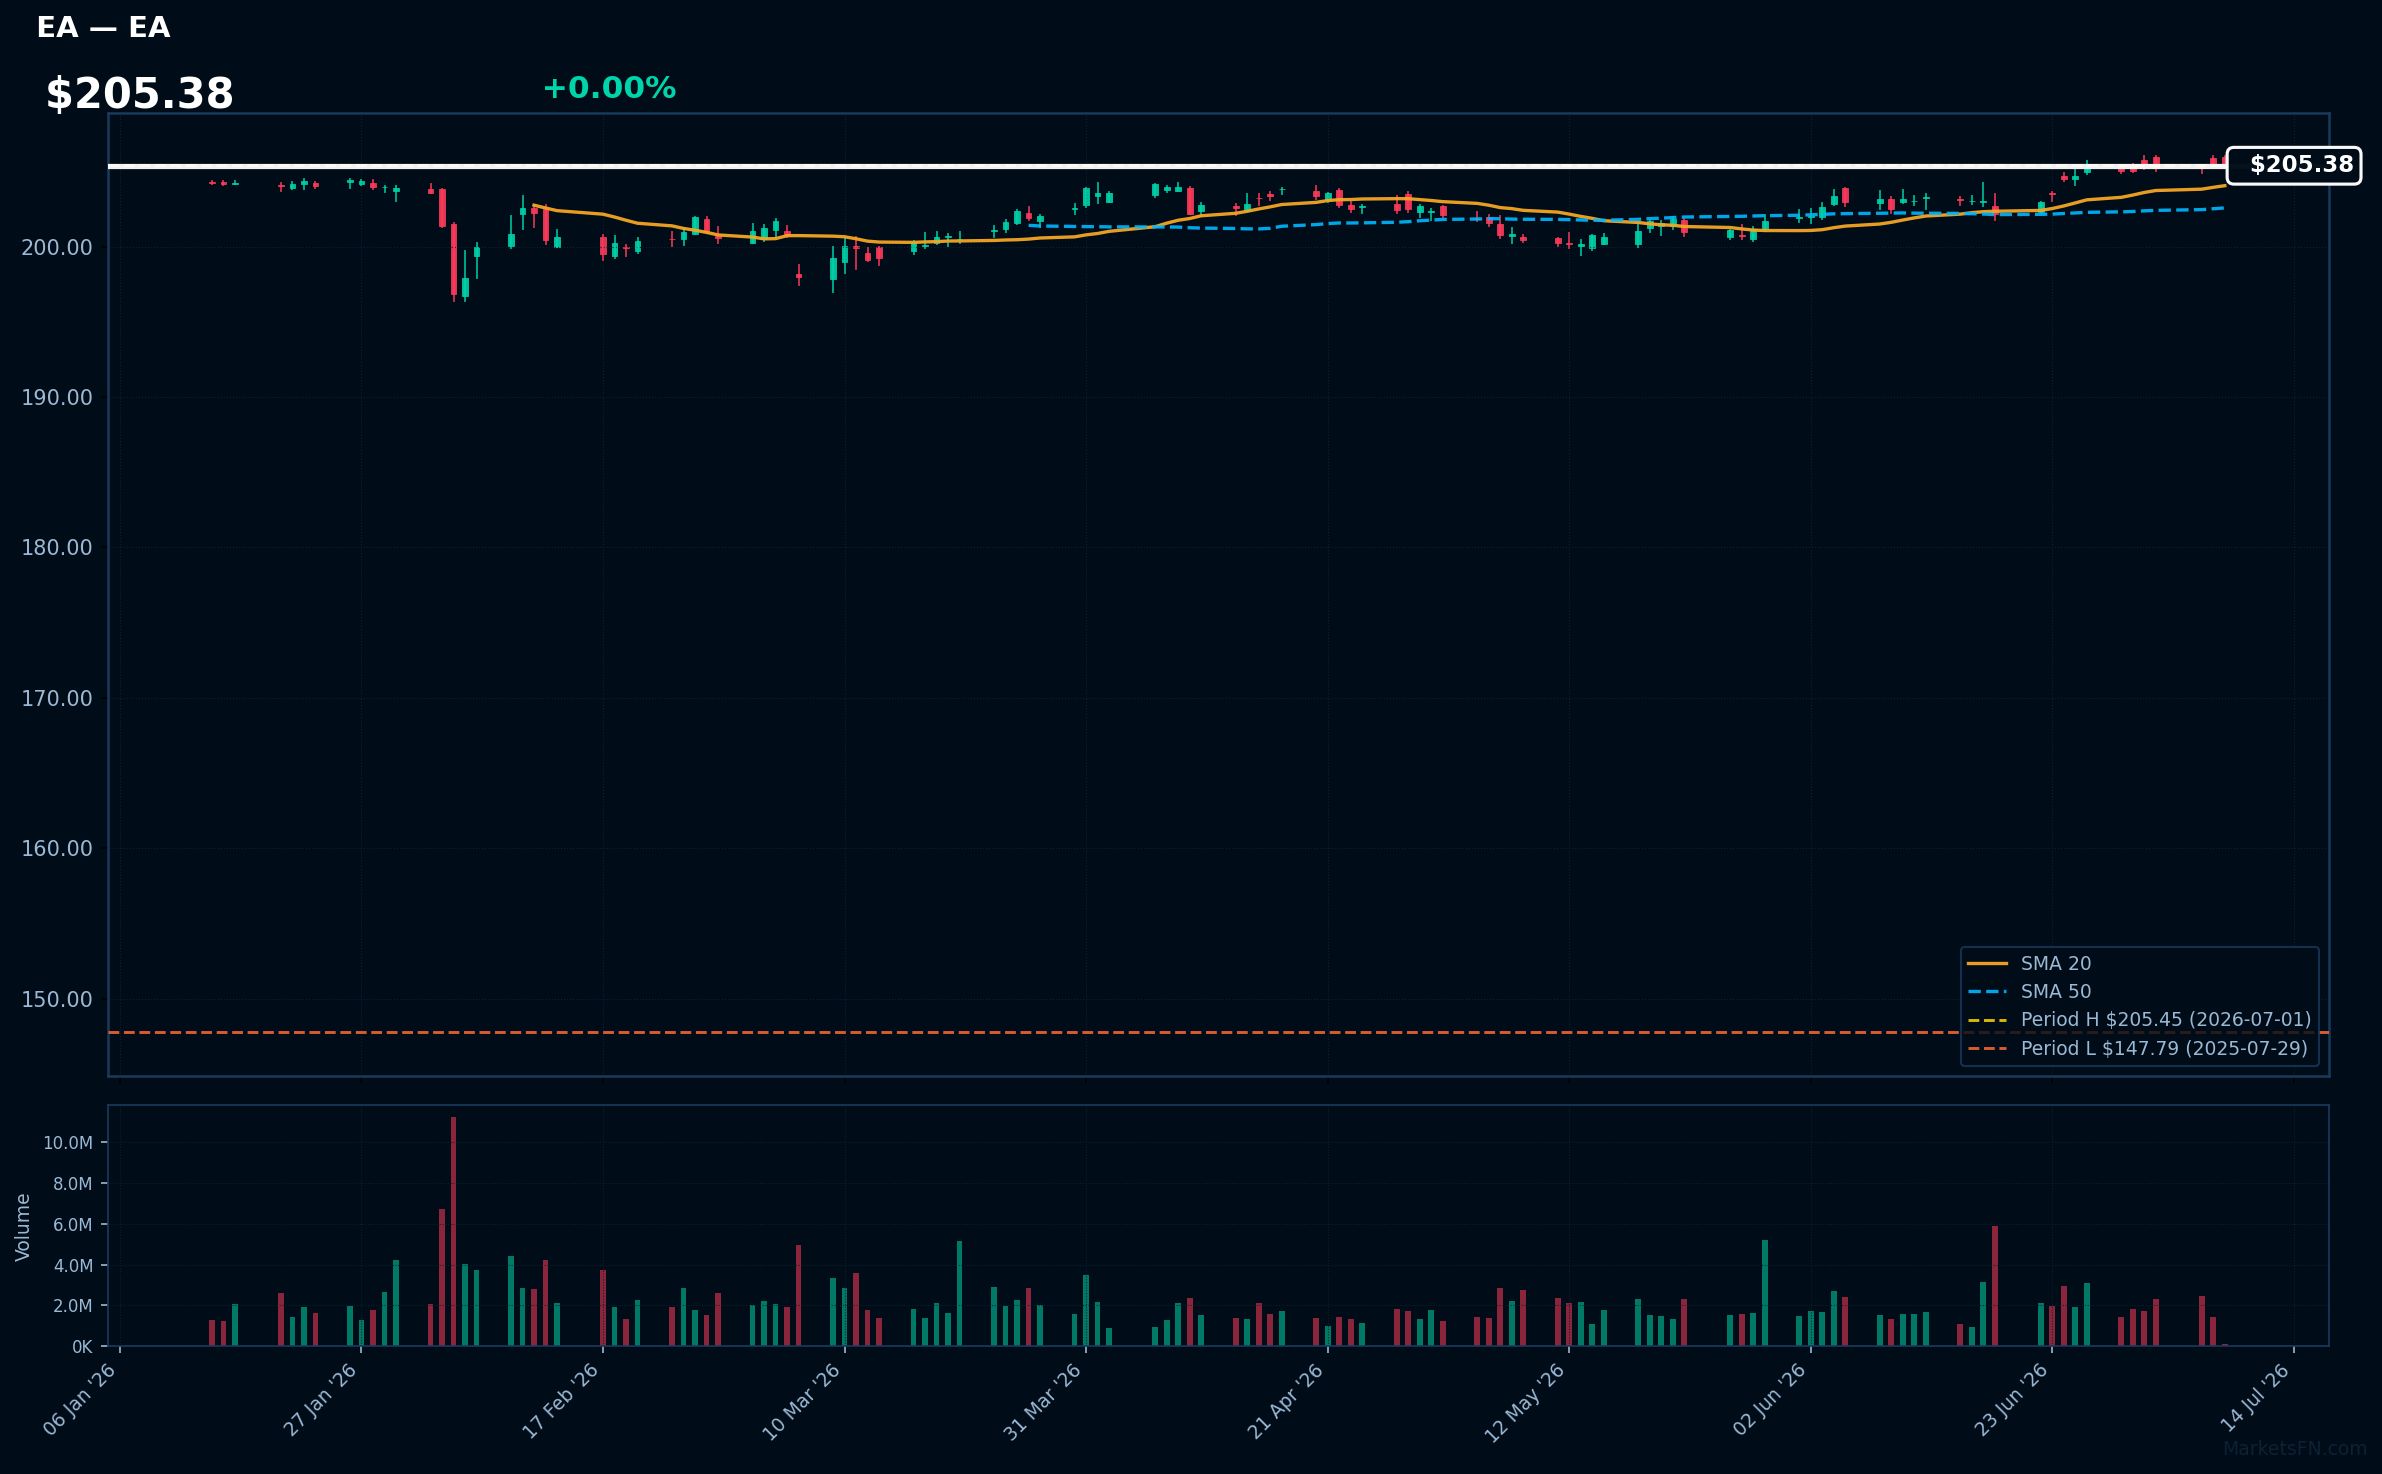
EA | Electronic Arts, Inc | Communication Services | Price Last: $205.38 | % Realized: +34.55% | RSI: 67.4 | % above MA200: +2.0% | Trend: Above MA20, MA50, MA200
Electronic Arts, Inc (EA) is a leading interactive entertainment software company that develops and publishes games such as FIFA, Madden NFL, and The Sims. Investors should care about its performance in the gaming market and its ability to innovate and release successful titles.
EA's current technical situation indicates strong momentum, with an RSI(14) of 67.4 and a bullish MA alignment (price > MA20 > MA50 > MA200), suggesting a sustained uptrend. The stock is 0.0% below its 52-Week high, near a potential breakout level.
Related headlines
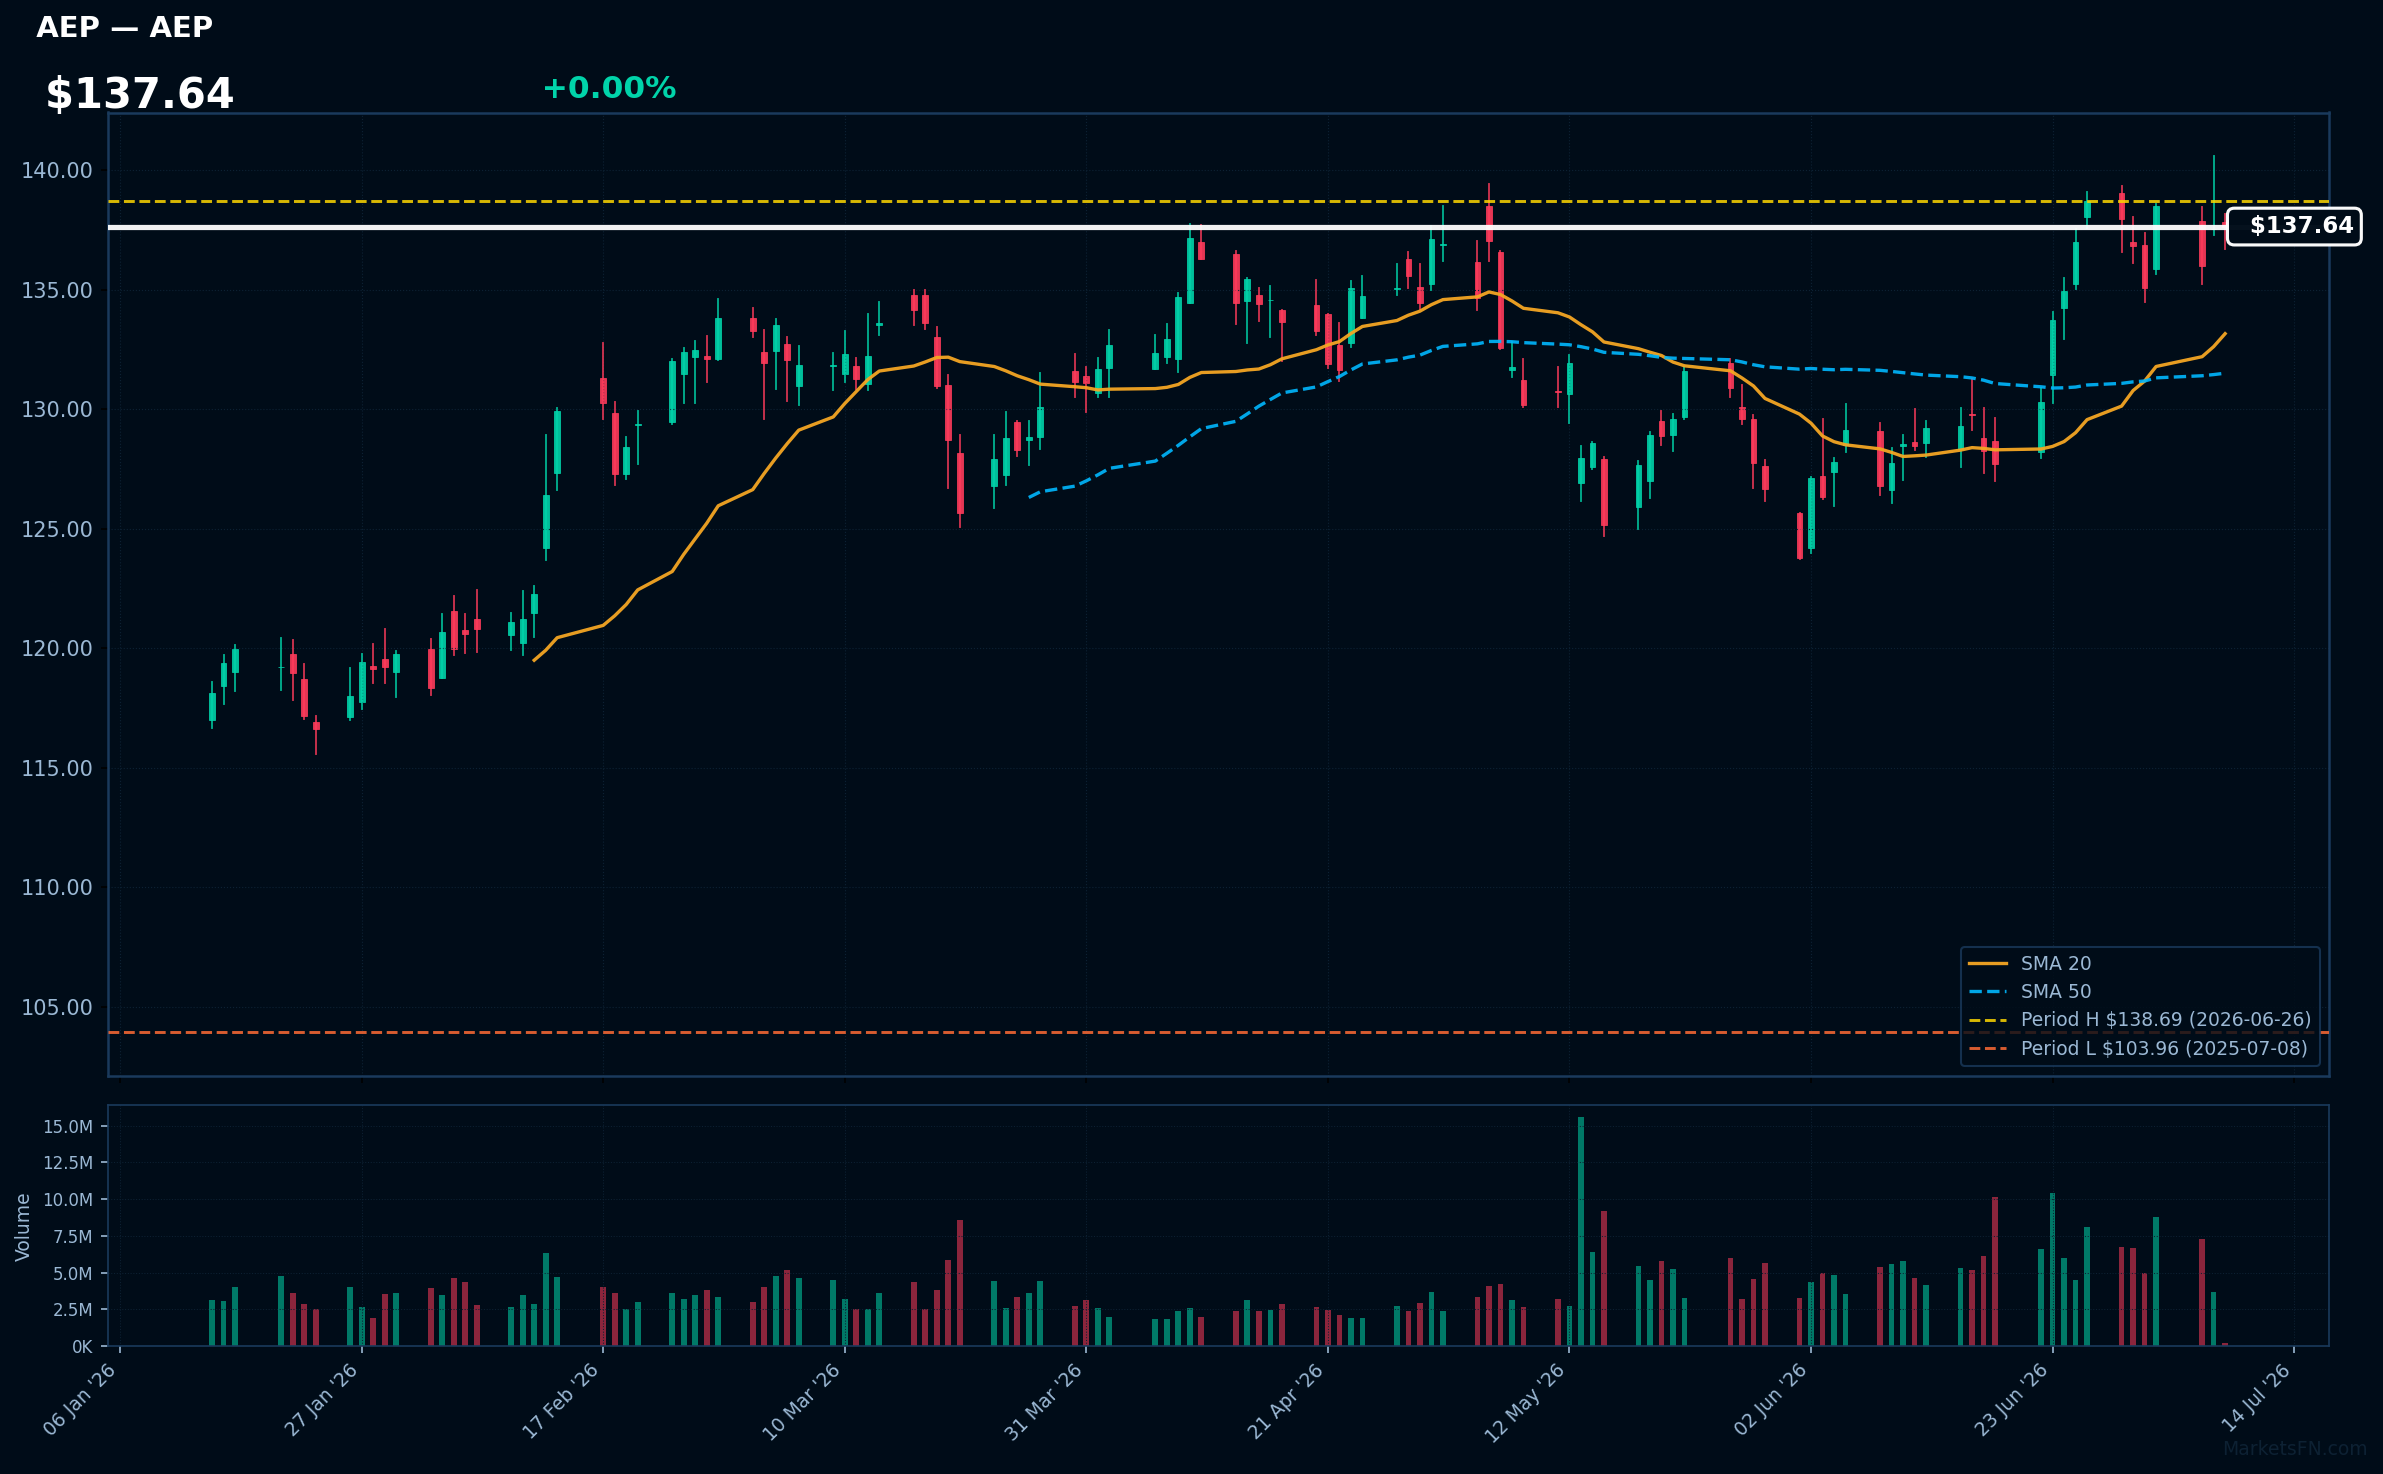
AEP | American Electric Power Company Inc | Utilities | Price Last: $137.64 | % Realized: +32.40% | RSI: 60.6 | % above MA200: +10.5% | Trend: Above MA20, MA50, MA200
American Electric Power Company Inc is a leading electricity provider, generating and distributing electricity across multiple states. Investors should care about its stable returns and potential for growth driven by increasing demand for electricity and infrastructure investments.
AEP's technicals indicate sustained uptrend with price > MA20 > MA50 > MA200, RSI(14) at 60.6, and 0.8% below its 52-Week high, suggesting momentum; the stock has returned 32.4% over the 52-Week period, reinforcing the bullish alignment.
Related headlines
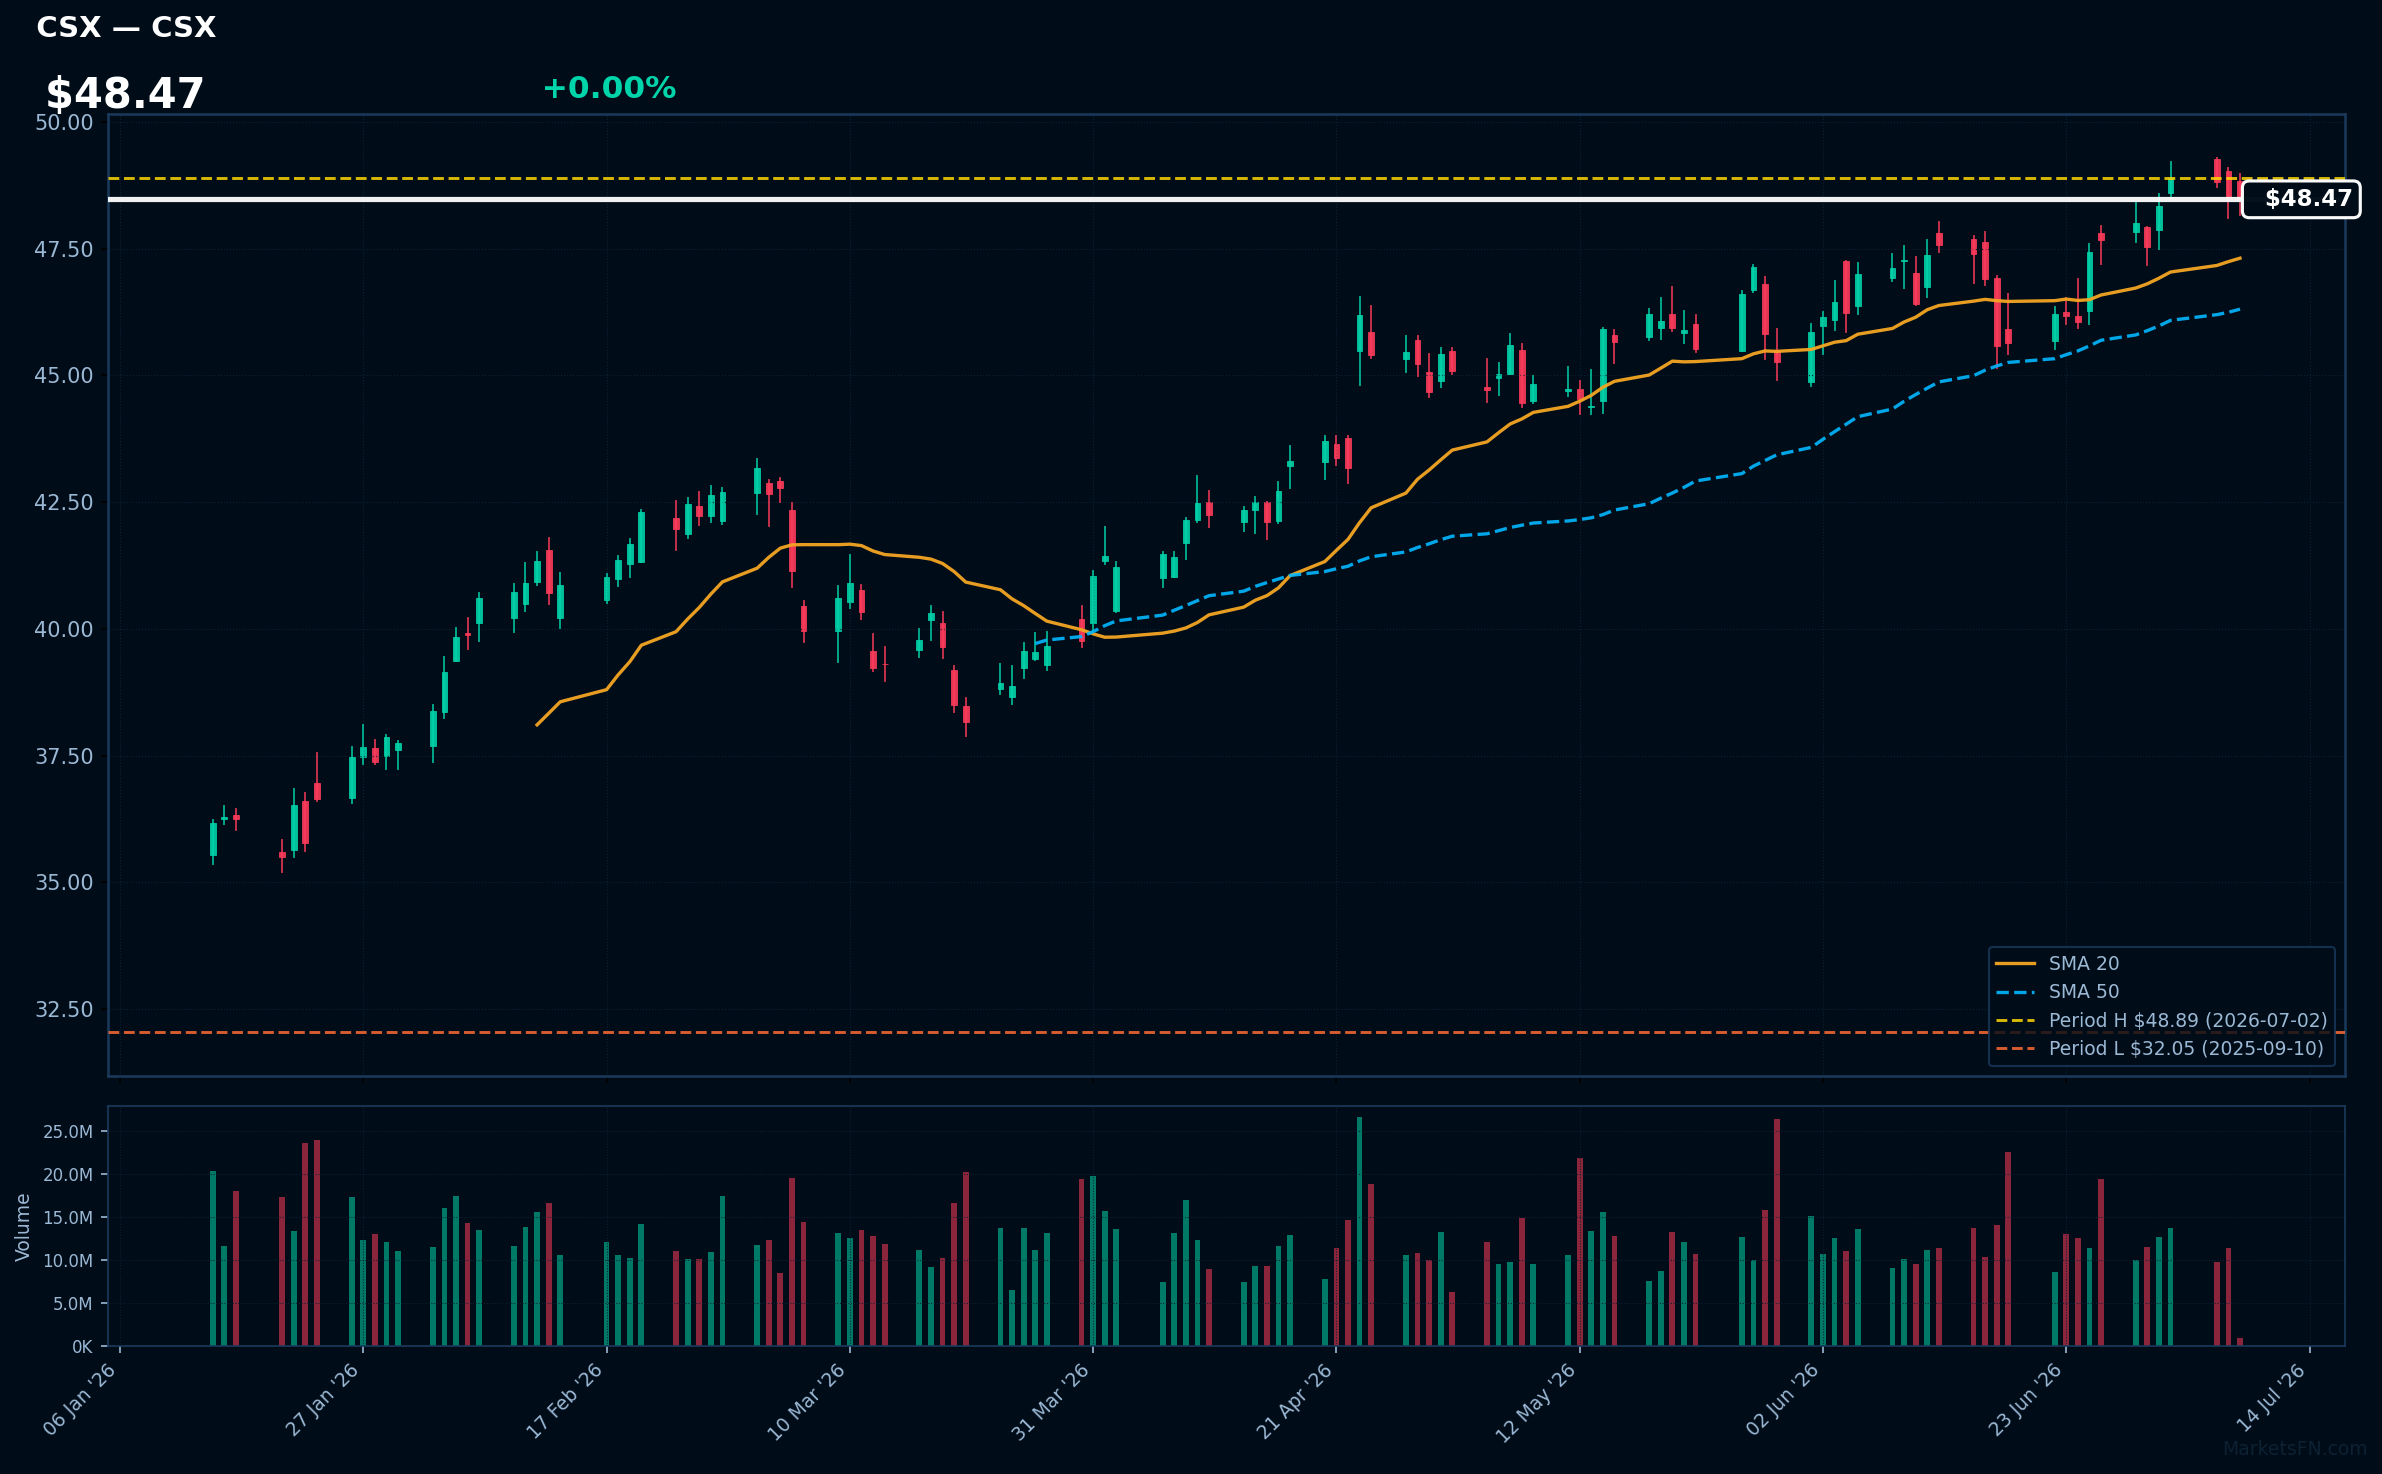
CSX | CSX Corp | Industrials | Price Last: $48.47 | % Realized: +45.16% | RSI: 61.7 | % above MA200: +21.2% | Trend: Above MA20, MA50, MA200
CSX Corp operates a rail network transporting coal, intermodal, and automotive goods, making it a key player in North American freight infrastructure; investors should care due to its critical role in the supply chain and potential for steady cash flows.
CSX Corp's technicals indicate momentum, with RSI(14) at 61.7, a bullish MA alignment (price > MA20 > MA50 > MA200), and the stock 0.9% below its 52-Week high, suggesting a potential breakout.
Related headlines
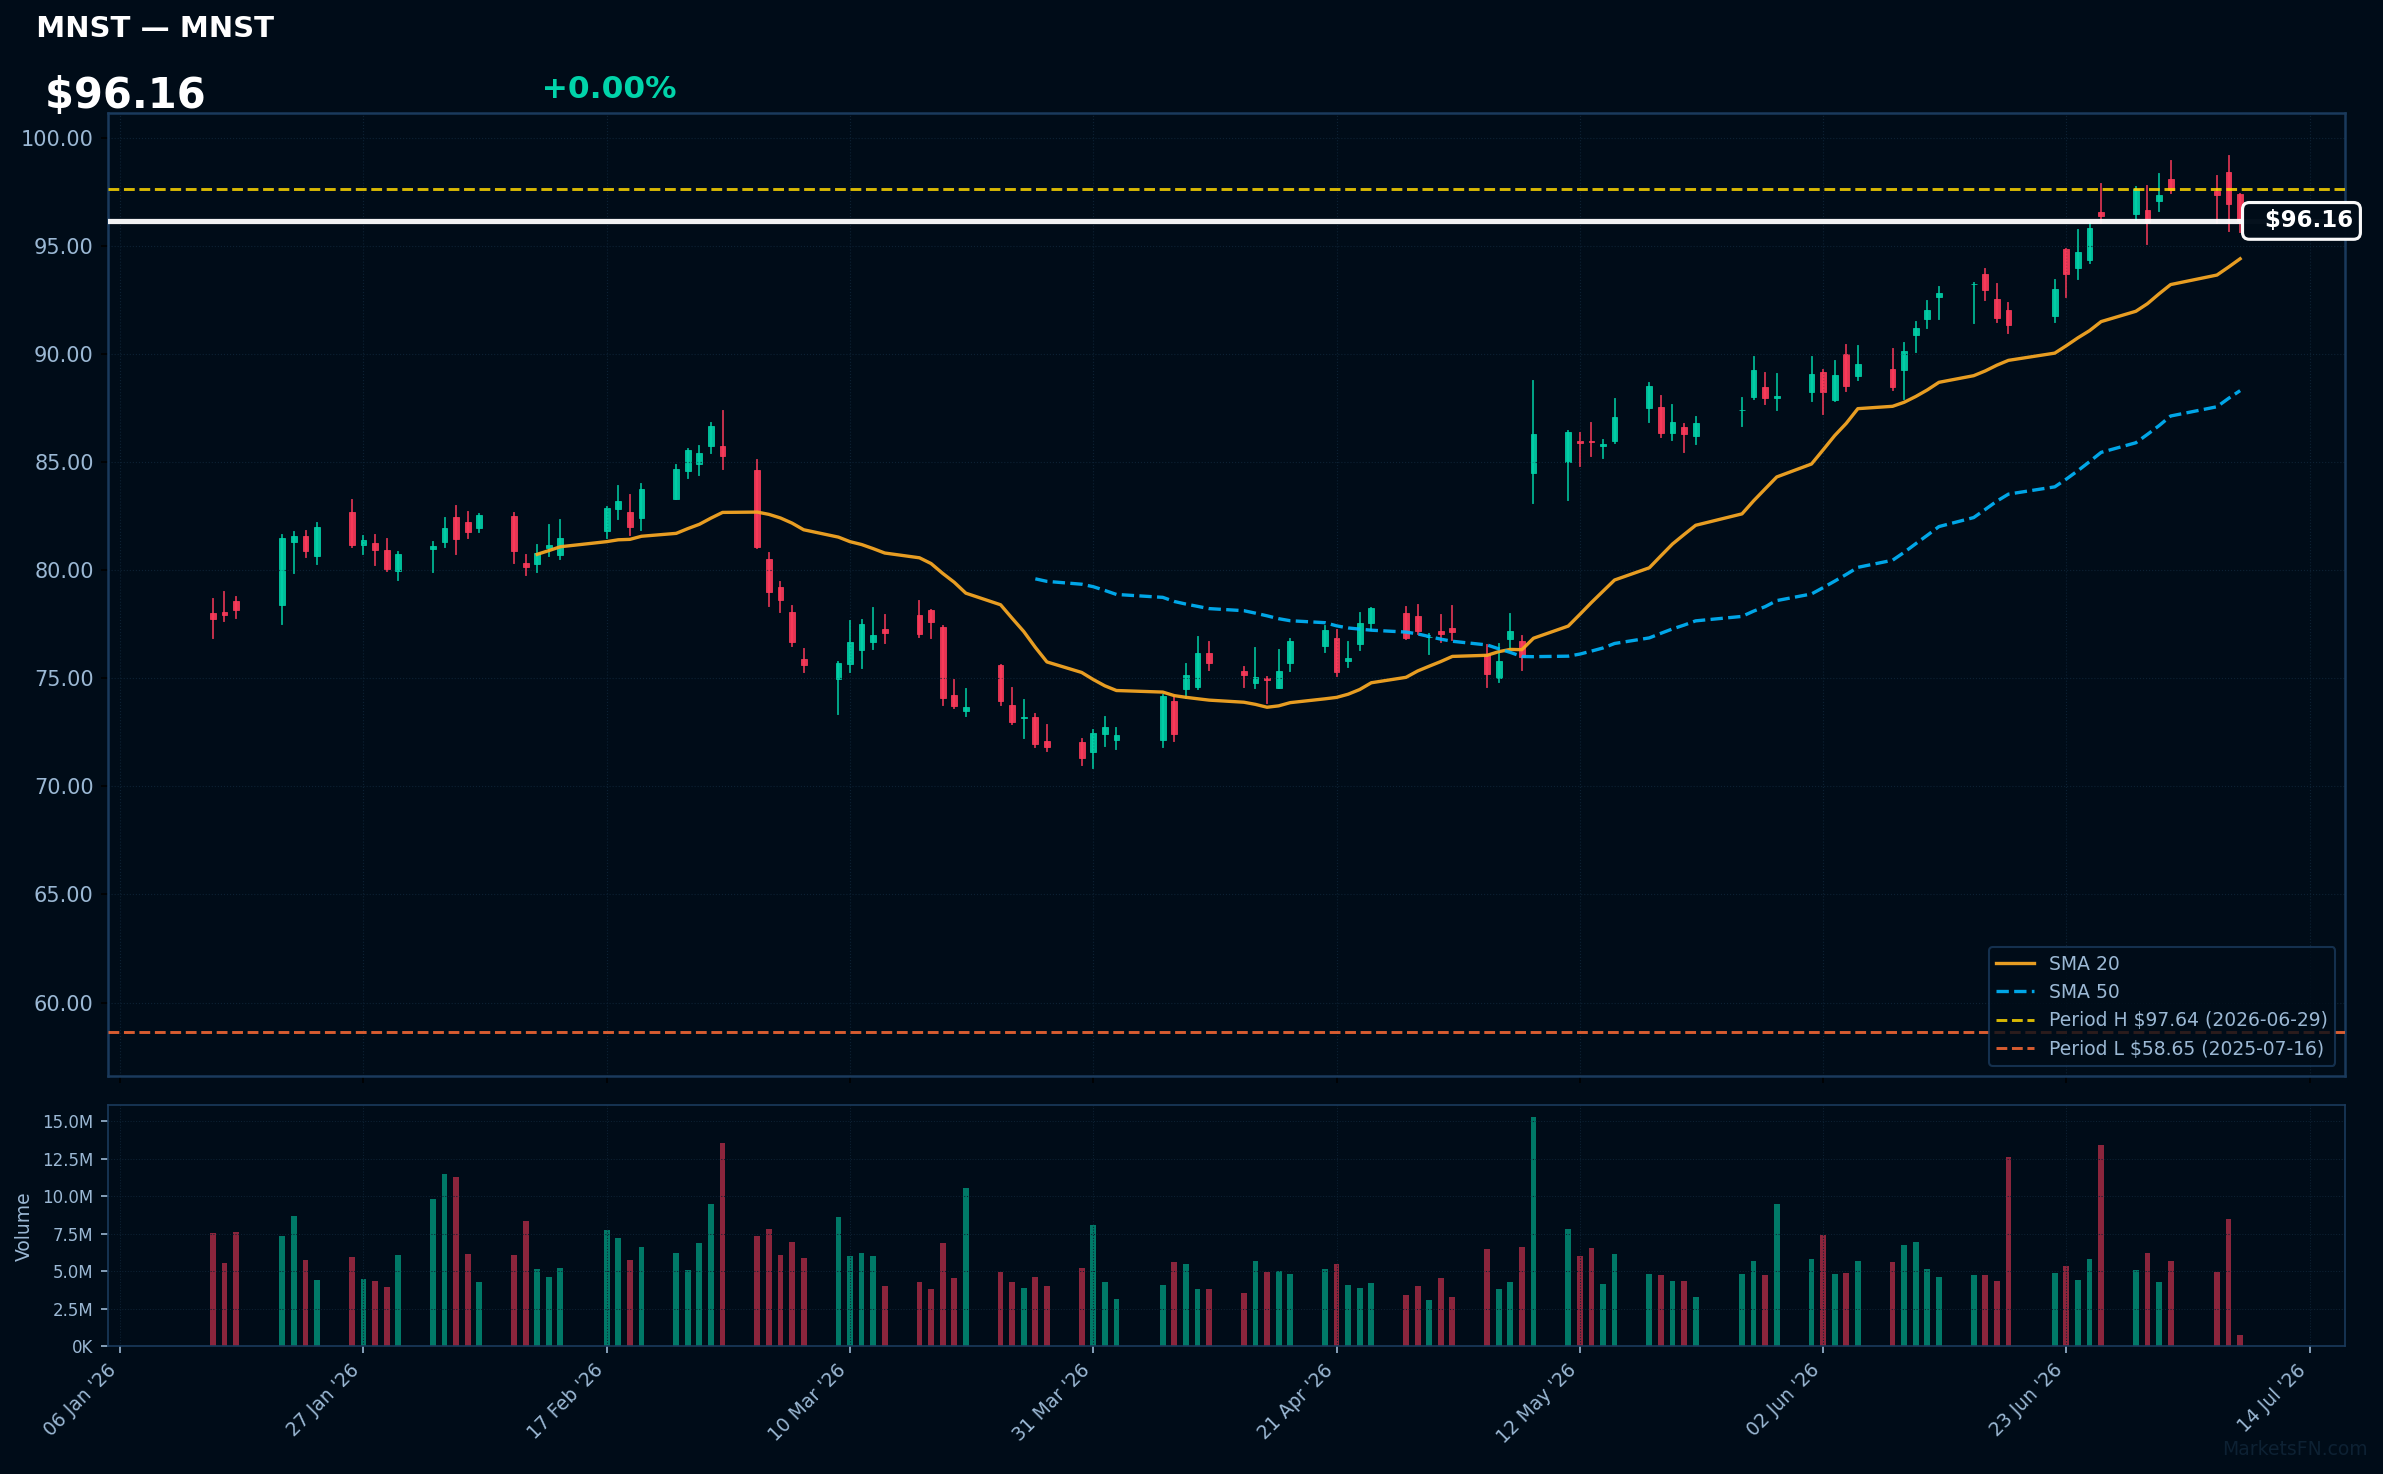
MNST | Monster Beverage Corp | Consumer Defensive | Price Last: $96.16 | % Realized: +56.13% | RSI: 63.8 | % above MA200: +23.2% | Trend: Above MA20, MA50, MA200
Monster Beverage Corp is a leading energy drink manufacturer with popular brands like Monster Energy. Investors should care due to its strong brand portfolio and growth potential in the energy drink market.
The stock shows bullish technicals with RSI(14) at 63.8, price > MA20 > MA50 > MA200, and is 1.5% below its 52-Week high, indicating sustained uptrend and potential breakout momentum.
Related headlines
- Massive Gap-Up Propels This Monster To Record High. These Clues Point To More Gains Ahead.
- Monster Beverage Announces Participation in dbAccess Global Consumer Conference 2026
- Dow Jones Leader Amazon, AI Stock Quanta, Monster Beverage In Or Near Buy Zones
- See How Institutions Drive Monster Beverage Shares Higher
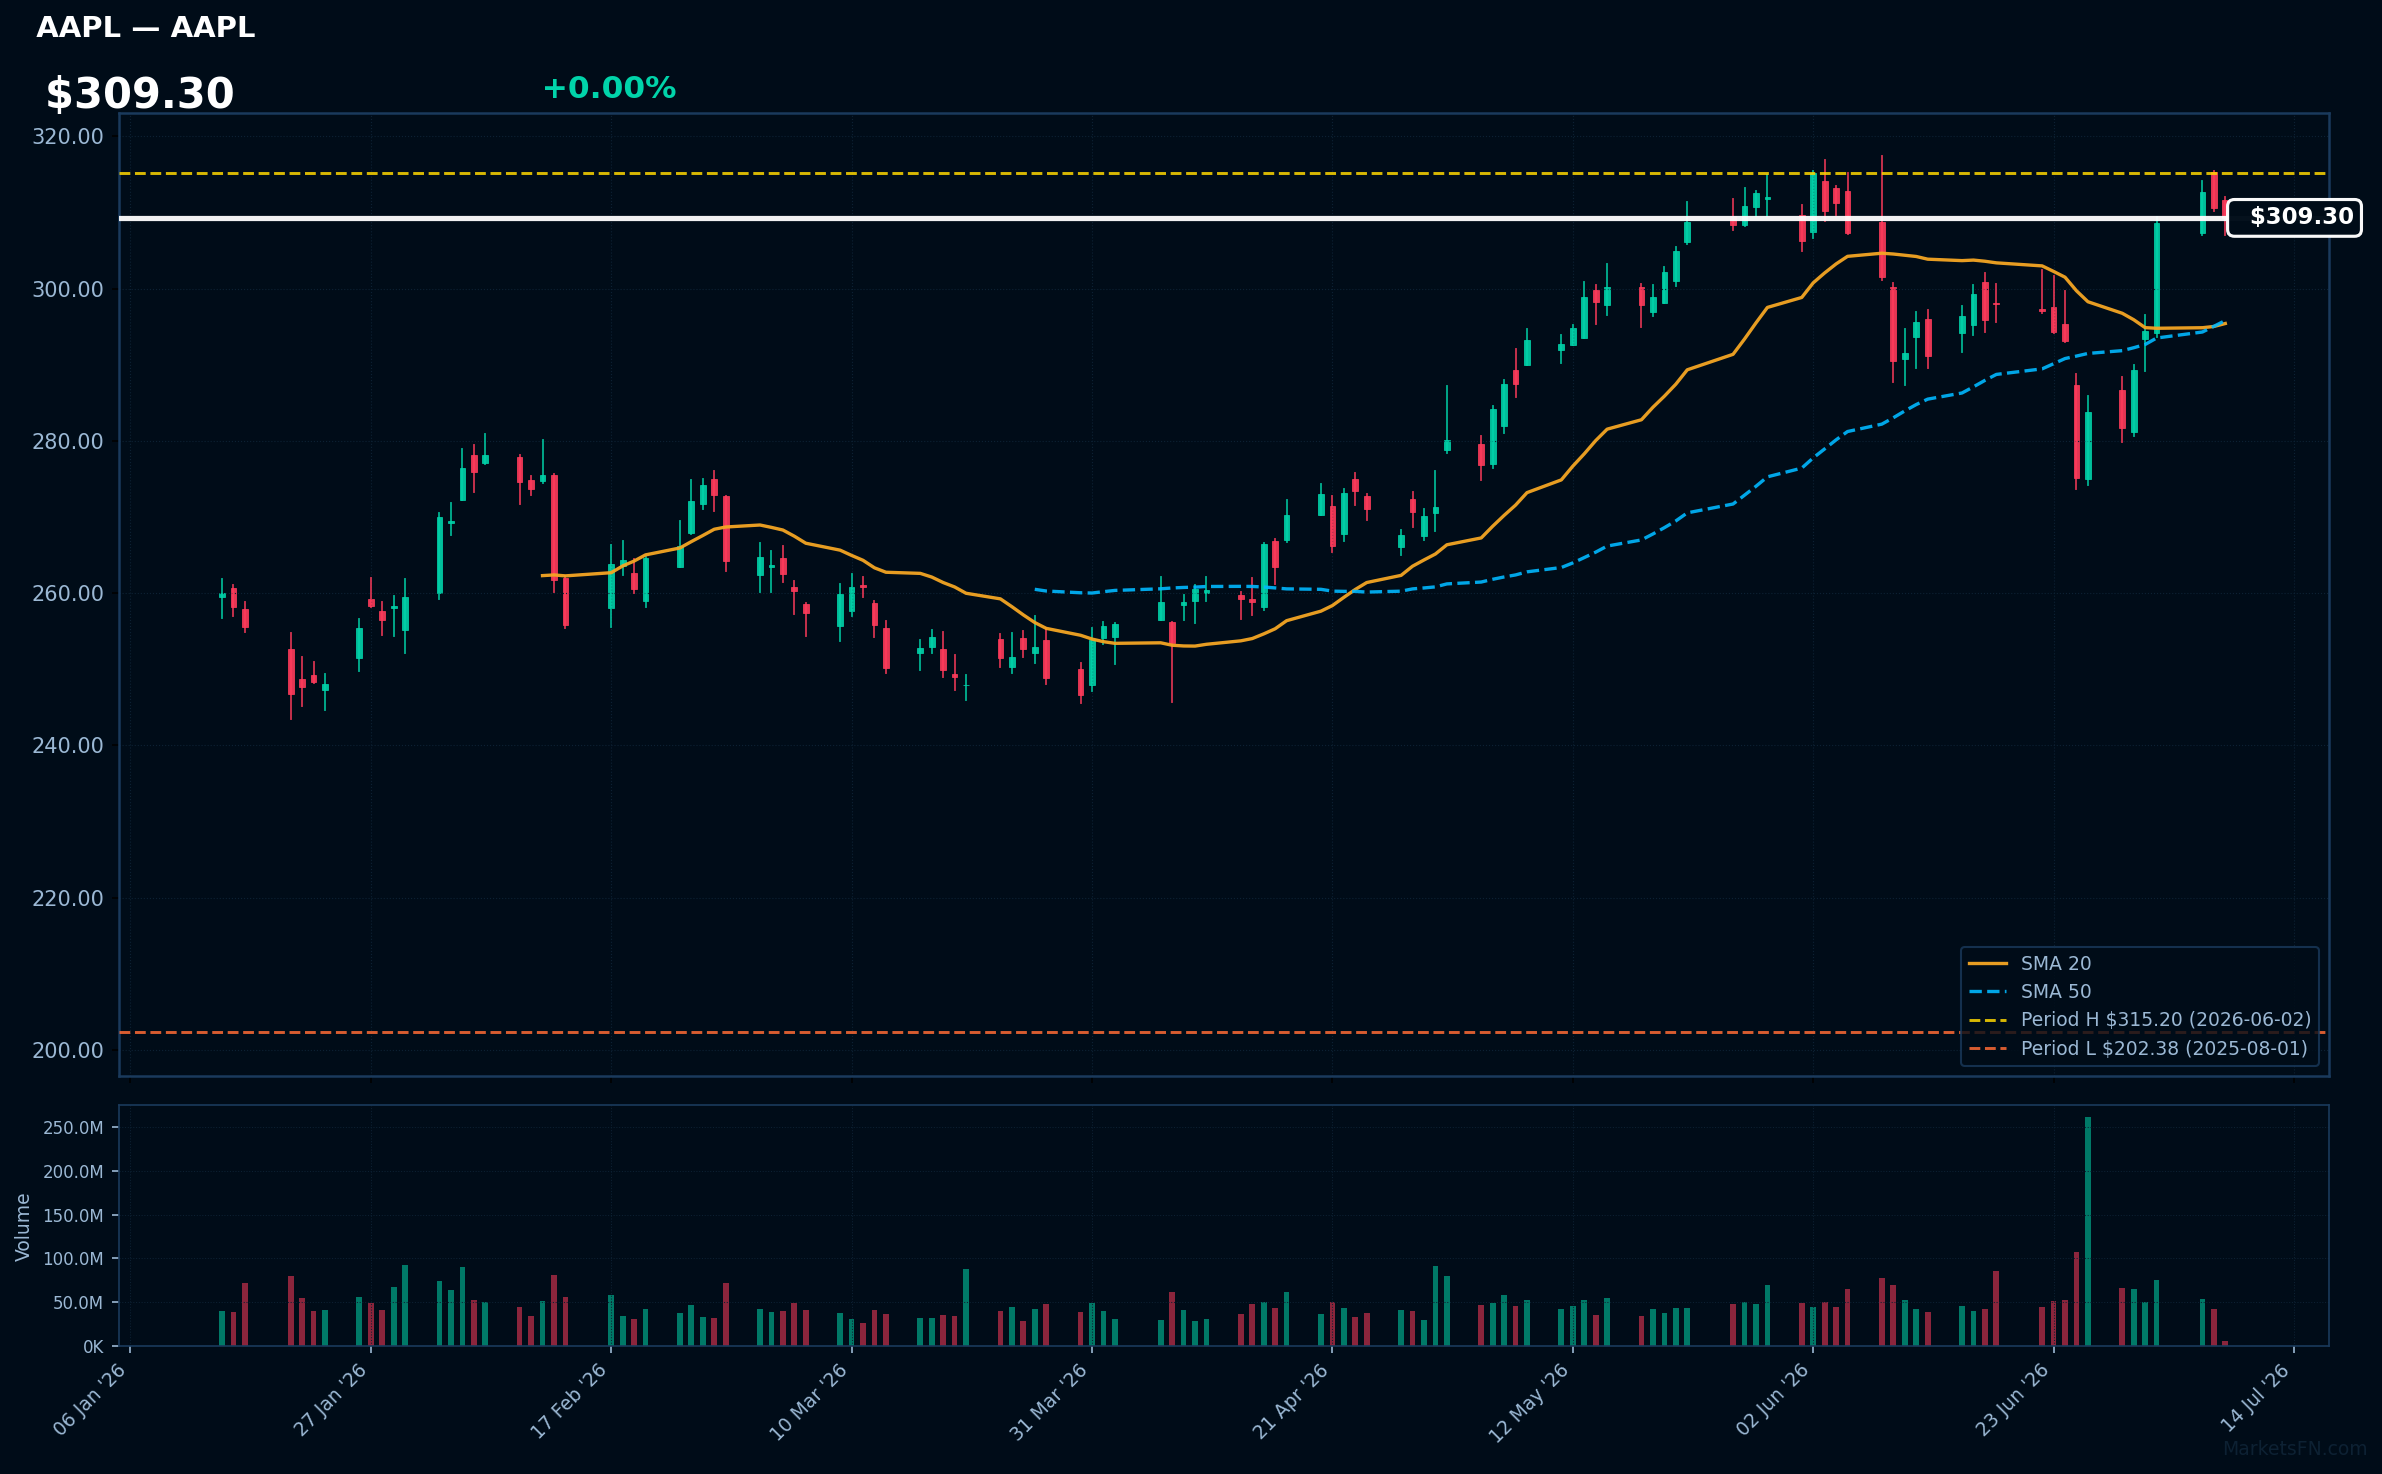
AAPL | Apple Inc | Technology | Price Last: $309.27 | % Realized: +47.26% | RSI: 59.4 | % above MA200: +13.8% | Trend: Above MA20, MA50, MA200
Apple Inc designs, manufactures, and markets consumer electronics, software, and services, generating revenue primarily from iPhone sales and services like Apple Music and iCloud. Investors care due to its significant market share and ecosystem-driven customer loyalty.
AAPL's RSI(14) is 59.4, indicating neutral momentum. The stock is above MA20, MA50, and MA200, showing a bullish trend. Being 1.9% below its 52-Week high suggests a potential breakout, with a 47.3% 52-Week return indicating strong performance.
Related headlines
📉 Nearest to 52-Week Low
Sectors represented: Consumer Cyclical (1), Industrials (1), Utilities (1), Real Estate (1), Healthcare (1)
| Ticker | Company | Sector | Price Last | % Realized | 52-Week Low Date | RSI | % above MA200 | Trend |
|---|---|---|---|---|---|---|---|---|
| ORLY | O'Reilly Automotive, Inc | Consumer Cyclical | $85.34 | -6.87% | 2026-07-06 | 41.7 | -9.7% | Below MA20, MA50, MA200 |
| CPRT | Copart, Inc | Industrials | $28.83 | -40.56% | 2026-06-29 | 40.7 | -22.7% | Below MA20, MA50, MA200 |
| CEG | Constellation Energy Corporation | Utilities | $243.22 | -22.25% | 2026-07-01 | 39.1 | -23.0% | Below MA20, MA50, MA200 |
| CSGP | Costar Group, Inc | Real Estate | $29.37 | -64.54% | 2026-06-30 | 42.4 | -44.9% | Below MA20, MA50, MA200 |
| ISRG | Intuitive Surgical Inc | Healthcare | $418.51 | -20.63% | 2026-06-30 | 50.9 | -14.3% | Above MA20 · Below MA50, MA200 |
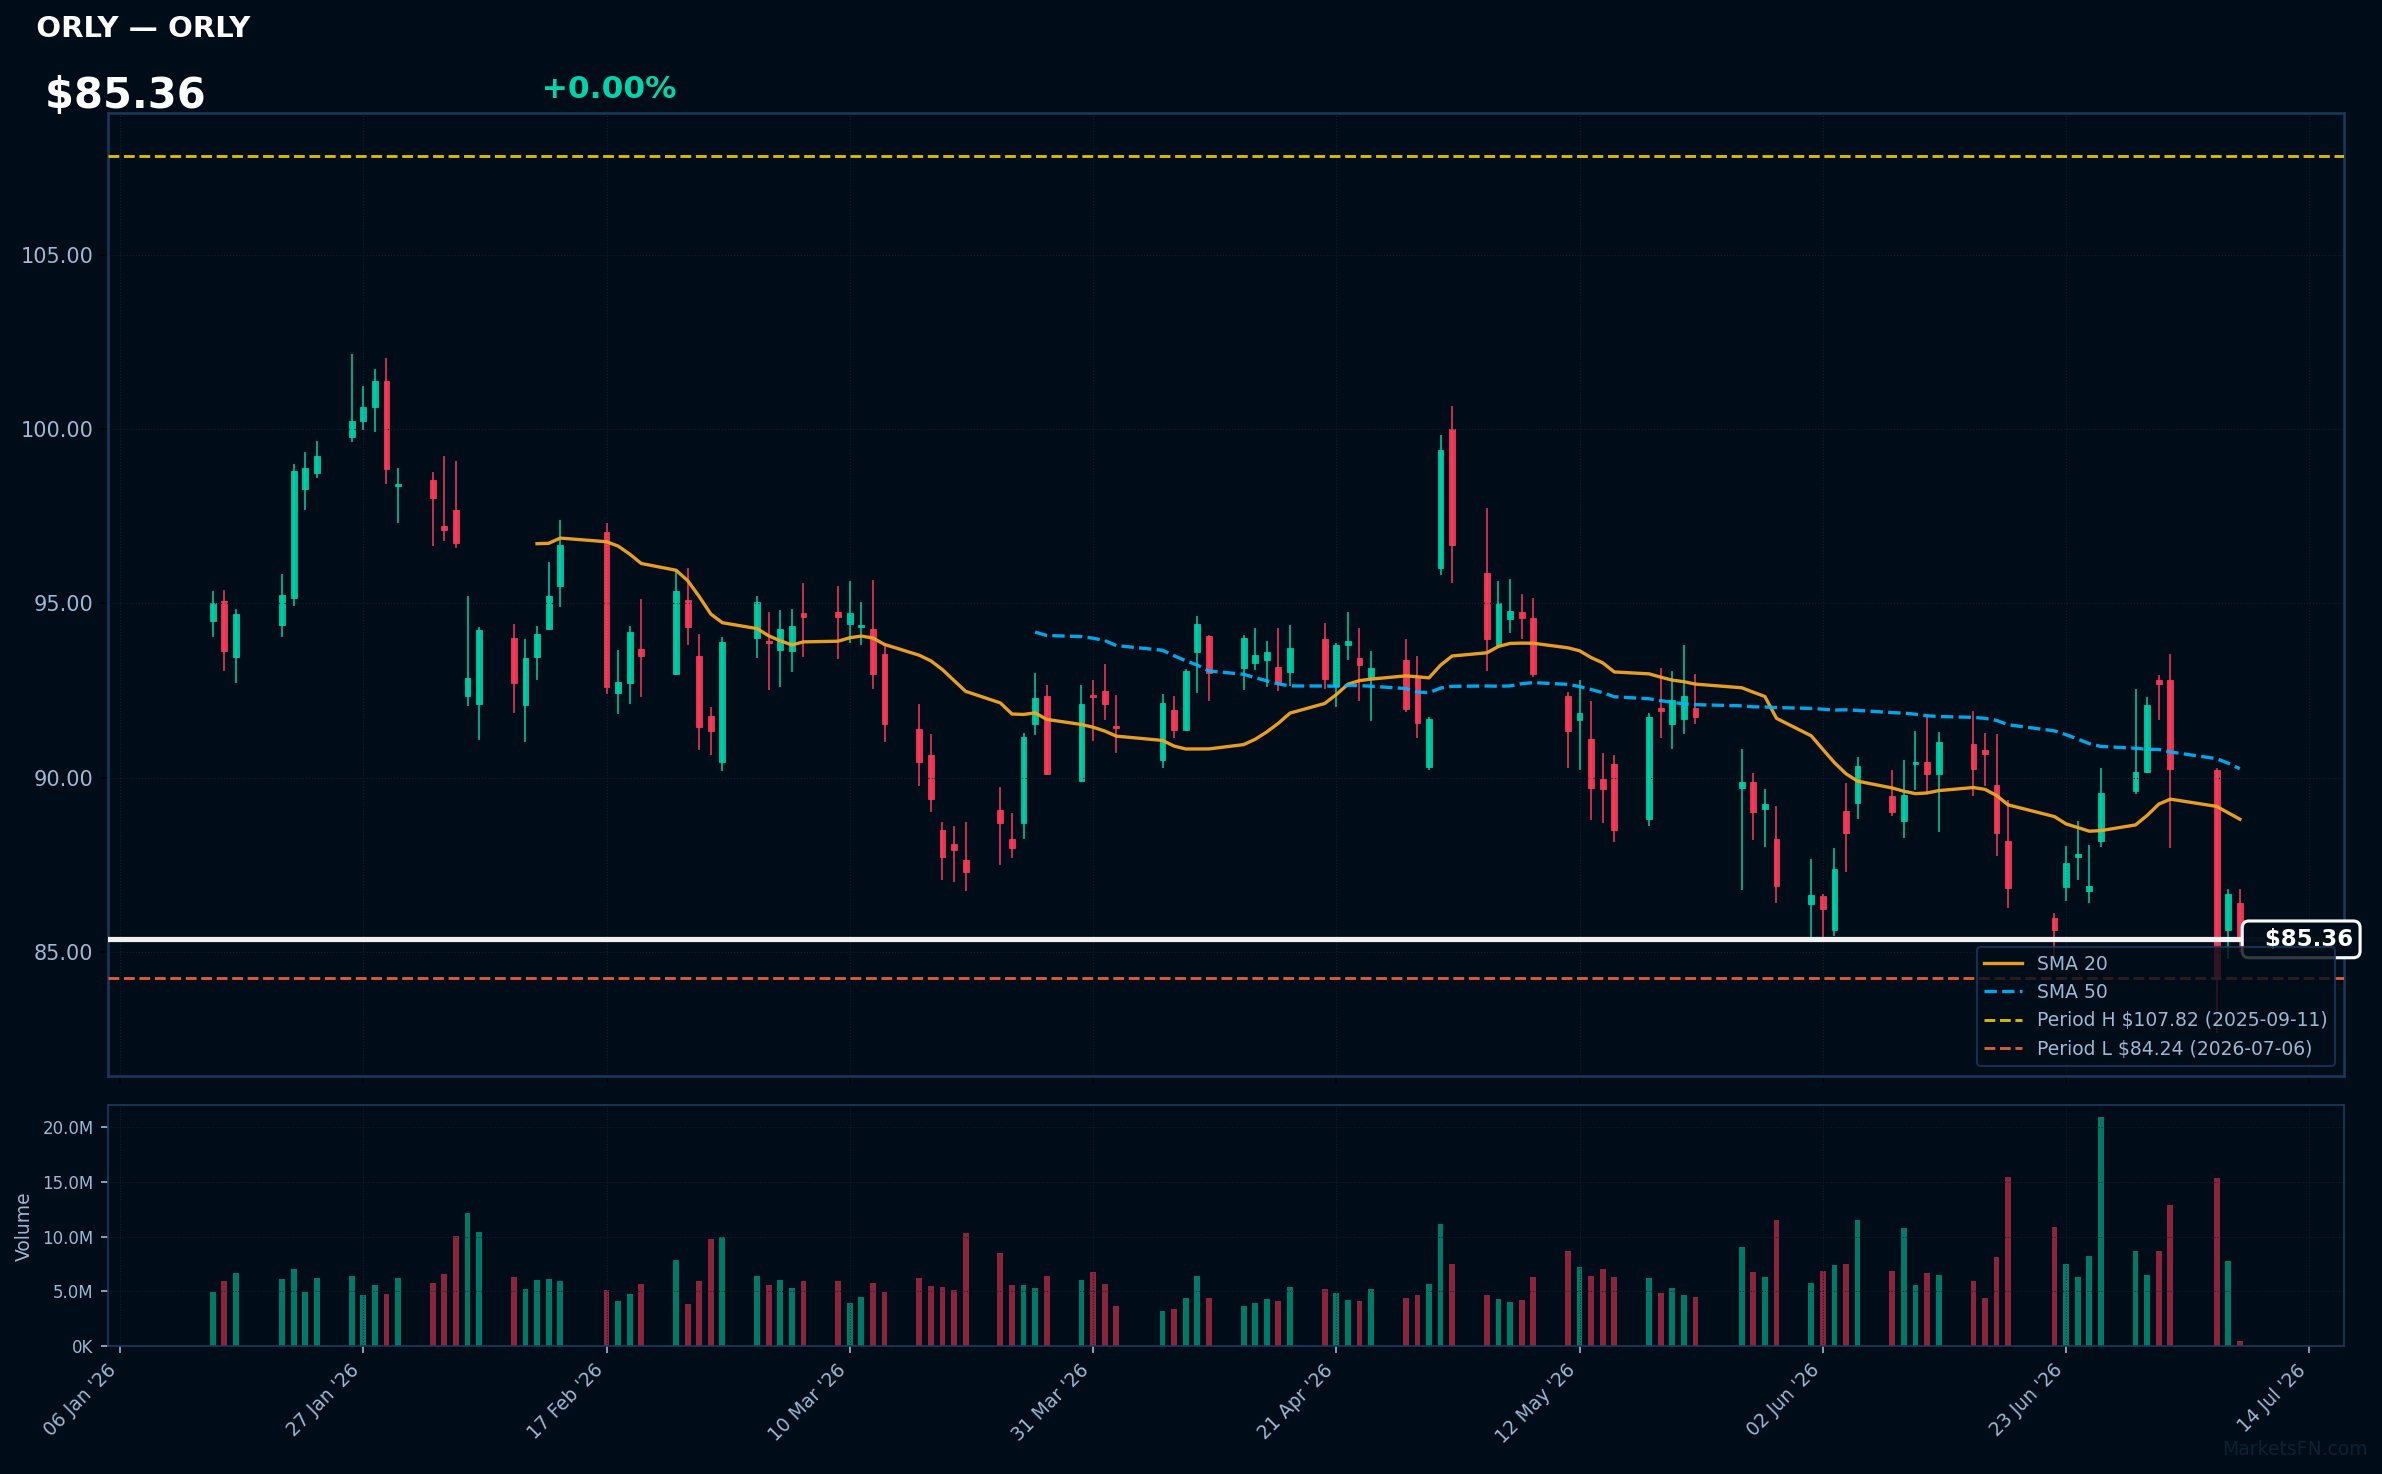
ORLY | O'Reilly Automotive, Inc | Consumer Cyclical | Price Last: $85.34 | % Realized: -6.87% | RSI: 41.7 | % above MA200: -9.7% | Trend: Below MA20, MA50, MA200
O'Reilly Automotive, Inc operates a retail chain selling automotive parts and accessories. Investors should care because its performance reflects the health of the automotive aftermarket, influenced by factors like vehicle age, DIY culture, and professional installer demand.
ORLY's technicals indicate a sustained downtrend with price ($85.36) below MA20, MA50, and MA200. The RSI(14) is 41.7, nearing oversold territory. The stock is 1.3% above its 52-Week low, testing major support, and has returned -6.9% over the 52-Week period.
Related headlines
- Why Did REE, HTZ, ORLY Stocks Slump To 52-Week Lows Today?
- O'Reilly Stock Sinks on Report of Possible NAPA Bid
- GPC Stock Pops 13%, ORLY Falls 5% OReilly Makes Cash Bid For Genuine Parts $10B Auto Unit, Says Report
- O'Reilly Automotive, Inc. Announces Dates for Its Second Quarter 2026 Earnings Release and Conference Call
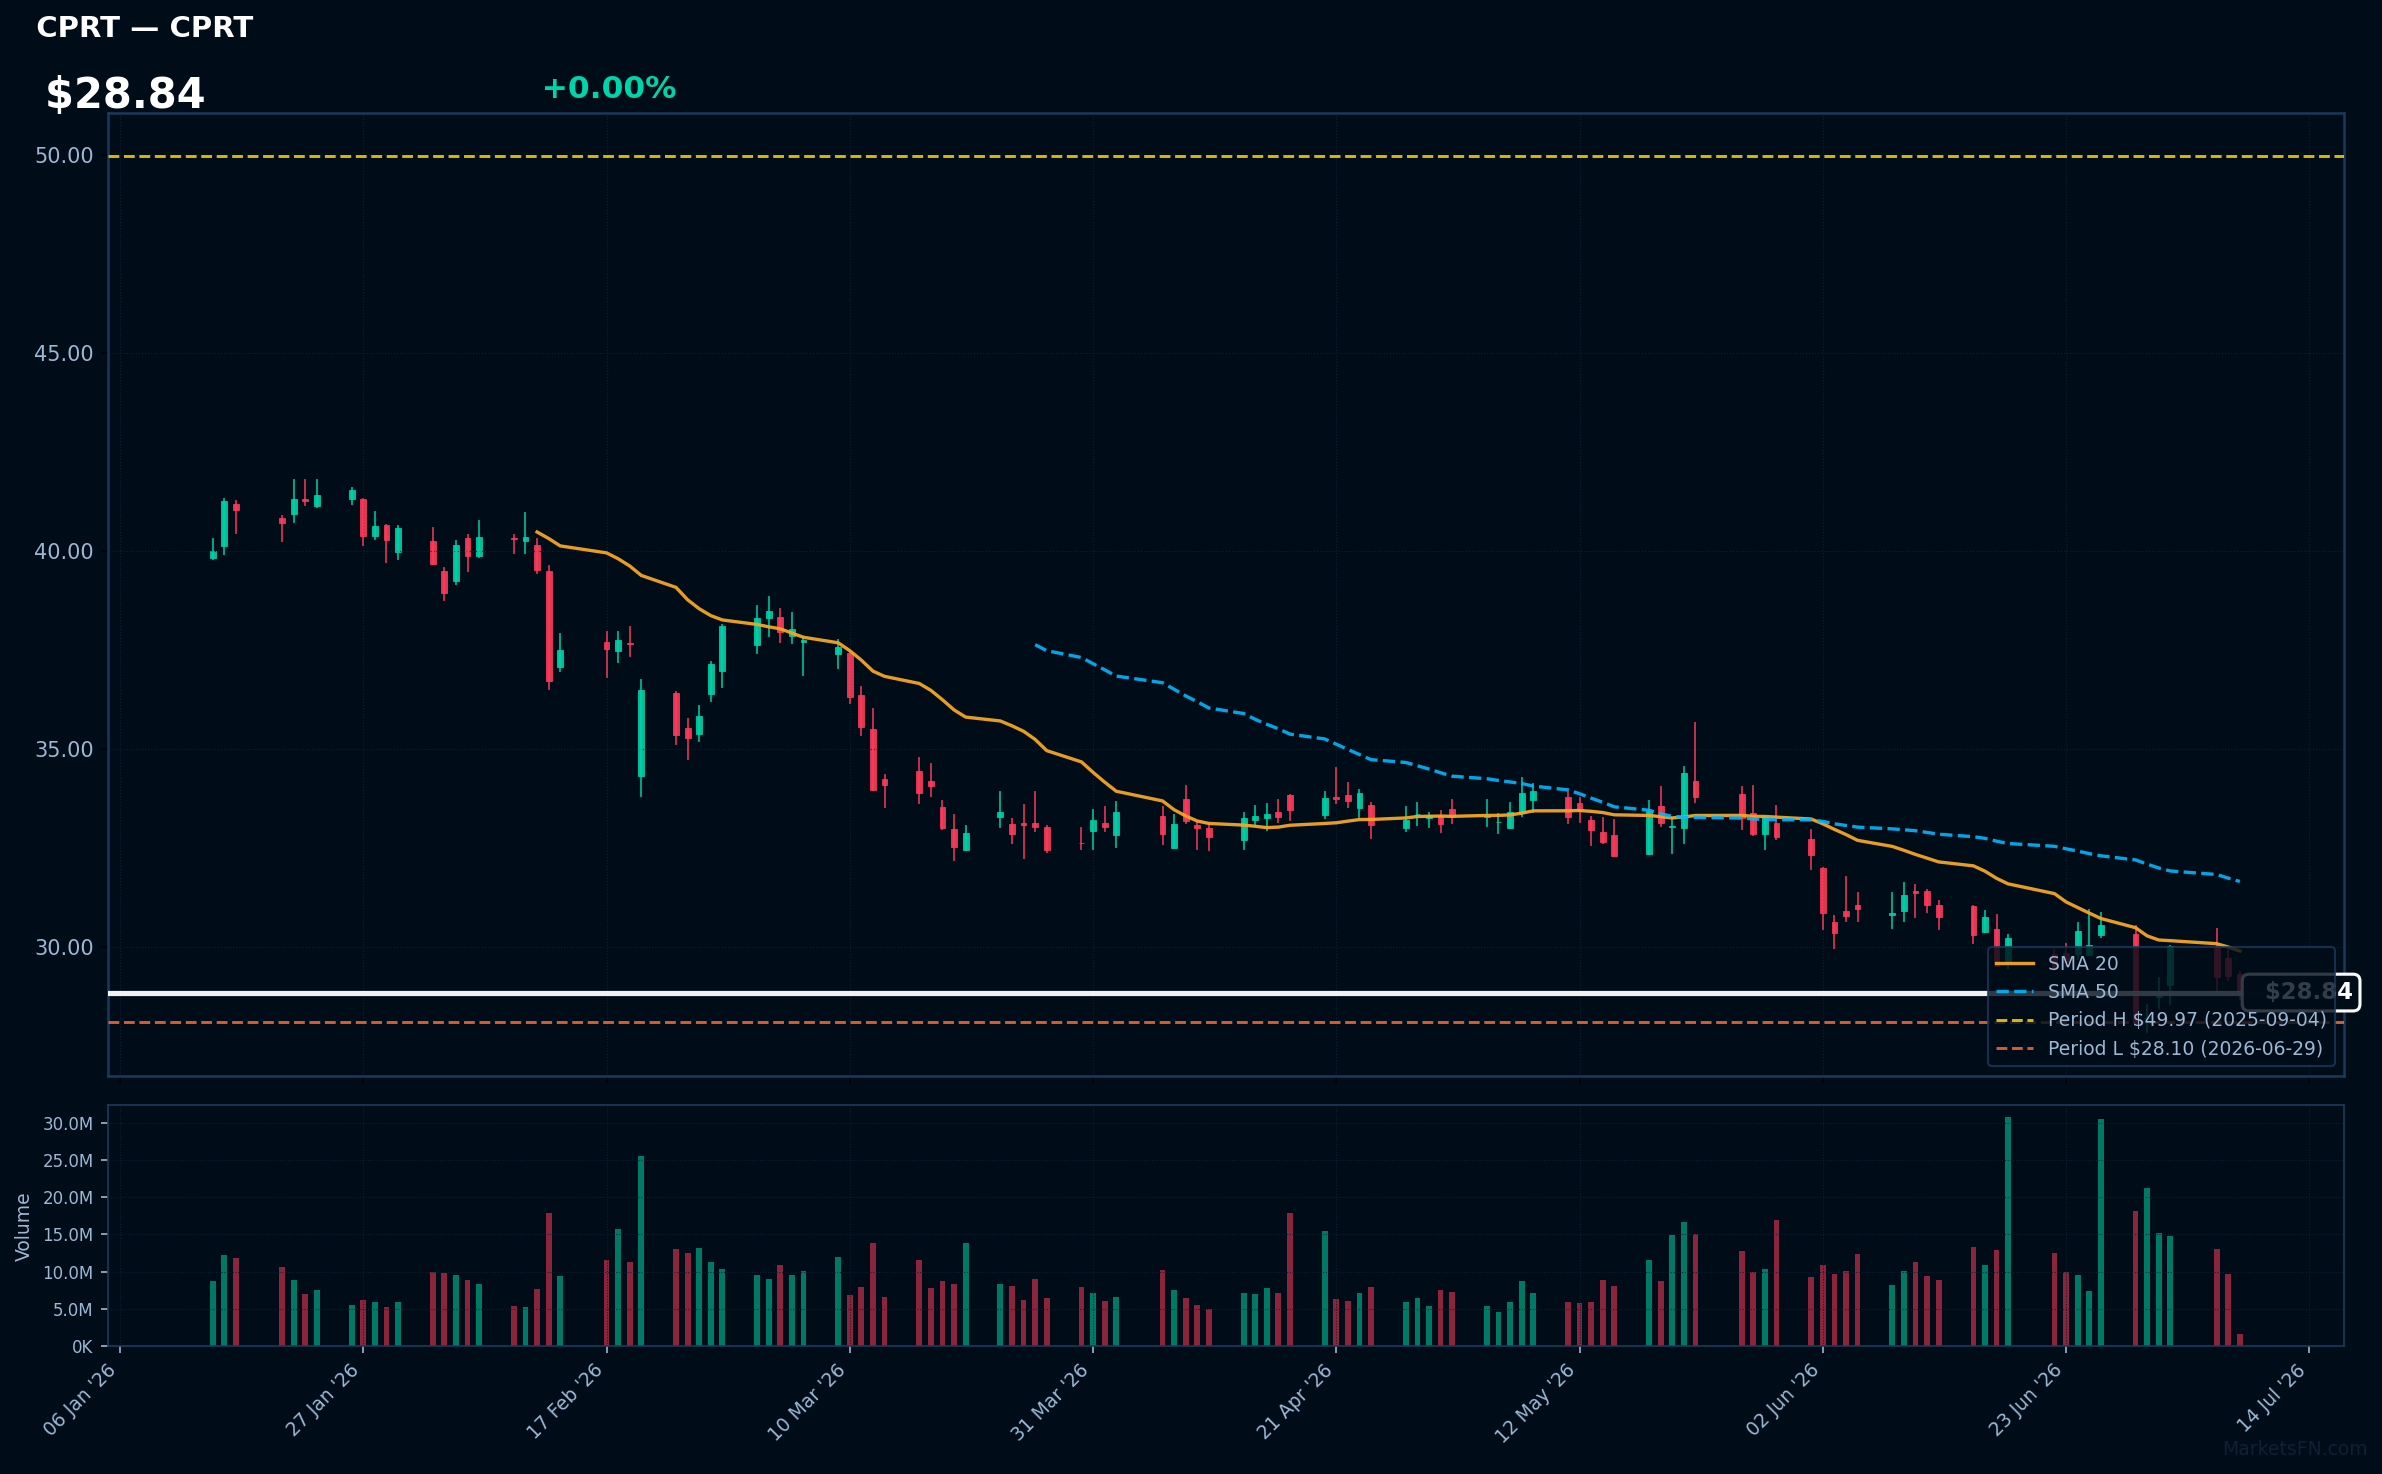
CPRT | Copart, Inc | Industrials | Price Last: $28.83 | % Realized: -40.56% | RSI: 40.7 | % above MA200: -22.7% | Trend: Below MA20, MA50, MA200
Copart, Inc (CPRT) operates an online vehicle auction platform and provides related services, allowing insurance companies and other sellers to sell damaged or used vehicles to buyers worldwide. Investors care due to its market dominance and growth potential in the vehicle remarketing industry.
Copart's technical situation indicates a sustained downtrend with price ($28.84) below MA20, MA50, and MA200. The RSI(14) is 40.7, nearing oversold territory, and the stock is 2.6% above its 52-Week low, testing major support after a -40.6% 52-Week return, signaling a potential warning.
Related headlines
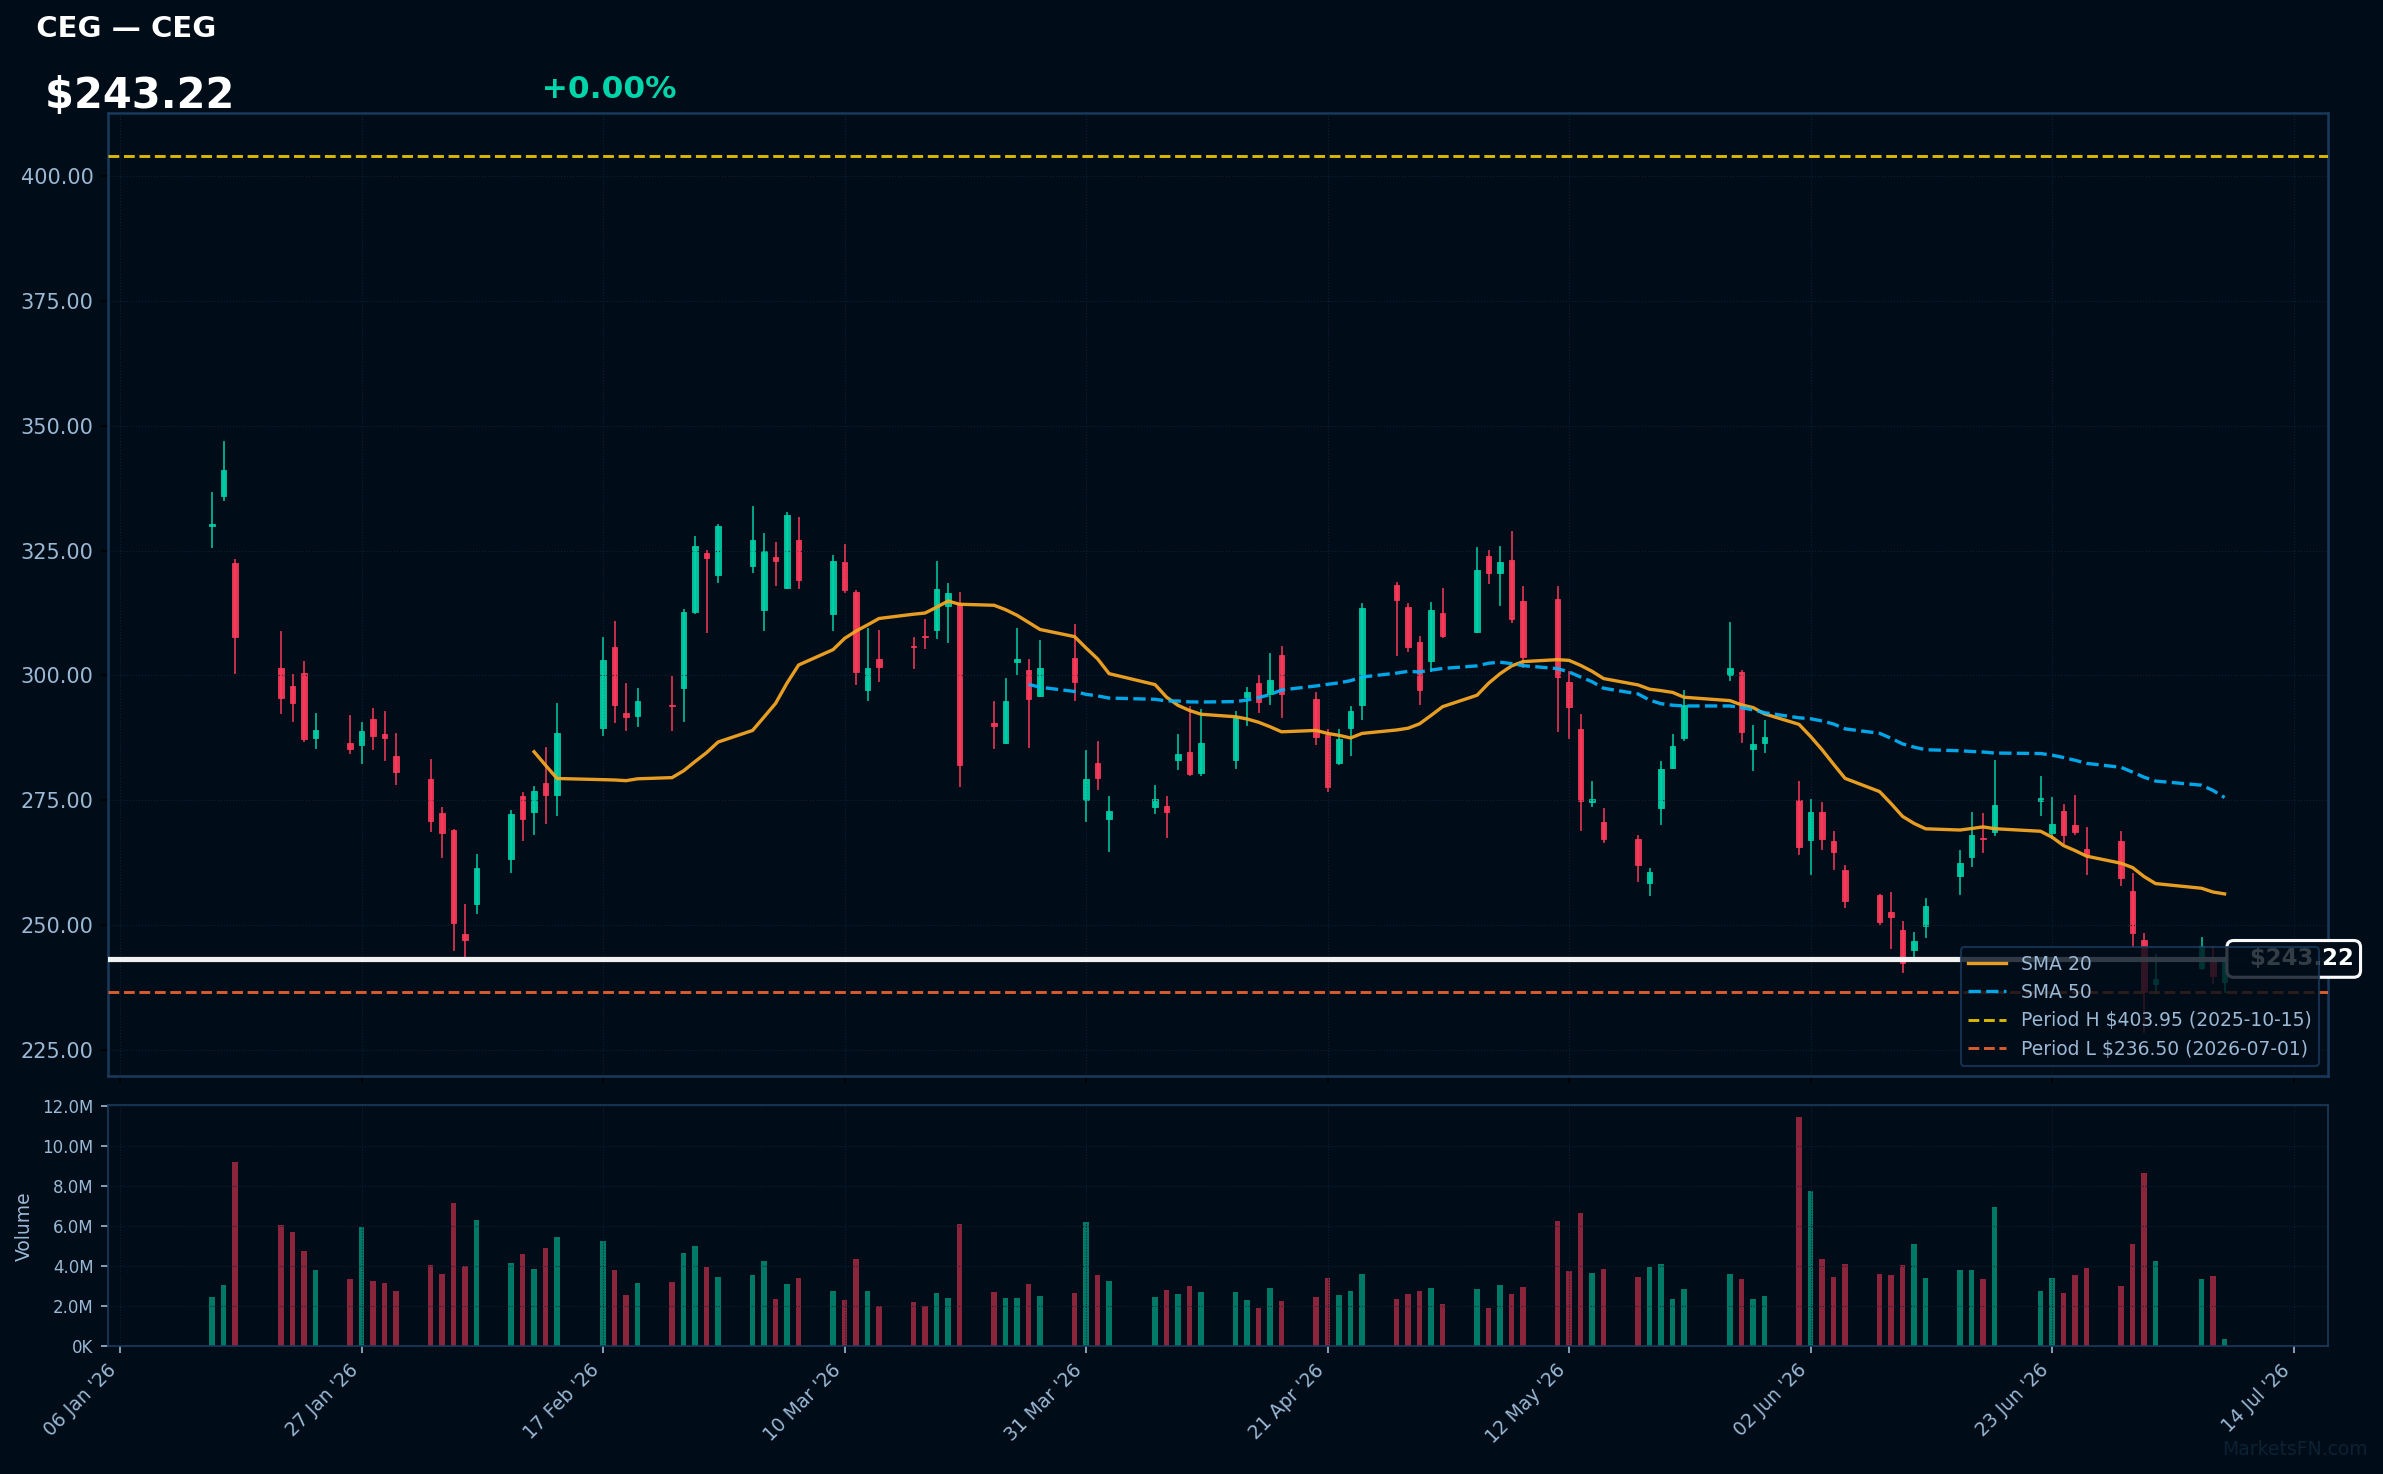
CEG | Constellation Energy Corporation | Utilities | Price Last: $243.22 | % Realized: -22.25% | RSI: 39.1 | % above MA200: -23.0% | Trend: Below MA20, MA50, MA200
Constellation Energy Corporation is a leading energy company that generates and supplies electricity and natural gas. Investors should care because its performance is tied to energy demand and market volatility, making it a key player in the energy sector.
CEG's technical situation is bearish, with an RSI(14) of 39.1, indicating oversold conditions, and a sustained downtrend as price ($243.22) remains below MA20, MA50, and MA200, with the stock 2.8% above its 52-Week low, testing major support.
Related headlines
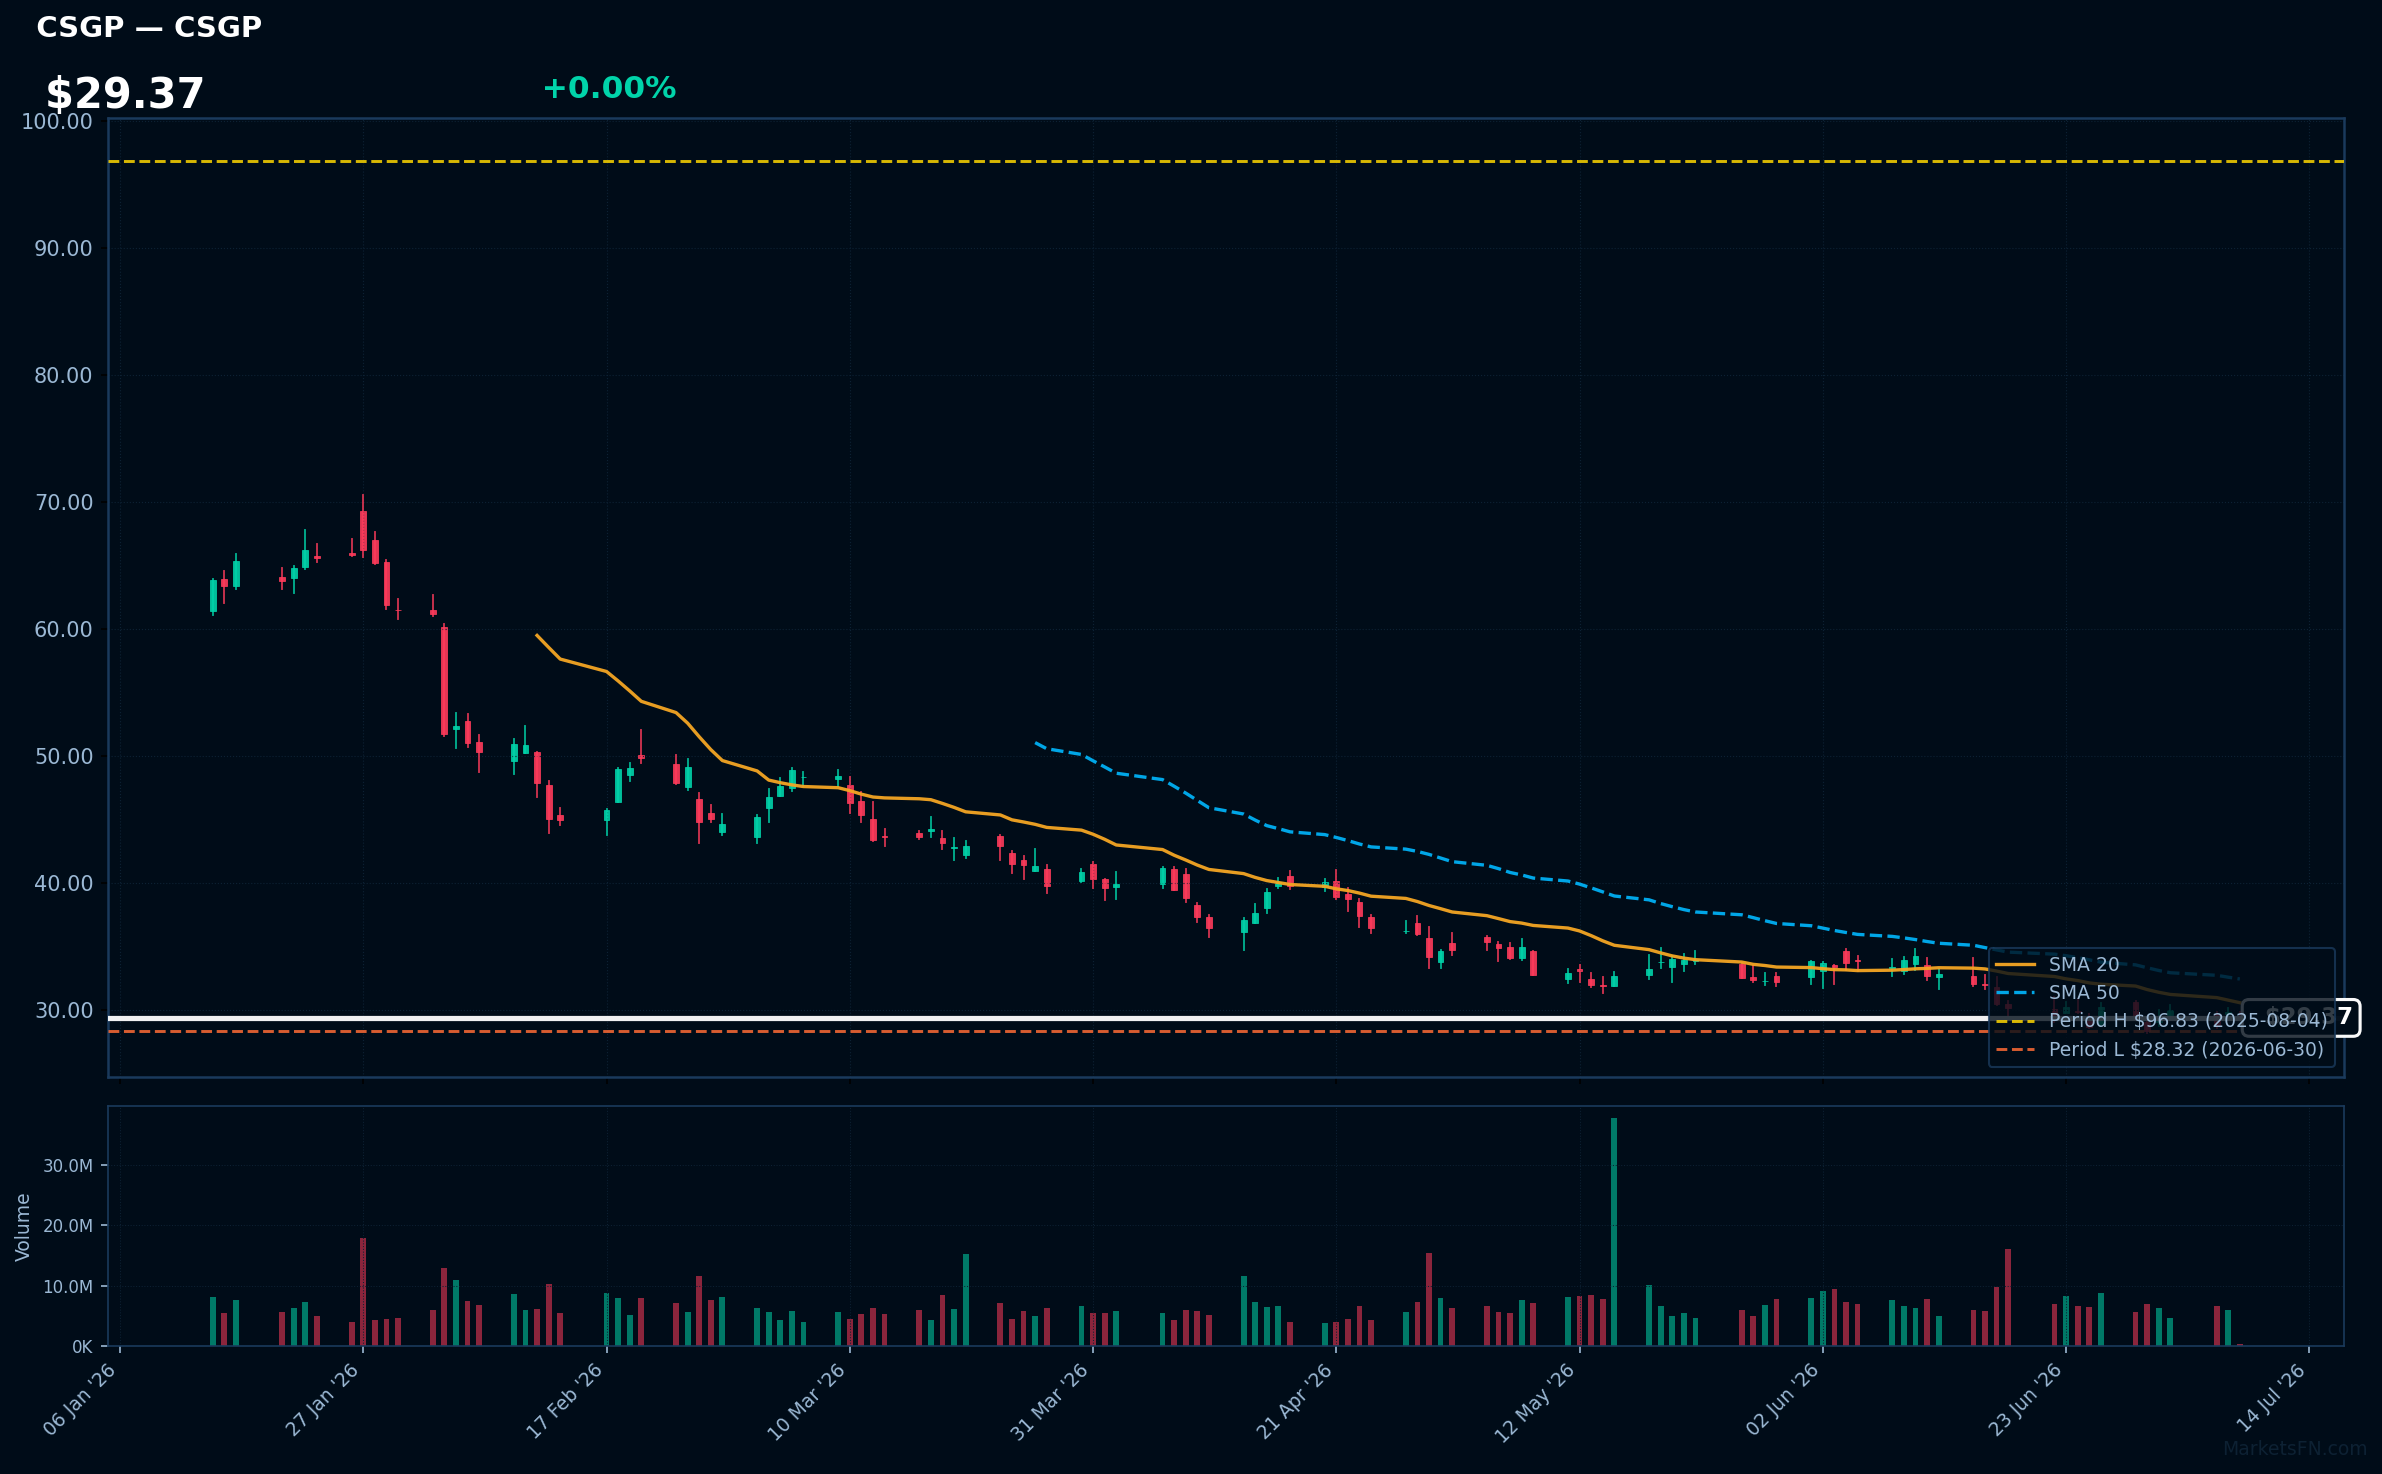
CSGP | Costar Group, Inc | Real Estate | Price Last: $29.37 | % Realized: -64.54% | RSI: 42.4 | % above MA200: -44.9% | Trend: Below MA20, MA50, MA200
Costar Group, Inc provides commercial real estate information, analytics, and marketplace services, enabling clients to make informed decisions. Investors should care as it dominates the commercial real estate data space, generating revenue through subscription-based services.
The stock exhibits a sustained downtrend with price ($29.37) below MA20, MA50, and MA200. RSI(14) is 42.4, nearing oversold territory. The stock is 3.7% above its 52-Week low, testing major support after a -64.5% 52-Week return, indicating potential further downside risk.
Related headlines
- CoStar Group Announces Launch of CoStar Platform in France
- CoStar Group to Report Financial Results for Second Quarter on July 28, 2026
- CoStar Group Invests in Wikicasa, Italys Agent-Backed Real Estate Marketplace
- CoStar Group Stockholders Overwhelmingly Reelect Director Nominees and Support Say-on-Pay at Annual Meeting of Stockholders
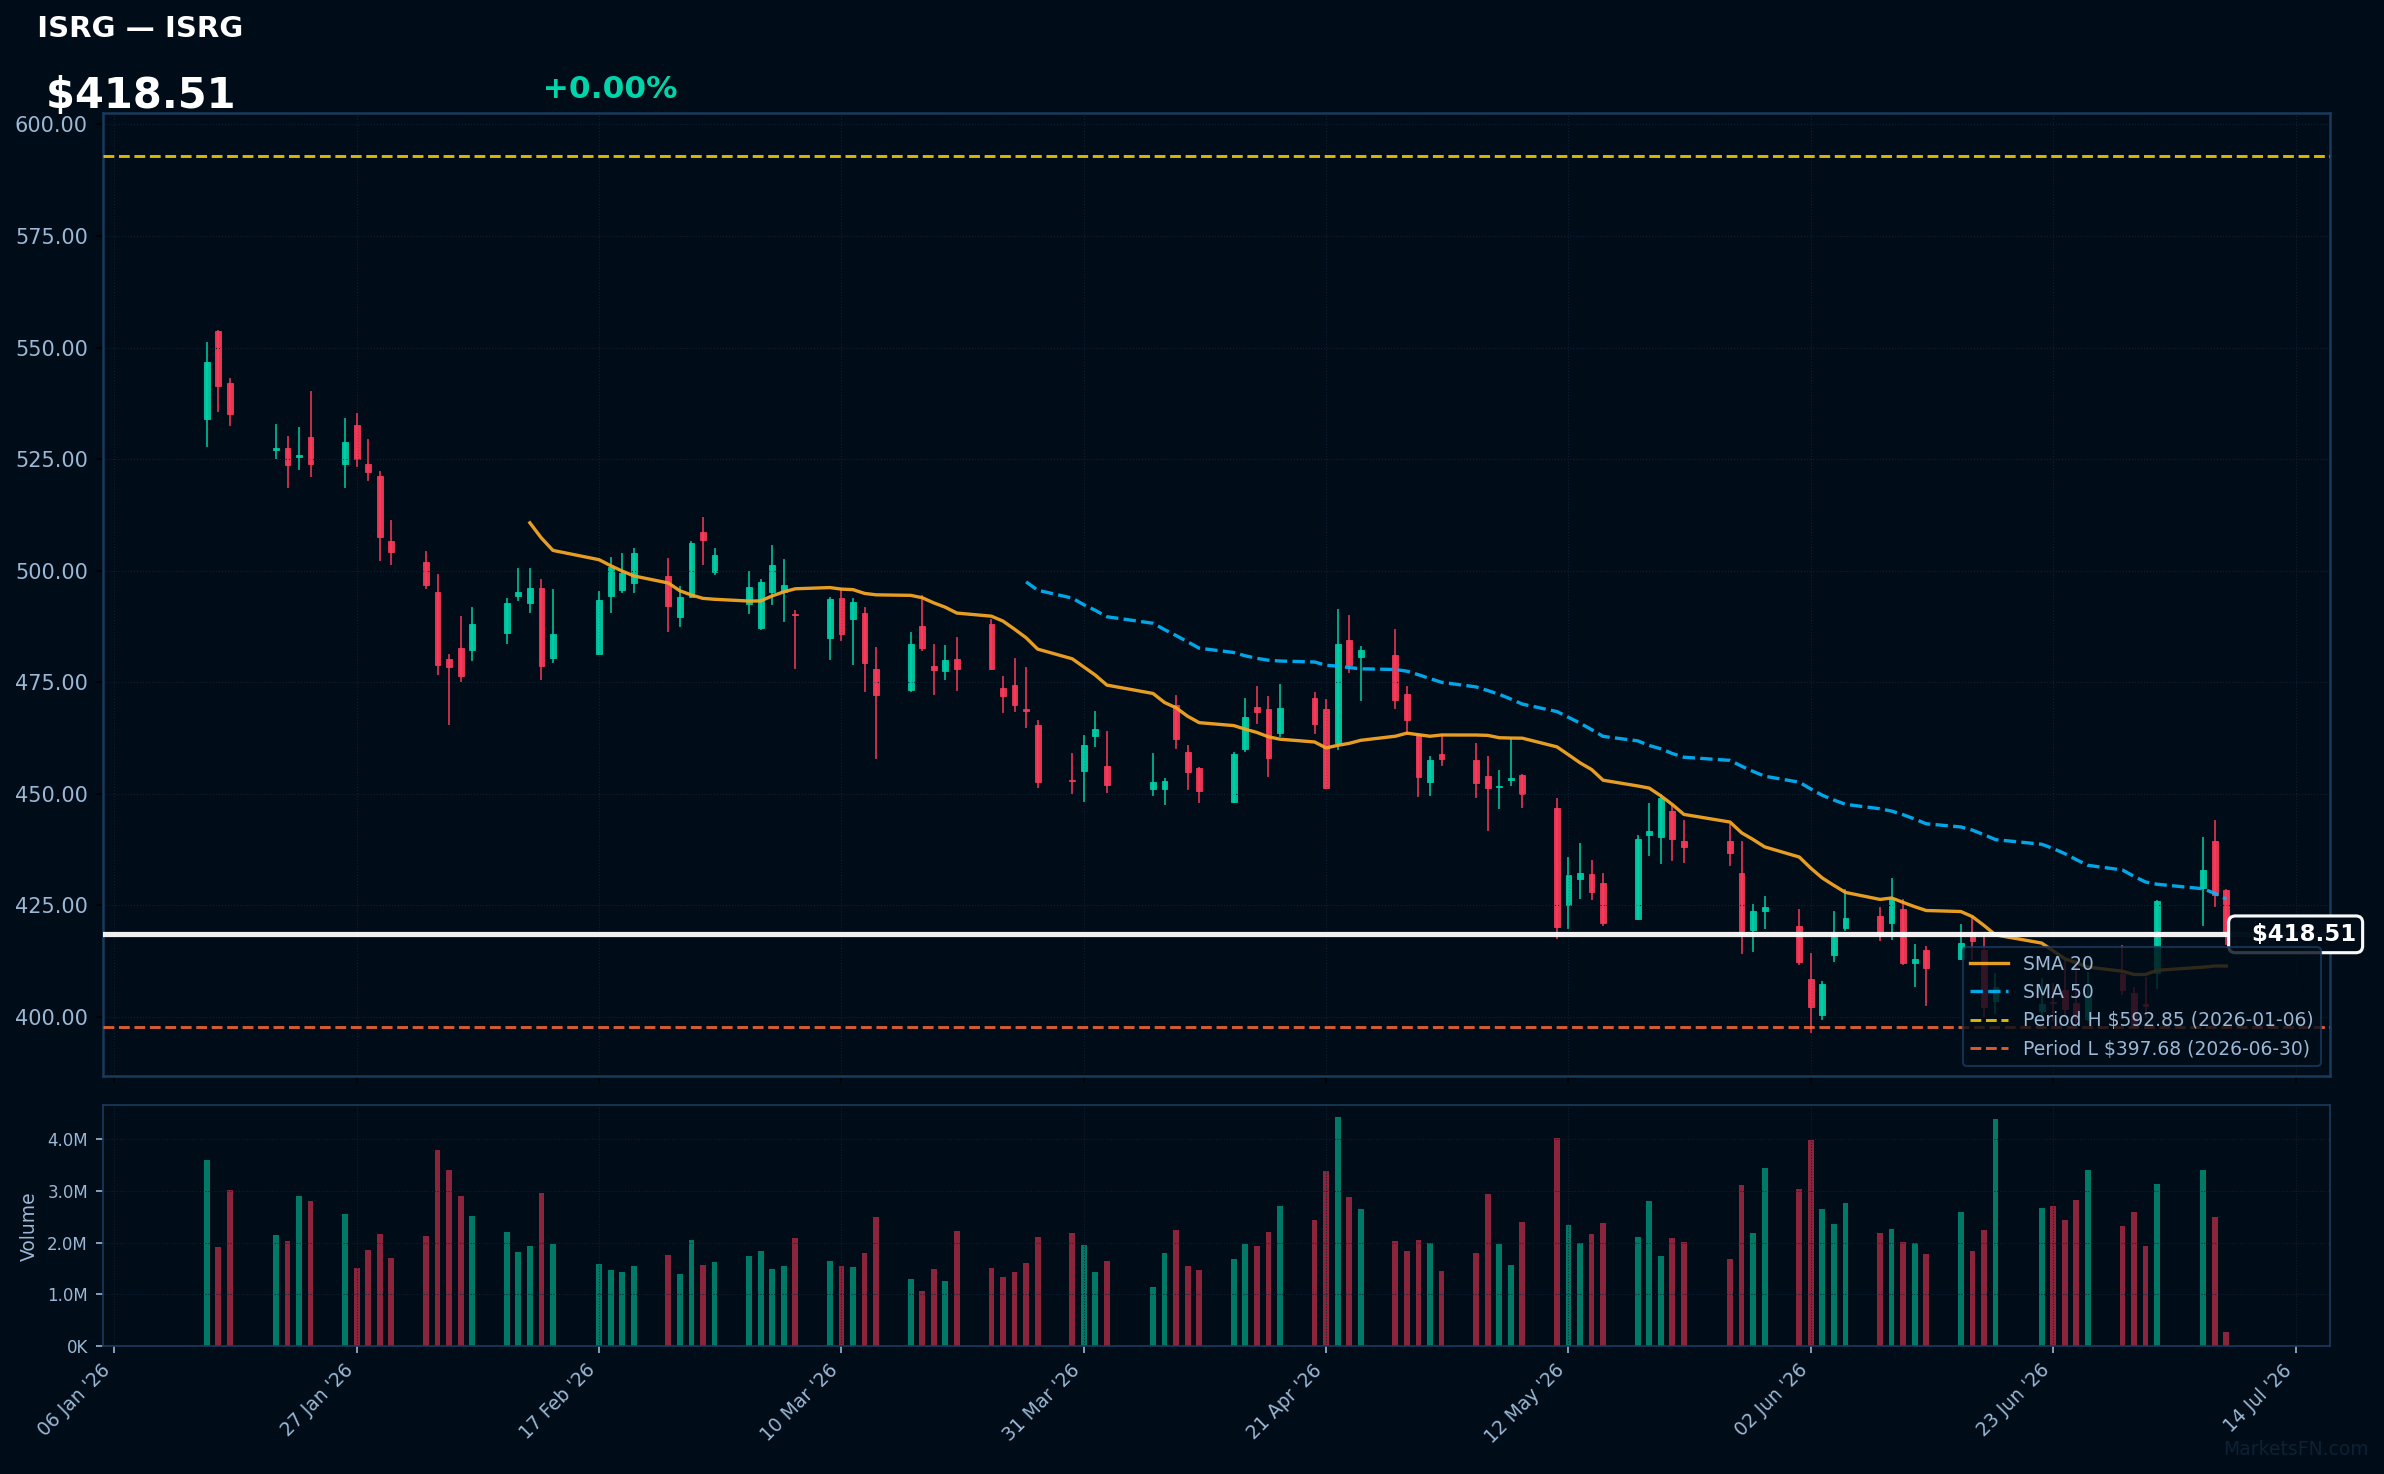
ISRG | Intuitive Surgical Inc | Healthcare | Price Last: $418.51 | % Realized: -20.63% | RSI: 50.9 | % above MA200: -14.3% | Trend: Above MA20 · Below MA50, MA200
Intuitive Surgical Inc develops and manufactures robotic-assisted surgical systems, enabling minimally invasive procedures. Investors should care about its innovative technology and market adoption, as it disrupts traditional surgical practices and creates new growth opportunities.
The stock's technical situation is mixed, with RSI(14) at 50.9 and price above MA20 but below MA50/MA200, indicating a lack of clear momentum. Its proximity to the 52-Week low (5.2% above) suggests testing major support.
Related headlines
Market Commentary
The Nasdaq 100 stocks listed near 52-week extremes indicate a significant trend. Stocks near 52-week highs, such as AAPL (-1.9% from 52W high) and MNST (-1.5% from 52W high), suggest a strong uptrend, while those near 52-week lows, like ISRG (+5.2% above 52W low), may be poised for a rebound.
The technology sector's performance is driving these price levels, with stocks like EA and AAPL nearing their 52-week highs. Macro themes, such as the ongoing demand for technology and energy, are likely contributing to the strength in stocks like AEP (-0.8% from 52W high) and CEG (+2.8% above 52W low). The energy sector's performance is also notable, with AEP and CEG near their respective extremes.
Key levels to watch include the 52-week highs and lows for these stocks. A breakout above the 52-week high for stocks like AAPL and MNST could signal further upside, while a breakdown below the 52-week low for stocks like ISRG could indicate additional downside. Catalysts to watch include earnings reports and industry trends that could impact these stocks' price movements.
Methodology: All 101 Nasdaq 100 constituents screened. 52-week high = highest daily close over the past 252 trading days (approx. 1 year). 52-week low = lowest daily close over the same period. Distance = (current price / extreme − 1) × 100. Technical indicators computed on up to 1 year of daily OHLCV data.
Disclaimer: For informational purposes only. Not investment advice. Past performance is not indicative of future results.

