S&P 500 2026 YTD Highs & Lows Radar: JPMorgan Chase & (JPM), Las Vegas Sands (LVS) and more
MarketsFN Team

S&P 500 2026 YTD Highs & Lows Radar: JPMorgan Chase & (JPM), Las Vegas Sands (LVS) and more
Screening all 503 S&P 500 constituents for stocks nearest to their 2026 year-to-date high and their 2026 YTD low. Data as of July 08, 2026. % Realized = total return since Jan 1 2026.
Legend: RSI > 70 = overbought · RSI < 30 = oversold · Green % Realized = positive YTD return · Red = negative.
📈 Nearest to 2026 High
Sectors represented: Healthcare (3), Financial (2)
| Ticker | Company | Sector | Price Last | % Realized | 2026 YTD High Date | RSI | % above MA200 | Trend |
|---|---|---|---|---|---|---|---|---|
| JPM | JPMorgan Chase & Co | Financial | $339.22 | +4.22% | 2026-07-07 | 61.7 | +9.8% | Above MA20, MA50, MA200 |
| LLY | Lilly(Eli) & Co | Healthcare | $1235.56 | +14.37% | 2026-07-07 | 64.1 | +24.6% | Above MA20, MA50, MA200 |
| JNJ | Johnson & Johnson | Healthcare | $267.24 | +28.88% | 2026-07-07 | 72.3 | +21.3% | Above MA20, MA50, MA200 |
| UNH | Unitedhealth Group Inc | Healthcare | $428.19 | +27.29% | 2026-07-07 | 61.7 | +26.5% | Above MA20, MA50, MA200 |
| PGR | Progressive Corp | Financial | $234.40 | +10.50% | 2026-07-07 | 73.1 | +10.0% | Above MA20, MA50, MA200 |
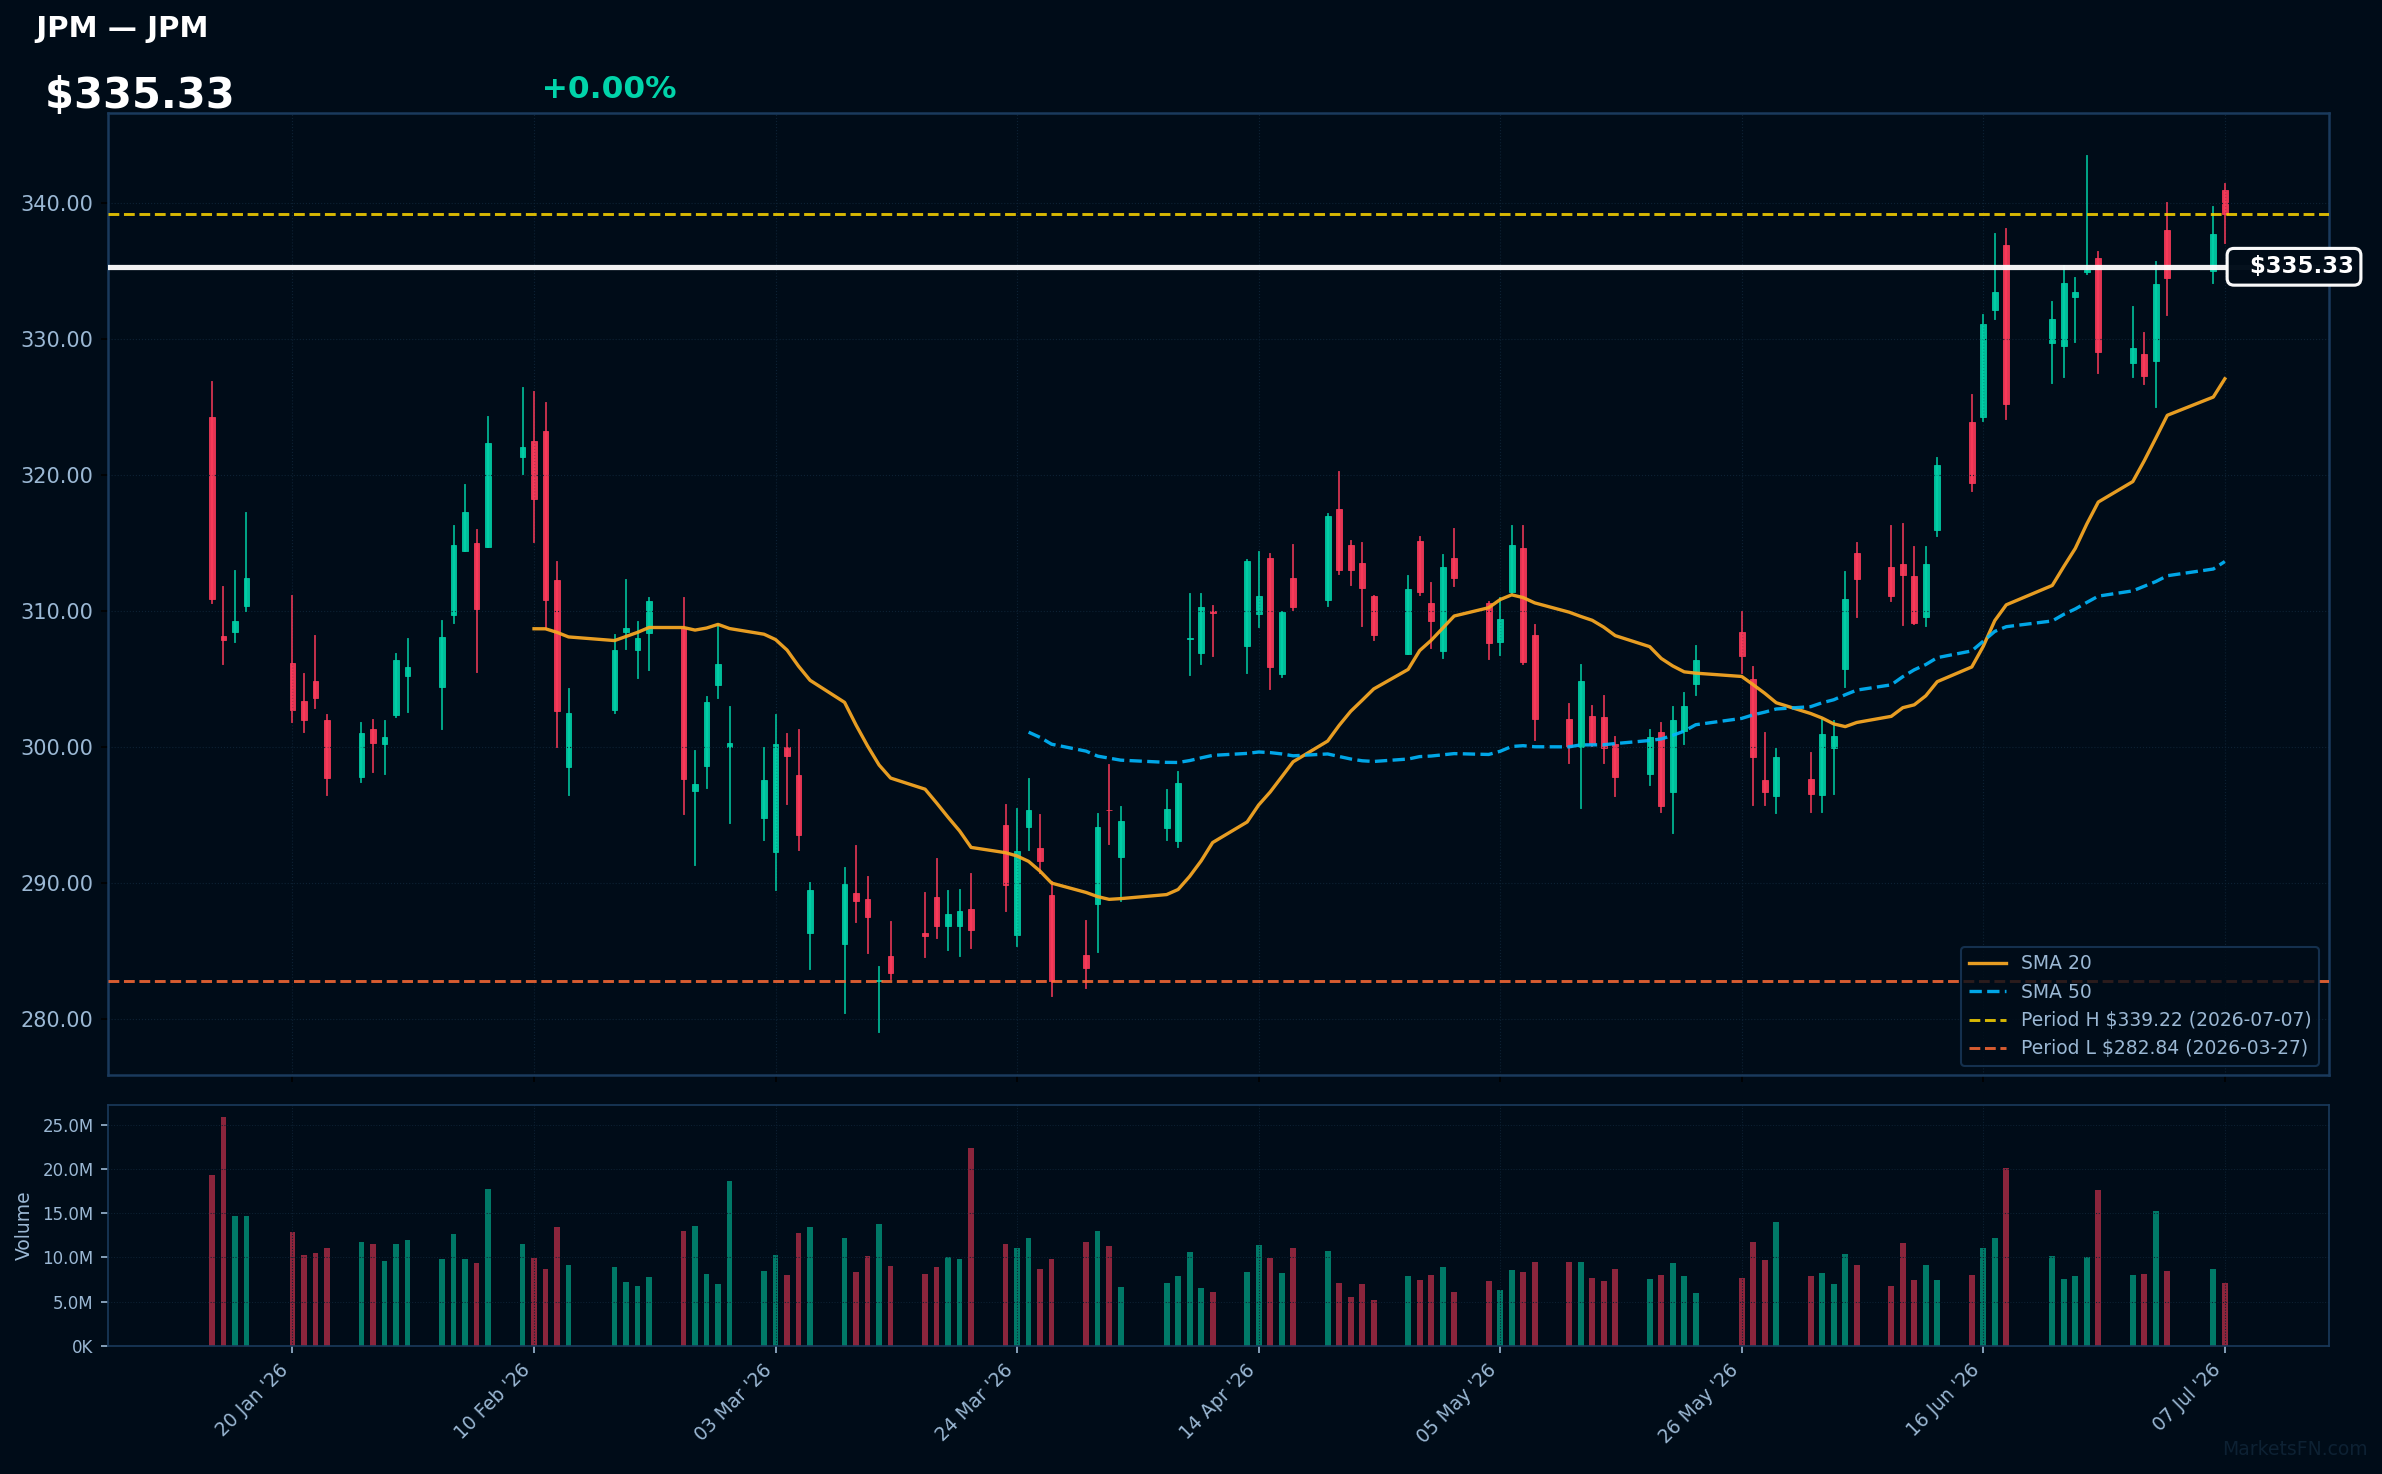
JPM | JPMorgan Chase & Co | Financial | Price Last: $339.22 | % Realized: +4.22% | RSI: 61.7 | % above MA200: +9.8% | Trend: Above MA20, MA50, MA200
JPMorgan Chase & Co is a global financial services firm providing consumer and investment banking, financial transactions processing, asset management, and more. Investors care due to its systemic importance and exposure to global economic trends.
JPMorgan Chase & Co is in a sustained uptrend with price at $335.33, RSI(14) at 61.7, and MA alignment: price > MA20 > MA50 > MA200. It's 0.0% below its 2026 YTD high, indicating potential breakout momentum.
Related headlines
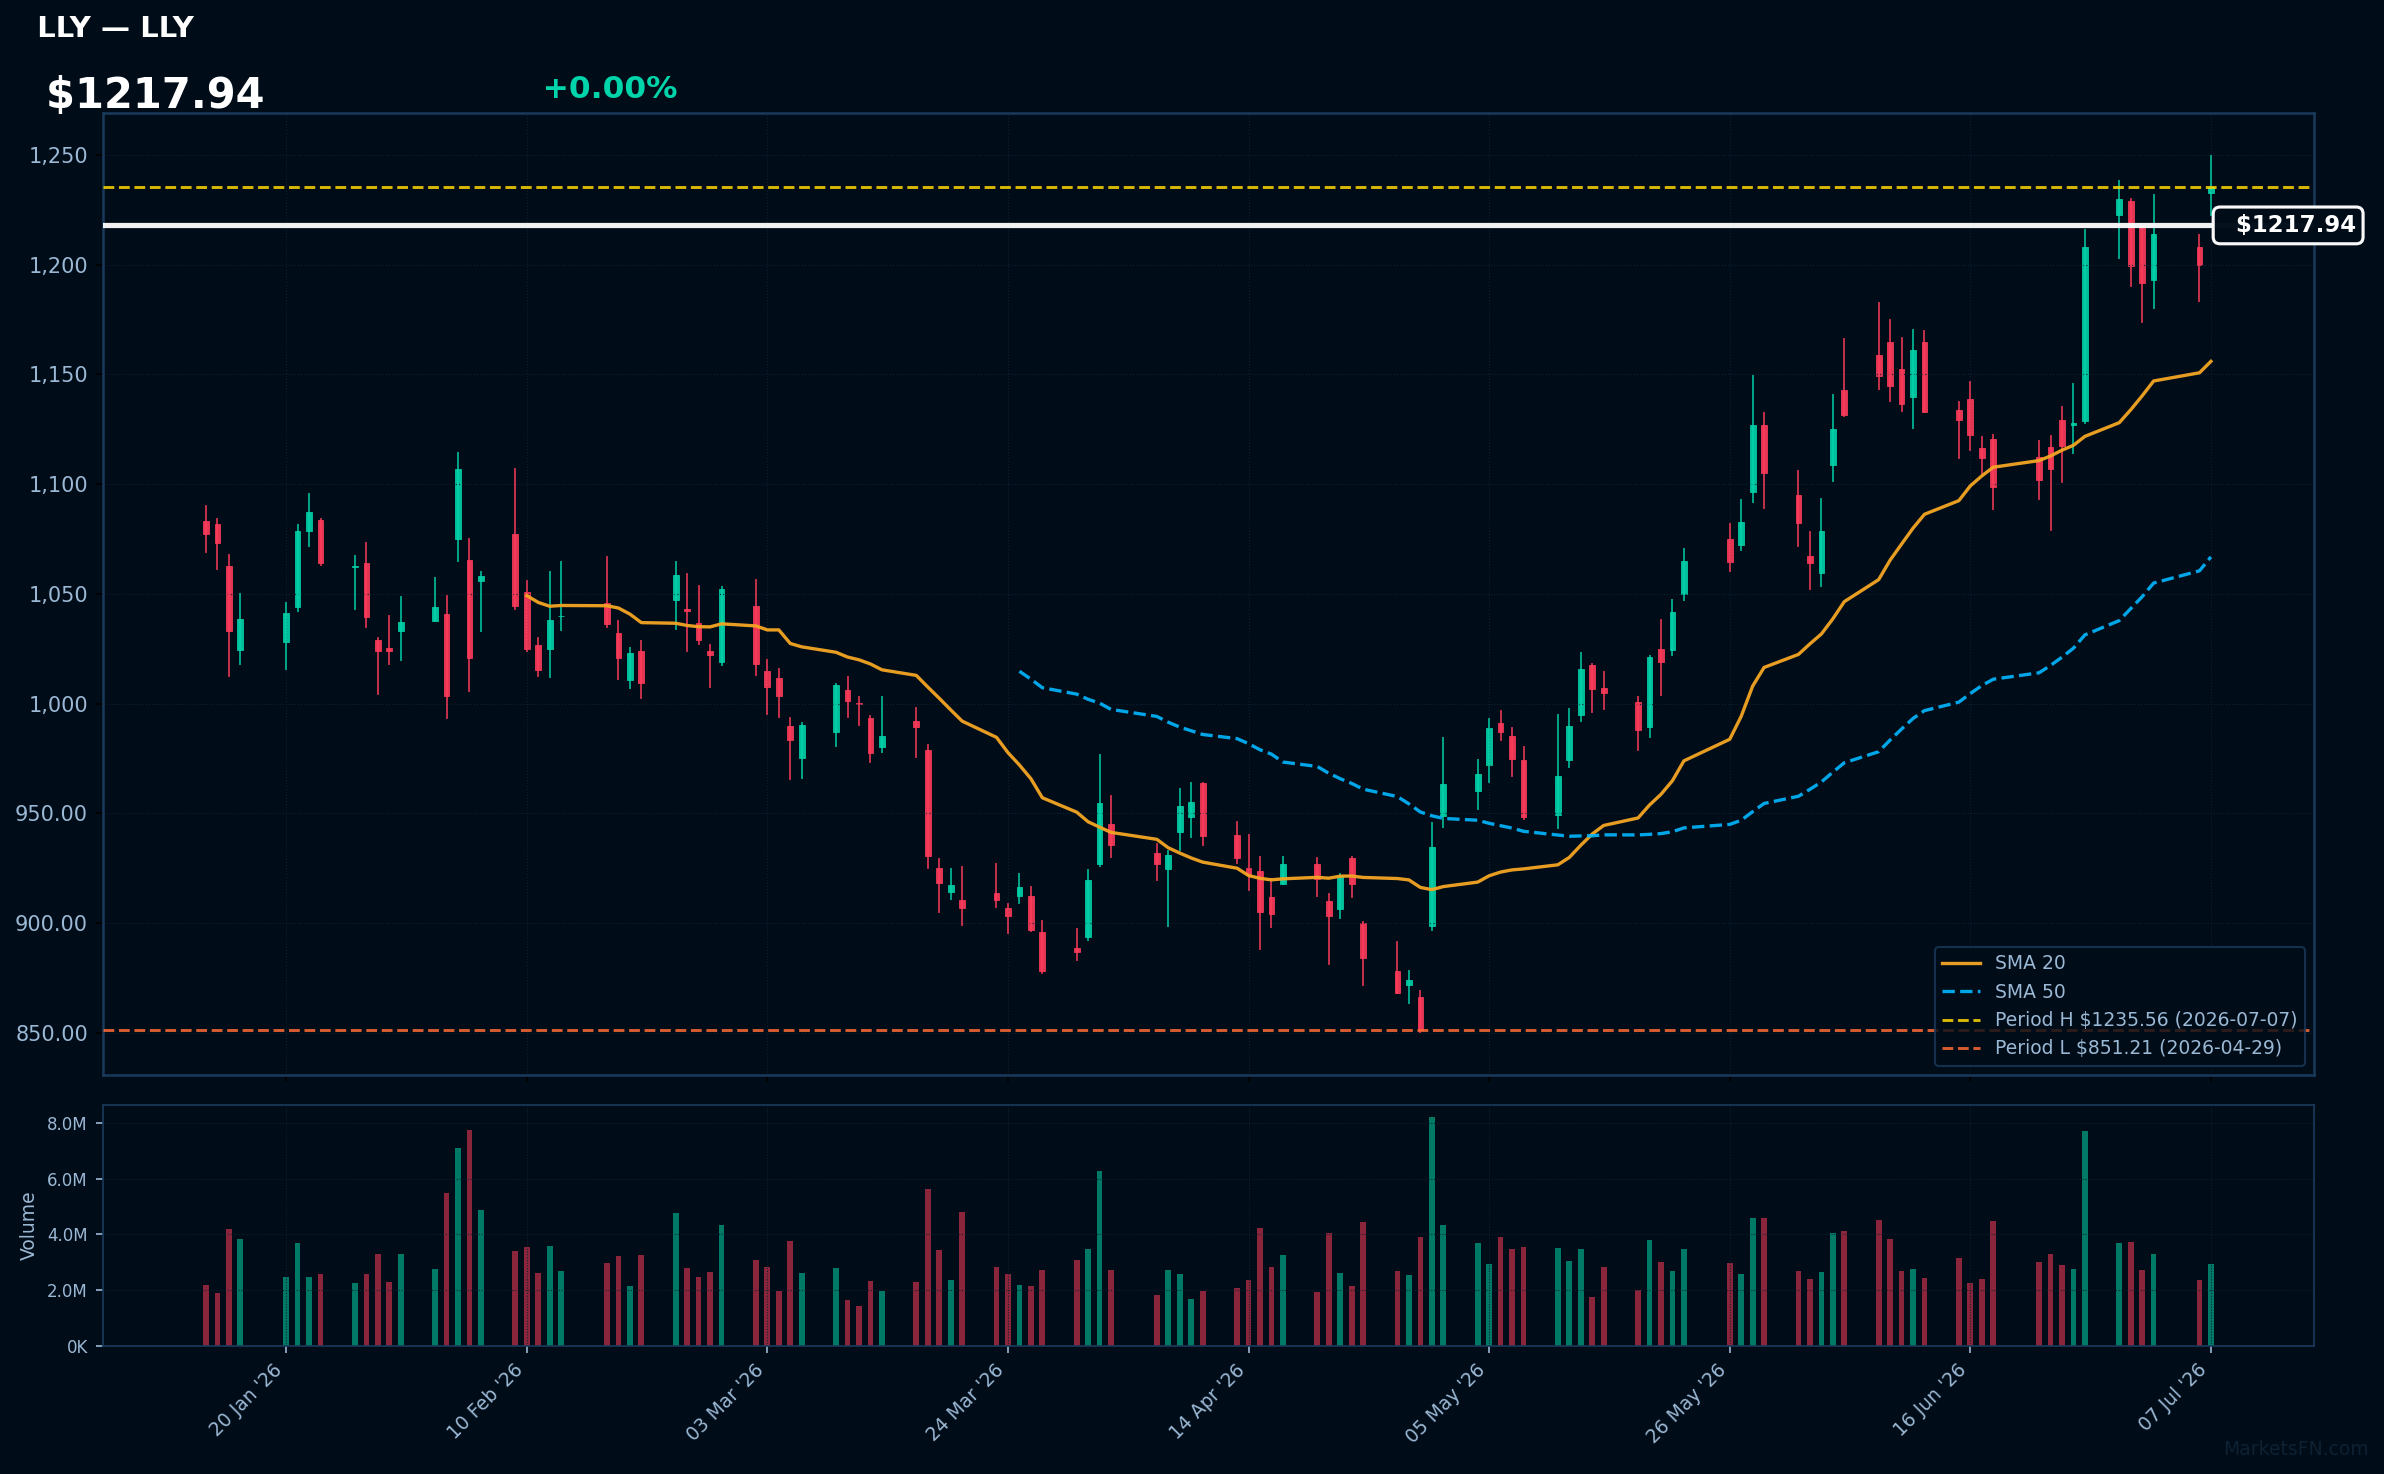
LLY | Lilly(Eli) & Co | Healthcare | Price Last: $1235.56 | % Realized: +14.37% | RSI: 64.1 | % above MA200: +24.6% | Trend: Above MA20, MA50, MA200
Eli Lilly is a pharmaceutical company developing and marketing medicines; investors should care about its pipeline and product sales. Specific products and approvals drive its value.
Lilly's technicals indicate sustained uptrend with price ($1217.94) > MA20 > MA50 > MA200 and RSI(14) at 64.1, nearing a potential breakout at its 2026 YTD high, with 14.4% YTD return, suggesting momentum.
Related headlines
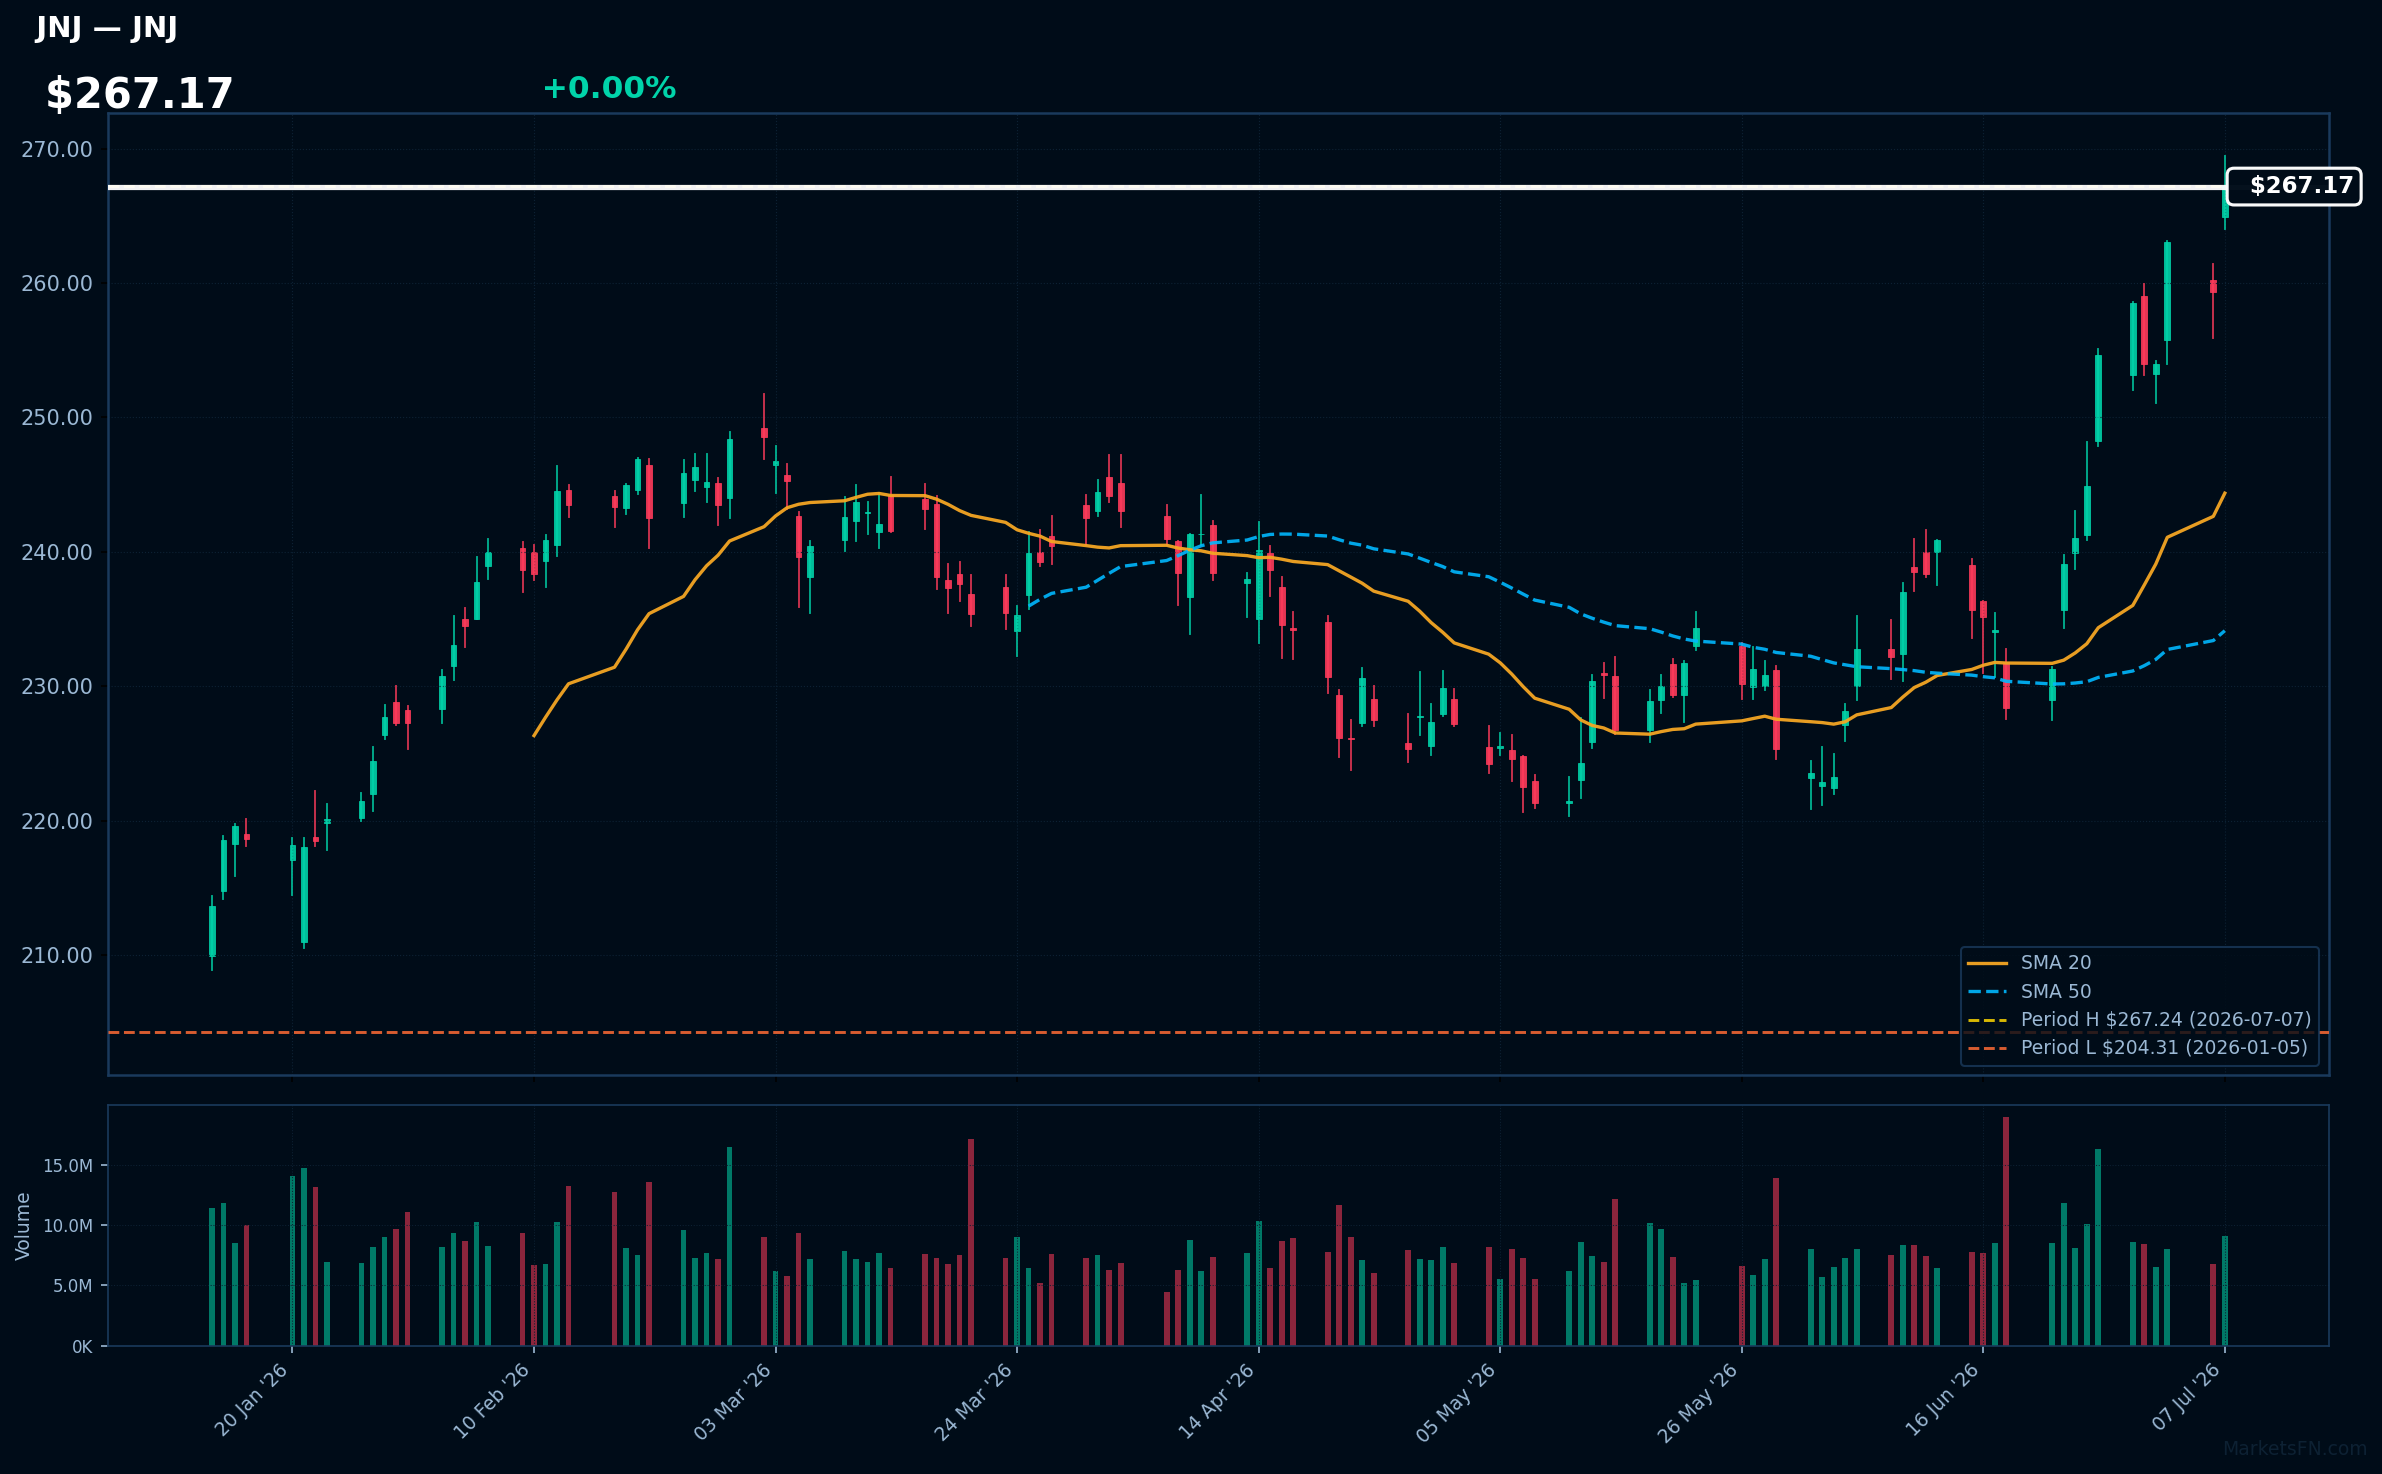
JNJ | Johnson & Johnson | Healthcare | Price Last: $267.24 | % Realized: +28.88% | RSI: 72.3 | % above MA200: +21.3% | Trend: Above MA20, MA50, MA200
Johnson & Johnson is a diversified healthcare company with significant pharmaceutical, medical devices, and consumer products segments. Investors should care about its broad portfolio and innovation pipeline, which drive long-term growth and stability.
JNJ's technicals indicate strong momentum: RSI(14) is 72.3, nearing overbought territory, with a bullish MA alignment (price > MA20 > MA50 > MA200) and 0.0% below its 2026 YTD high, suggesting a potential breakout.
Related headlines
- Johnson & Johnson Announces FDA Approval for the Dual Energy THERMOCOOL SMARTTOUCH SF Platform
- Johnson & Johnson, IBD Stock Of The Day, In Buy Zone Heading Into Earnings
- NAVN, JNJ, CRWD Stocks Hit 52-Week Highs Last Week: What's Driving The Surge?
- JNJ Stock Management Sees A Breakout, The Market Sees A Standoff
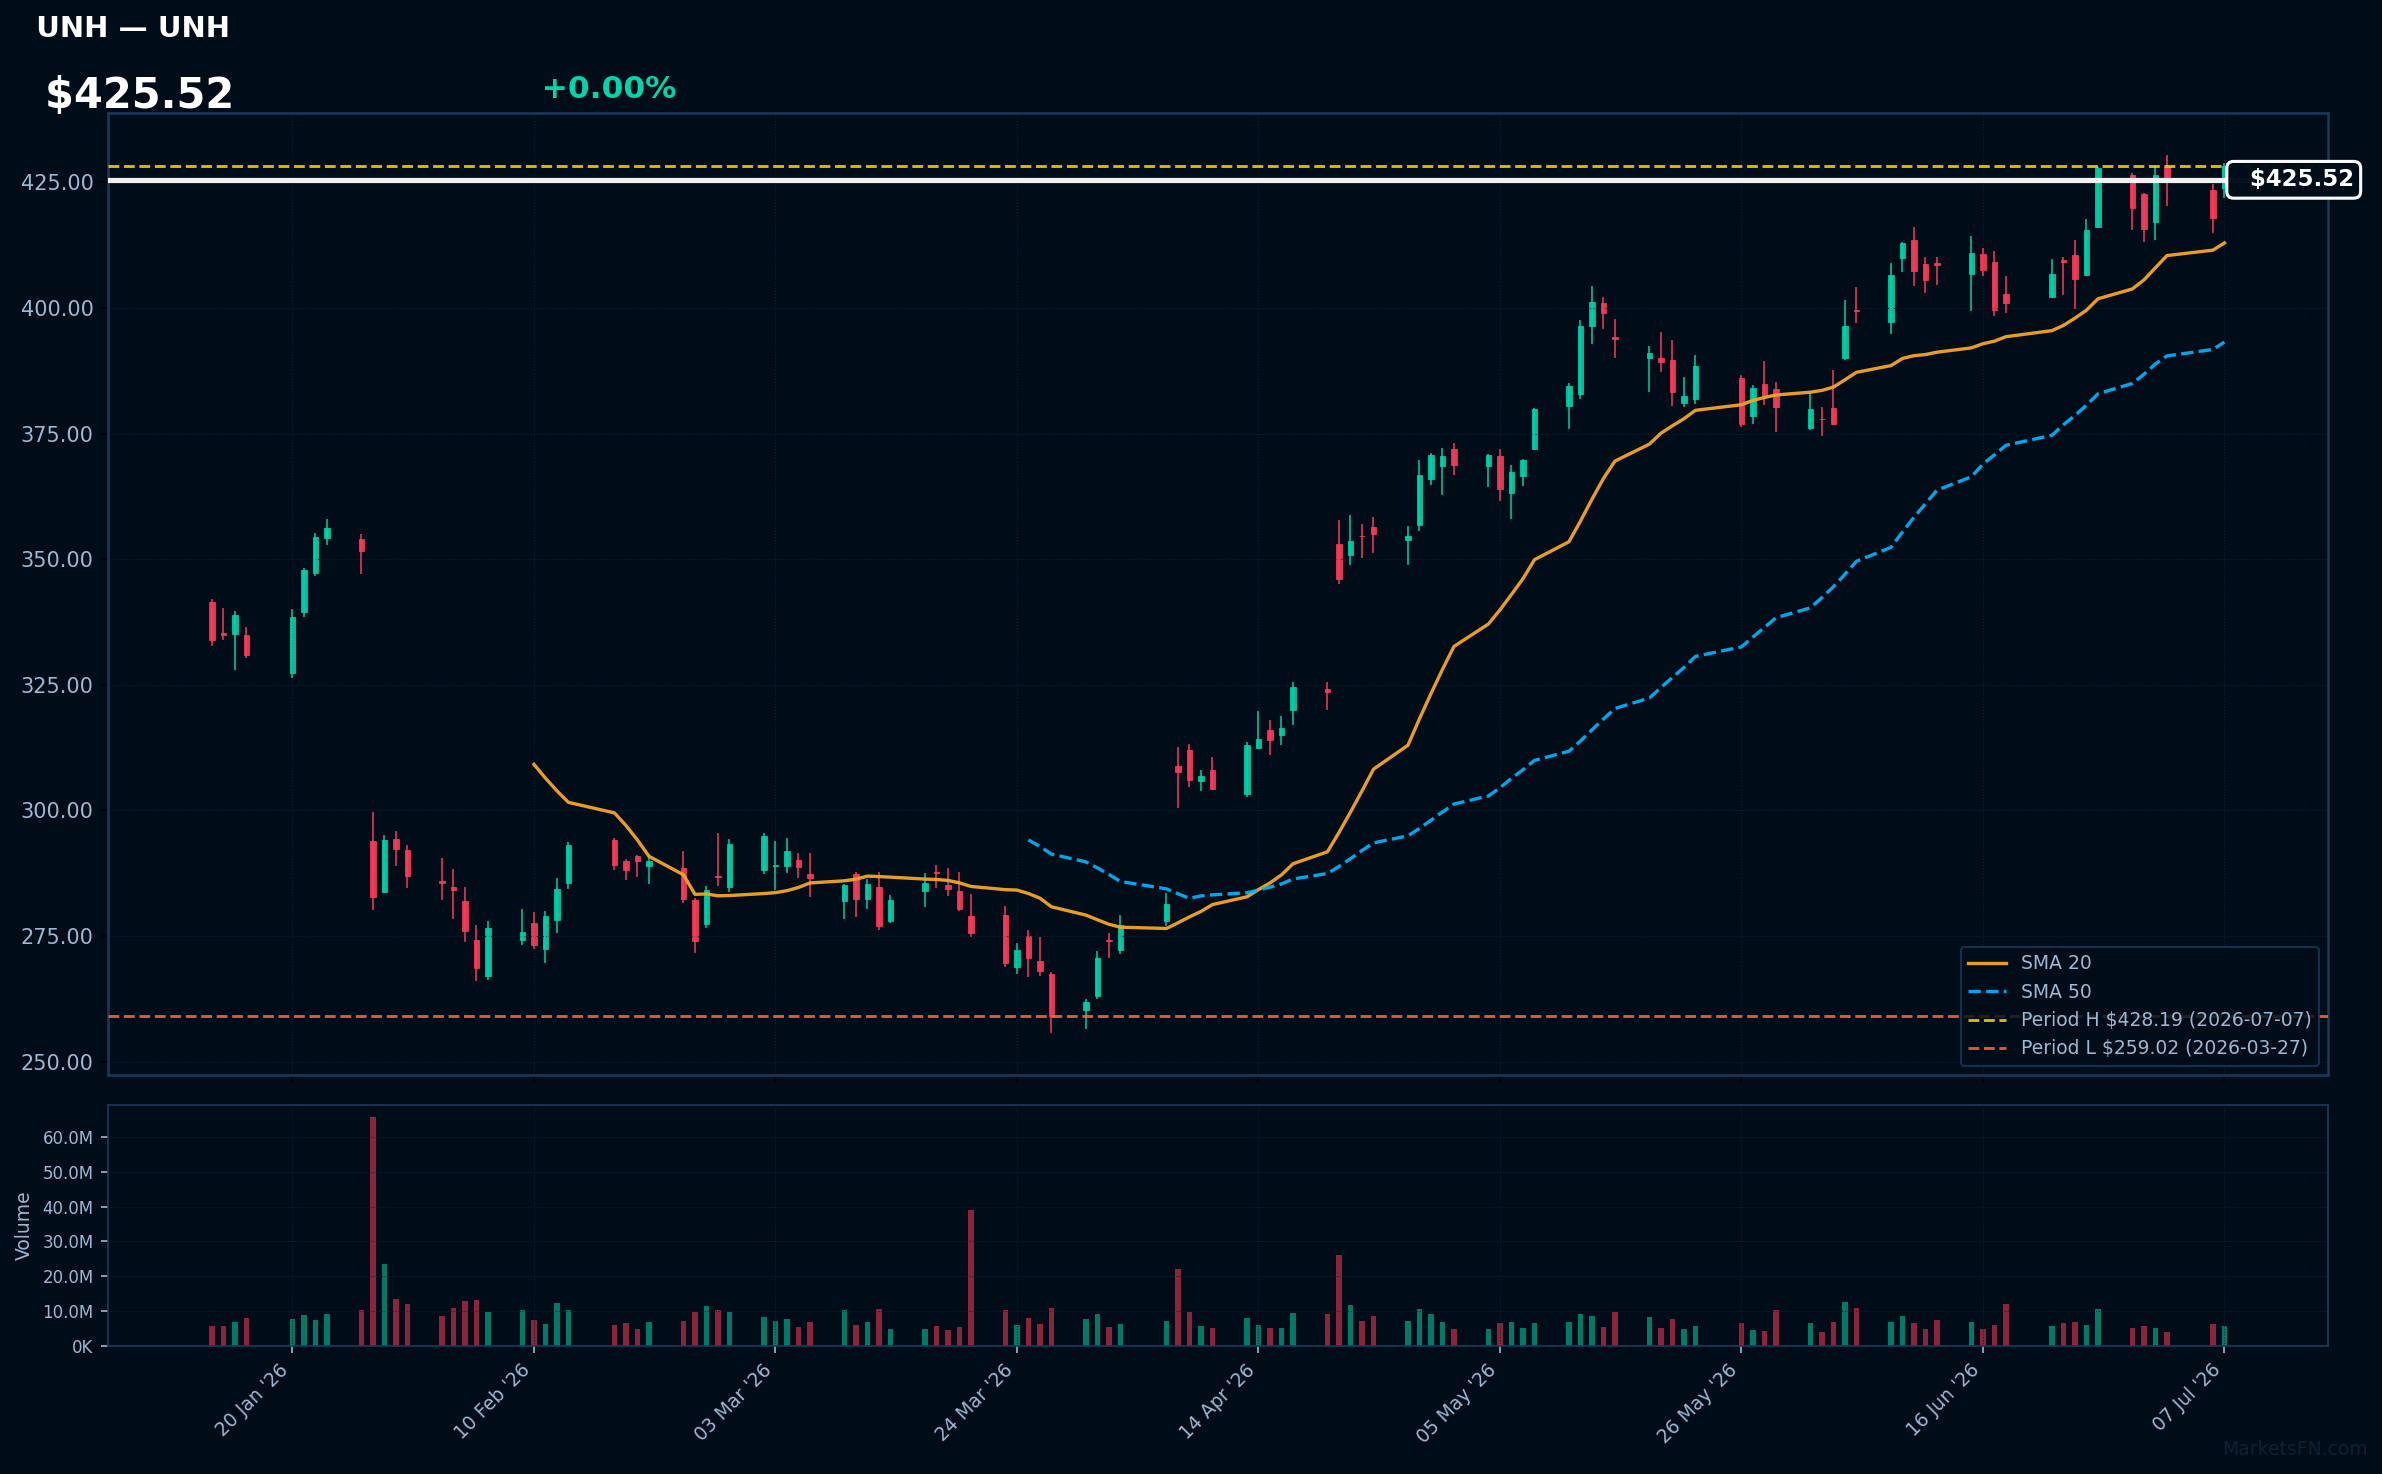
UNH | Unitedhealth Group Inc | Healthcare | Price Last: $428.19 | % Realized: +27.29% | RSI: 61.7 | % above MA200: +26.5% | Trend: Above MA20, MA50, MA200
Unitedhealth Group Inc operates health insurance plans and healthcare services through its UnitedHealthcare and Optum segments, providing coverage to millions and generating revenue through premiums and service fees, making it a significant player in the US healthcare industry.
Unitedhealth Group Inc shows bullish technicals with RSI(14) at 61.7, price above MA20, MA50, and MA200, indicating sustained uptrend. The stock is 0.0% below its 2026 YTD high, nearing a potential breakout, with 27.3% 2026 YTD return, signaling strong momentum.
Related headlines
- External audit of UnitedHealth senior home visits finds most diagnoses supported by medical data
- Guardants Shield colon cancer blood test snags UnitedHealth coverage
- GH Stock At Over 5-Year Highs Whats The UnitedHealth Connection?
- UnitedHealthcare Community Plan of Nebraska Invests $385,000 to Expand Programs to Support Older Adults, Caregivers and People with Disabilities
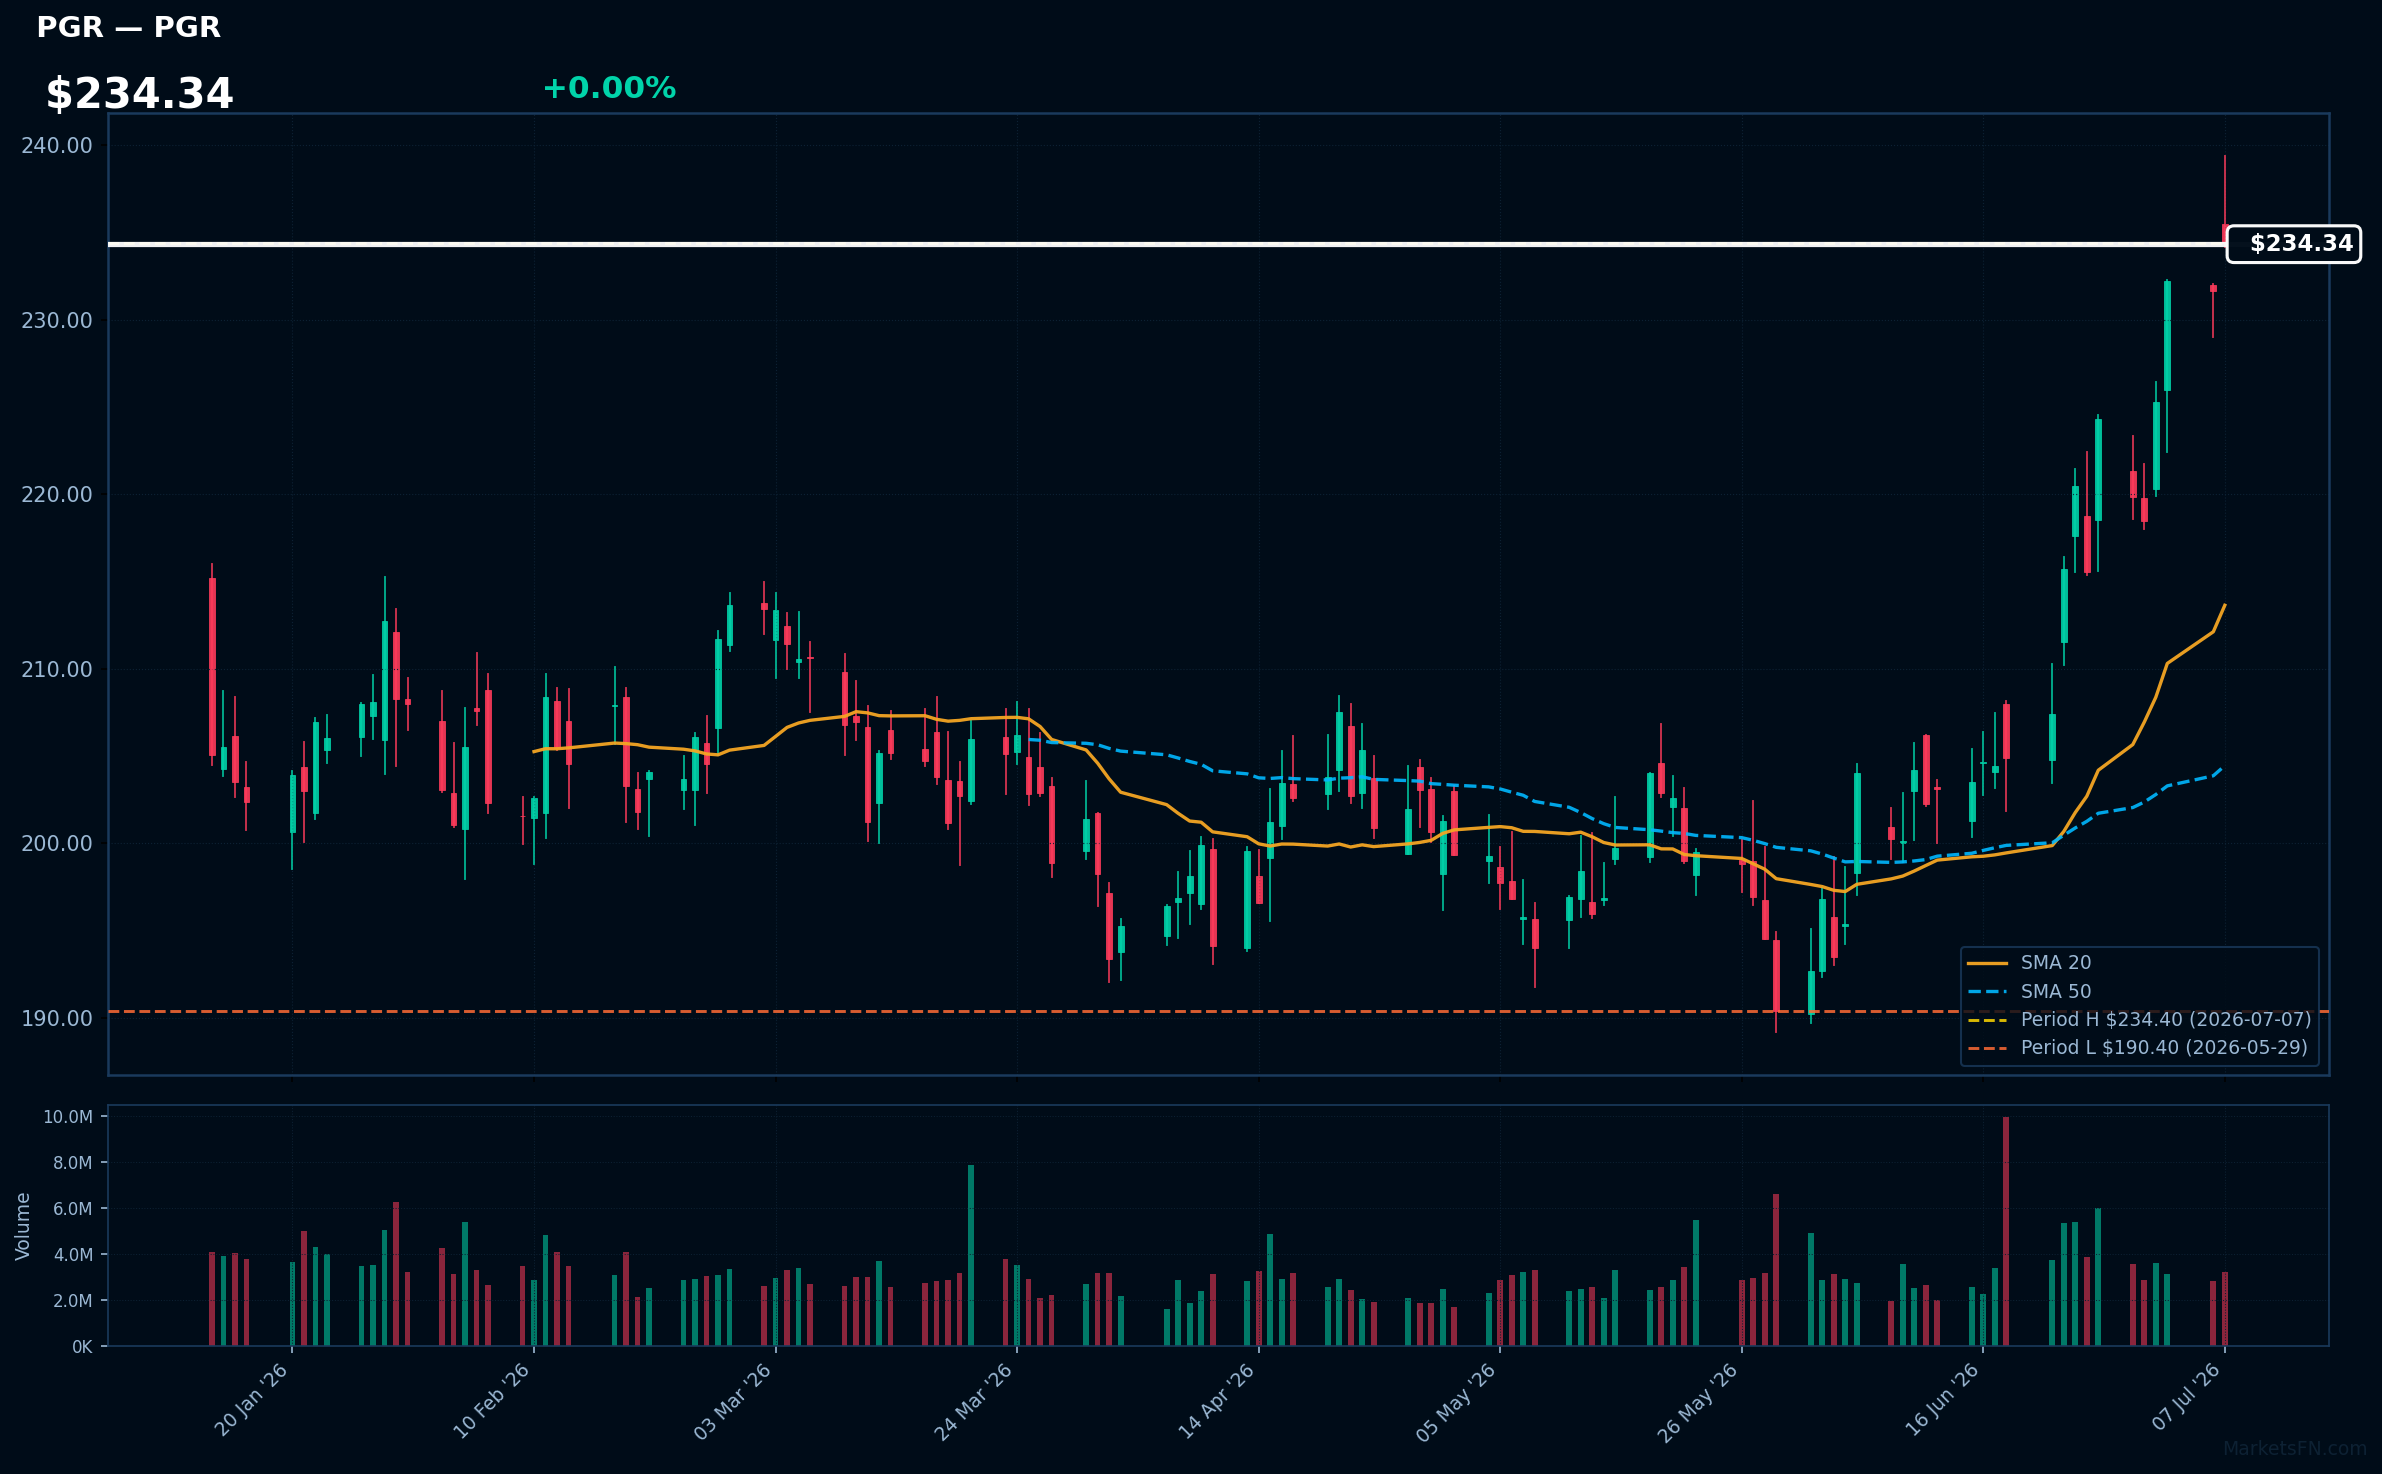
PGR | Progressive Corp | Financial | Price Last: $234.40 | % Realized: +10.50% | RSI: 73.1 | % above MA200: +10.0% | Trend: Above MA20, MA50, MA200
Progressive Corp is a leading auto insurance provider with a significant market presence, offering a range of insurance products. Investors care due to its strong market position and potential for growth in the insurance sector.
The stock's RSI(14) is 73.1, indicating strong momentum as it's above MA20/MA50/MA200, with price at $234.34, near its 2026 YTD high, up 10.5% YTD, suggesting continued upward pressure.
Related headlines
📉 Nearest to 2026 Low
Sectors represented: Consumer Cyclical (3), Communication Services (1), Basic Materials (1)
| Ticker | Company | Sector | Price Last | % Realized | 2026 YTD Low Date | RSI | % above MA200 | Trend |
|---|---|---|---|---|---|---|---|---|
| LVS | Las Vegas Sands Corp | Consumer Cyclical | $46.06 | -29.37% | 2026-07-07 | 38.7 | -18.3% | Below MA20, MA50, MA200 |
| WBD | Warner Bros. Discovery Inc | Communication Services | $26.12 | -8.38% | 2026-07-06 | 43.5 | +1.1% | Above MA200 · Below MA20, MA50 |
| HAS | Hasbro, Inc | Consumer Cyclical | $76.73 | -7.52% | 2026-07-07 | 25.2 | -11.2% | Below MA20, MA50, MA200 |
| ALB | Albemarle Corp | Basic Materials | $129.02 | -10.36% | 2026-07-07 | 28.5 | -13.8% | Below MA20, MA50, MA200 |
| ULTA | Ulta Beauty Inc | Consumer Cyclical | $453.78 | -26.81% | 2026-06-17 | 38.7 | -19.0% | Below MA20, MA50, MA200 |
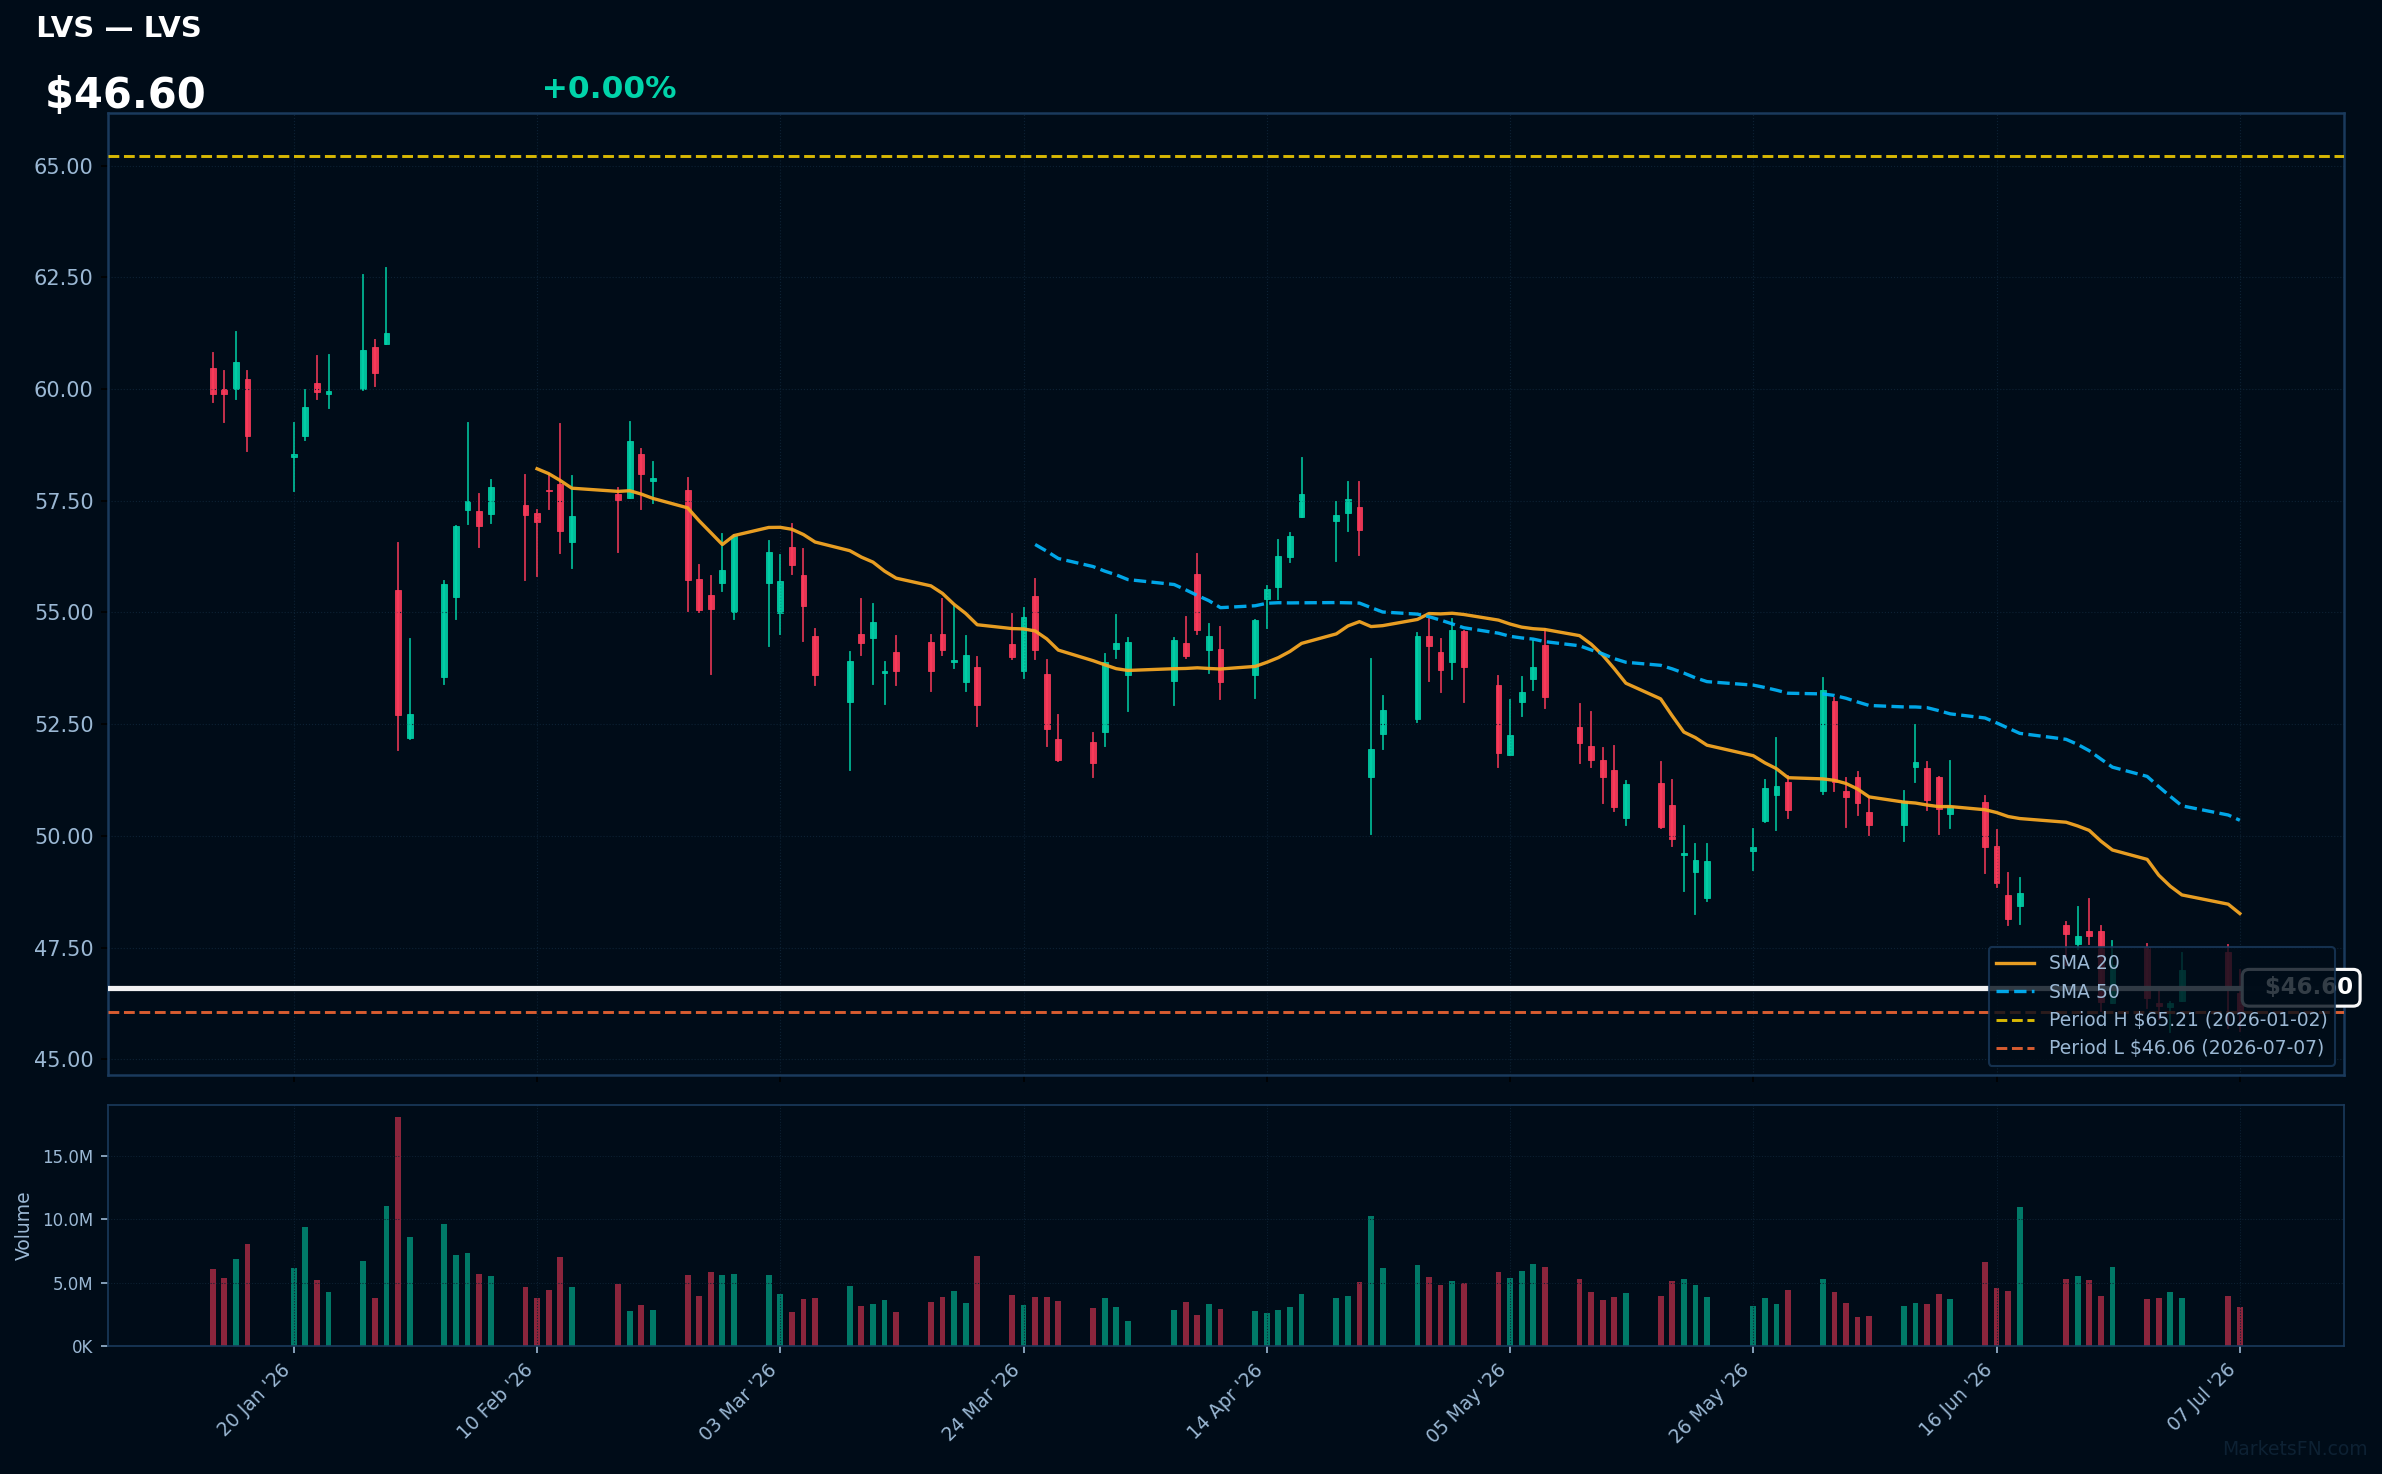
LVS | Las Vegas Sands Corp | Consumer Cyclical | Price Last: $46.06 | % Realized: -29.37% | RSI: 38.7 | % above MA200: -18.3% | Trend: Below MA20, MA50, MA200
Las Vegas Sands Corp operates integrated resorts, generating revenue primarily from casino gaming, hotel rooms, and entertainment. Investors should care because its performance reflects consumer spending and travel trends, making it a barometer for the leisure and hospitality sector.
The stock is in a sustained downtrend with price ($46.60) below MA20, MA50, and MA200. RSI(14) is 38.7, nearing oversold territory. Testing its 2026 YTD low, it has lost 29.4% YTD, indicating potential further downside risk.
Related headlines
- Las Vegas Sands Continues its Commitment to Ending Youth Homelessness in Nevada with a $300,000 Donation to Nevada Partnership for Homeless Youth
- Las Vegas Sands Donates $150,000 to The LGBTQ+ Center of Las Vegas for a Workforce Development Program Supporting Housing-Insecure Youth
- MGMs $18B Bid Proves Las Vegas Sands Is Undervalued
- Las Vegas Sands Continues on the Dow Jones Best-in-Class Indices for World and North America
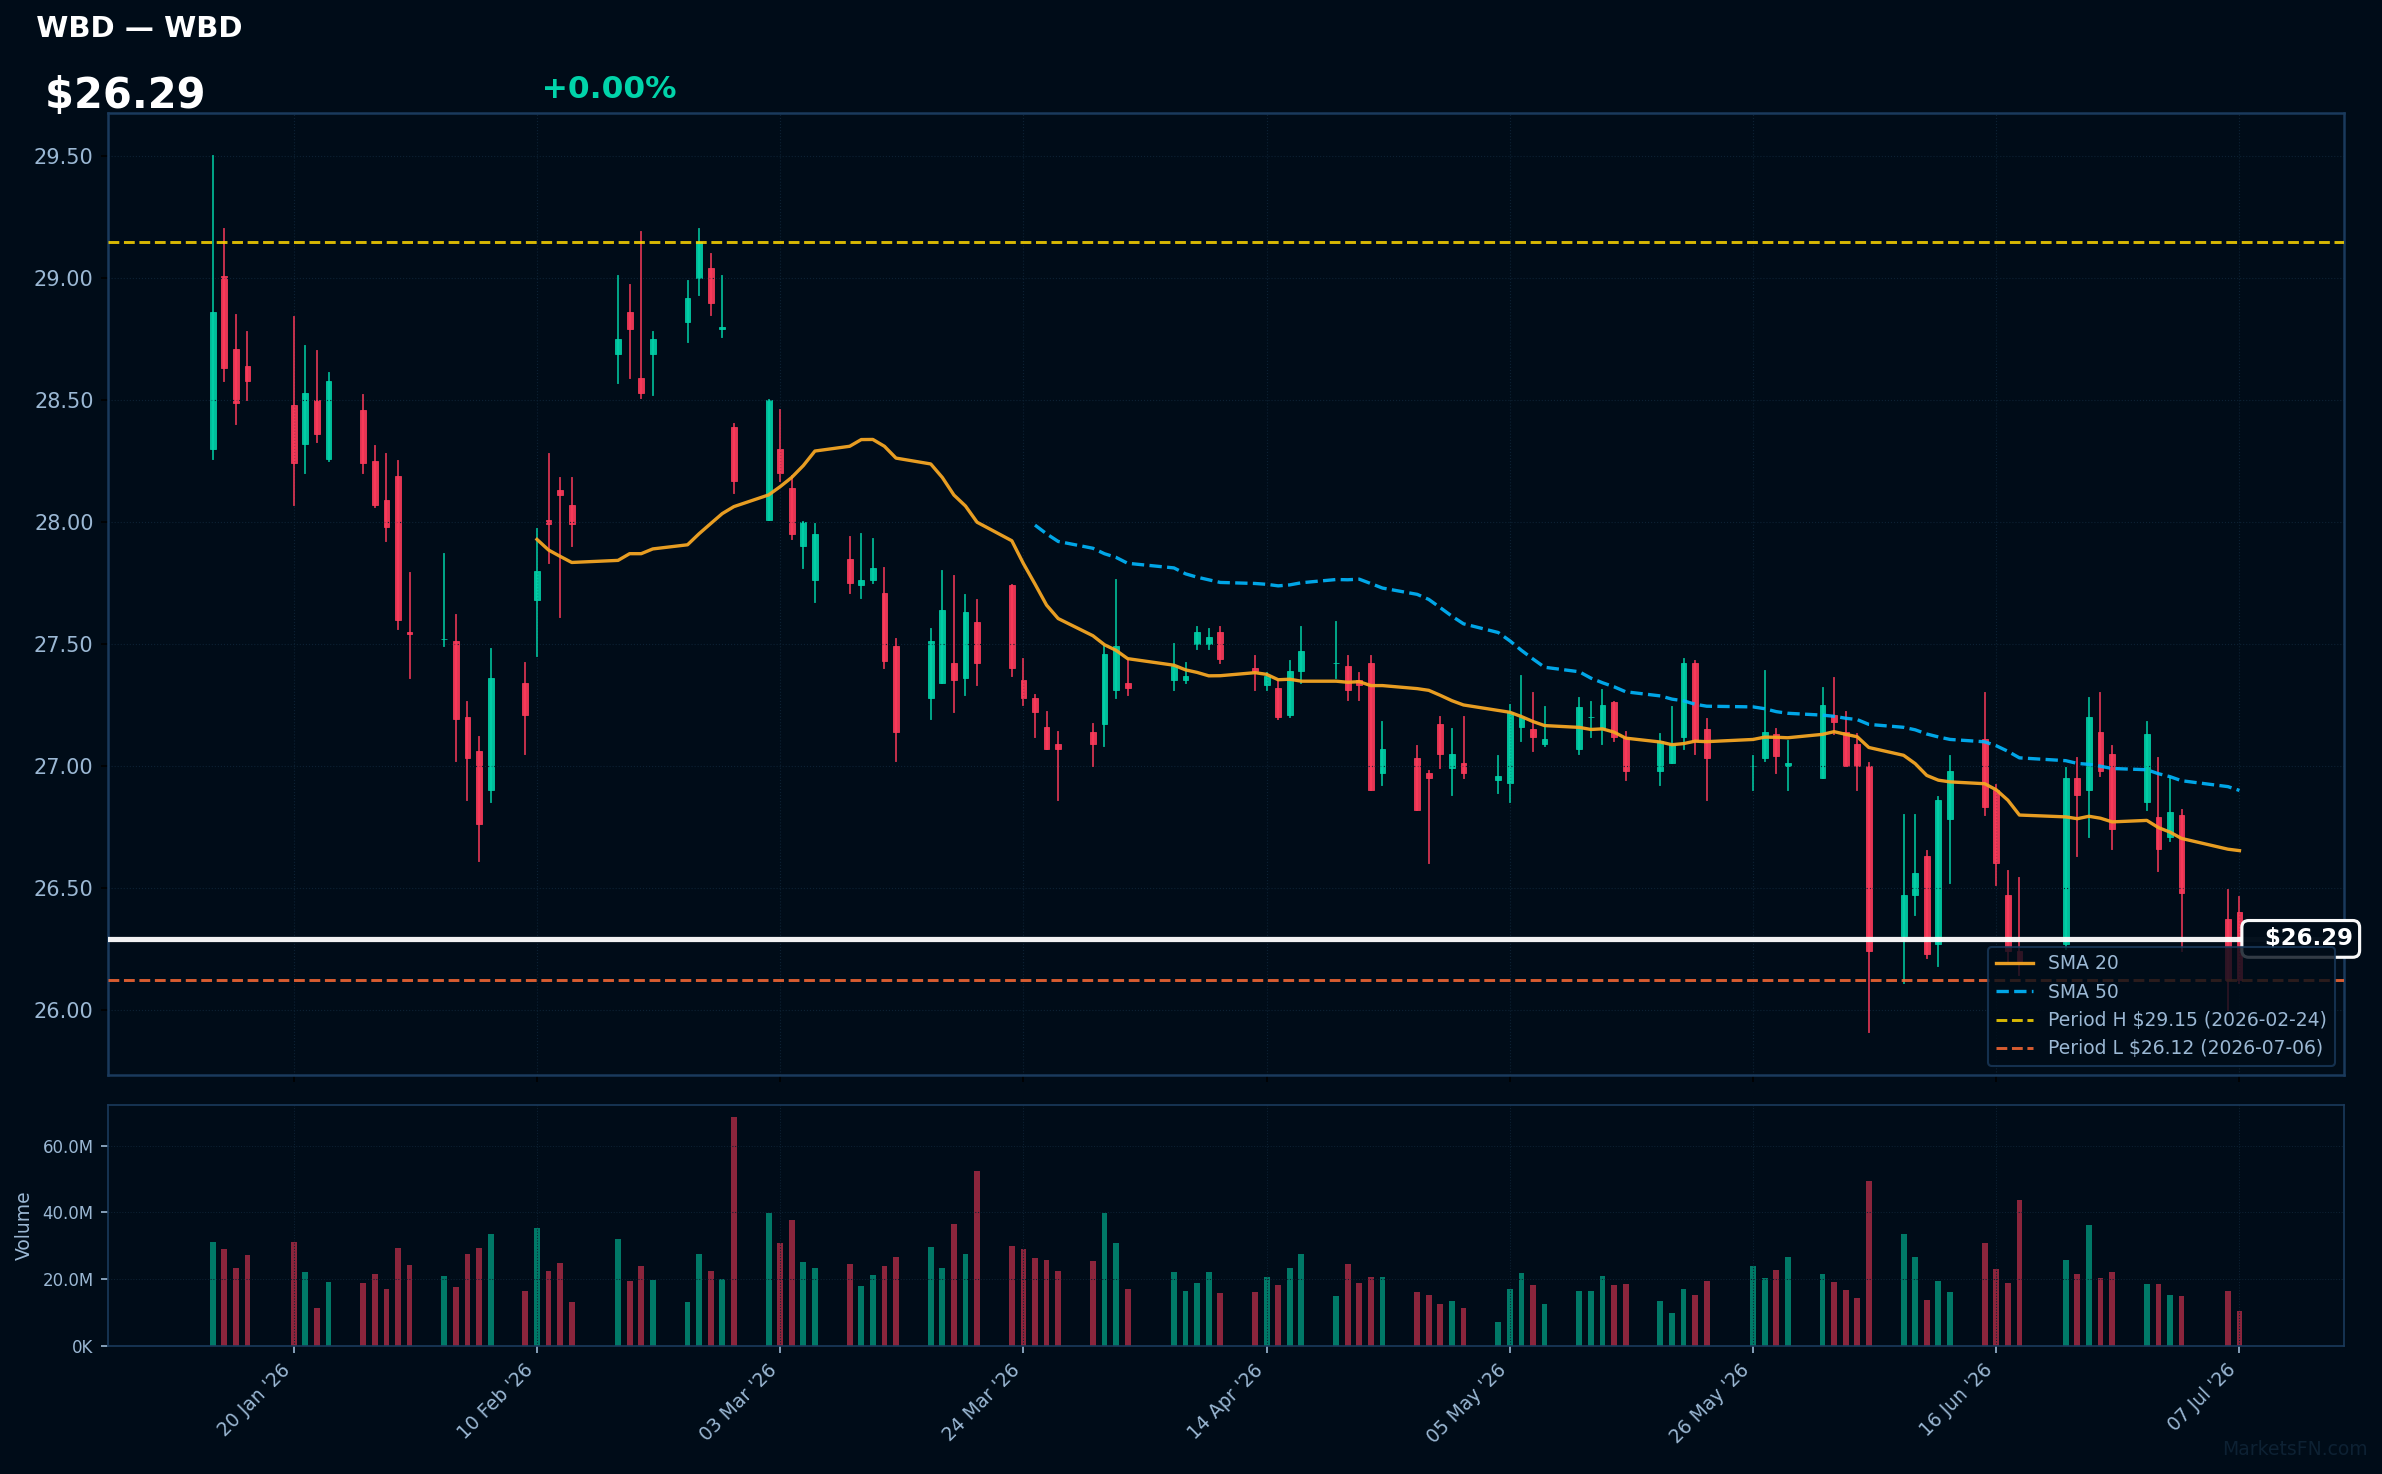
WBD | Warner Bros. Discovery Inc | Communication Services | Price Last: $26.12 | % Realized: -8.38% | RSI: 43.5 | % above MA200: +1.1% | Trend: Above MA200 · Below MA20, MA50
Warner Bros. Discovery Inc is a media conglomerate owning major entertainment brands like HBO, Warner Bros., and Discovery Channel, generating revenue through content creation, distribution, and advertising, making it a significant player in the global media landscape.
WBD's technicals show mixed signals: RSI(14) at 43.5 indicates neutral momentum, while price above MA200 but below MA20/MA50 suggests conflicting trends; it's testing major support at its 2026 YTD low, down 8.4% YTD.
Related headlines
- Warner Bros. Slips on California Lawsuit Report
- Paramount's $110 Billion Warner Deal Nears EU Decision
- Paramount Skydance Offers Concessions to Facilitate EU Approval of $81 Billion Warner Bros Deal
- PSKY Stock Inches Higher Premarket: Paramount Reportedly Offers EU Concessions To Advance $110B Warner Bros Deal
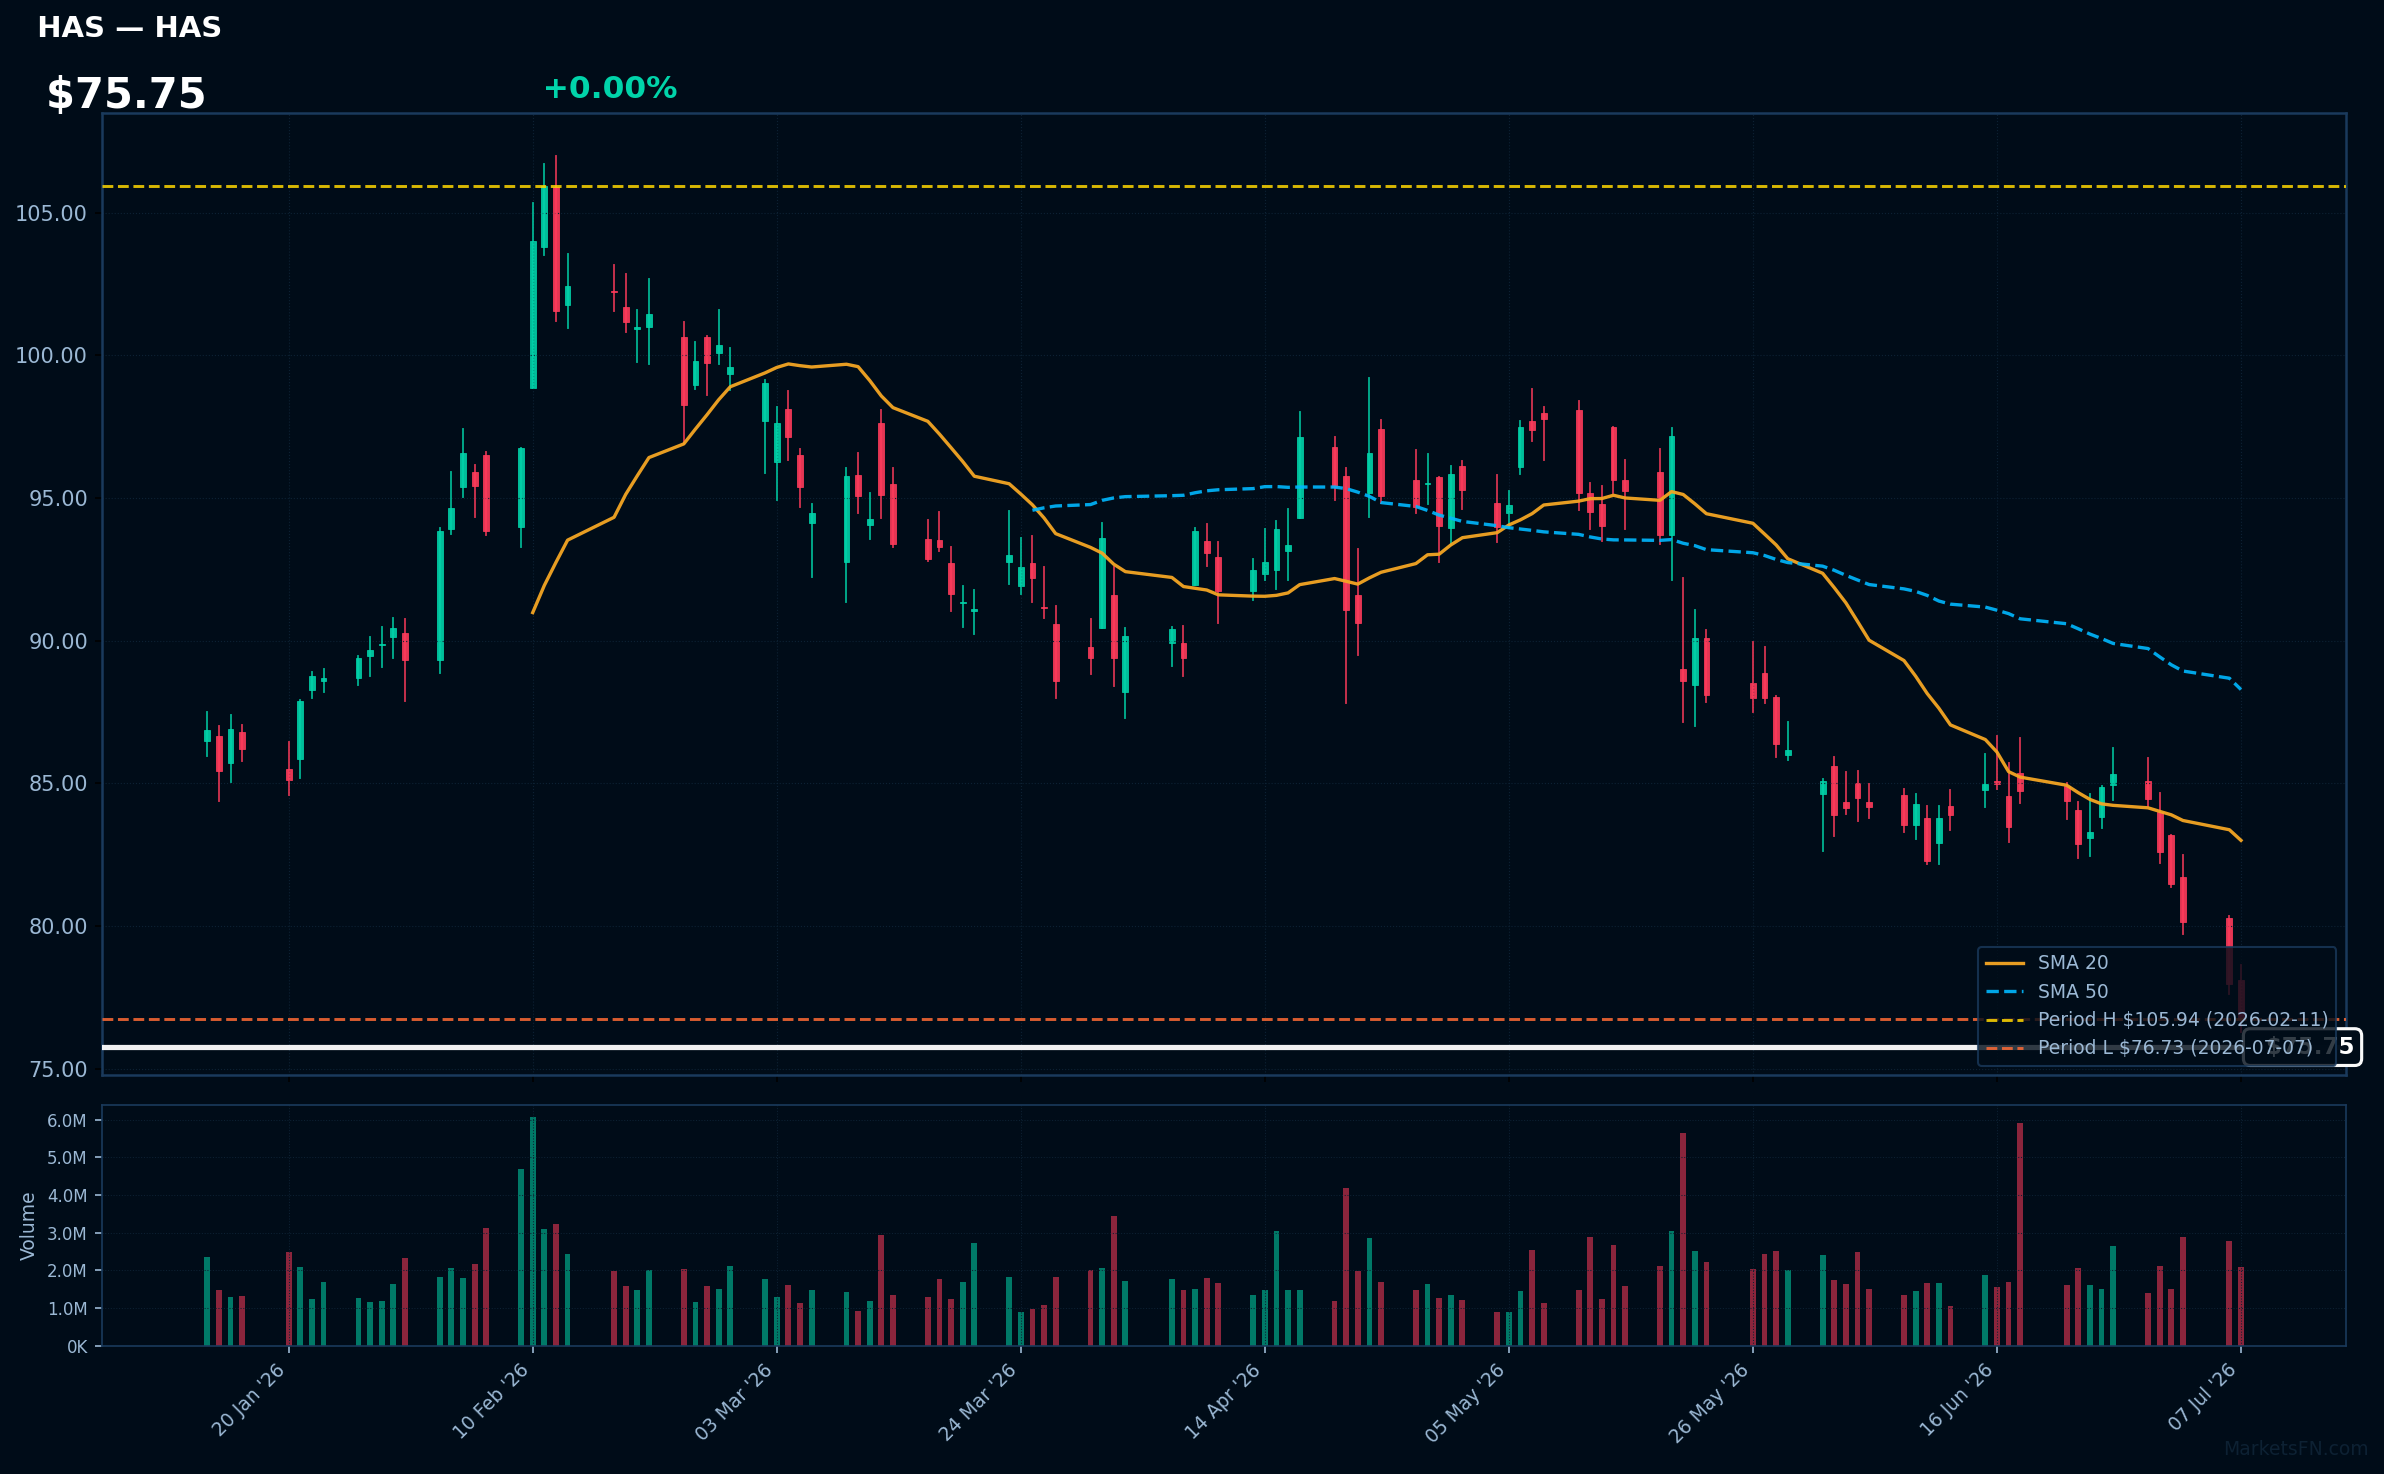
HAS | Hasbro, Inc | Consumer Cyclical | Price Last: $76.73 | % Realized: -7.52% | RSI: 25.2 | % above MA200: -11.2% | Trend: Below MA20, MA50, MA200
Hasbro, Inc (HAS) is a global play and entertainment company that designs, manufactures, and markets consumer products, including brands like Transformers, My Little Pony, and Nerf. Investors should care about its ability to innovate and maintain brand relevance in a competitive toy market.
Hasbro's technical situation indicates a potential warning sign with an RSI(14) of 25.2, suggesting oversold conditions, and the stock price below MA20, MA50, and MA200, showing bearish alignment. It's testing major support at its 2026 YTD low.
Related headlines
- Hasbro to Announce Second Quarter 2026 Earnings on July 21, 2026
- Hasbro Named to The Civic 50 for 14th Consecutive Year, Extending Unmatched Record of Corporate Citizenship Leadership
- Why Hasbros Gina Goetter sees finance and operations as one role
- Optimus Prime will take your call: Hasbro leans into AI-driven licensing
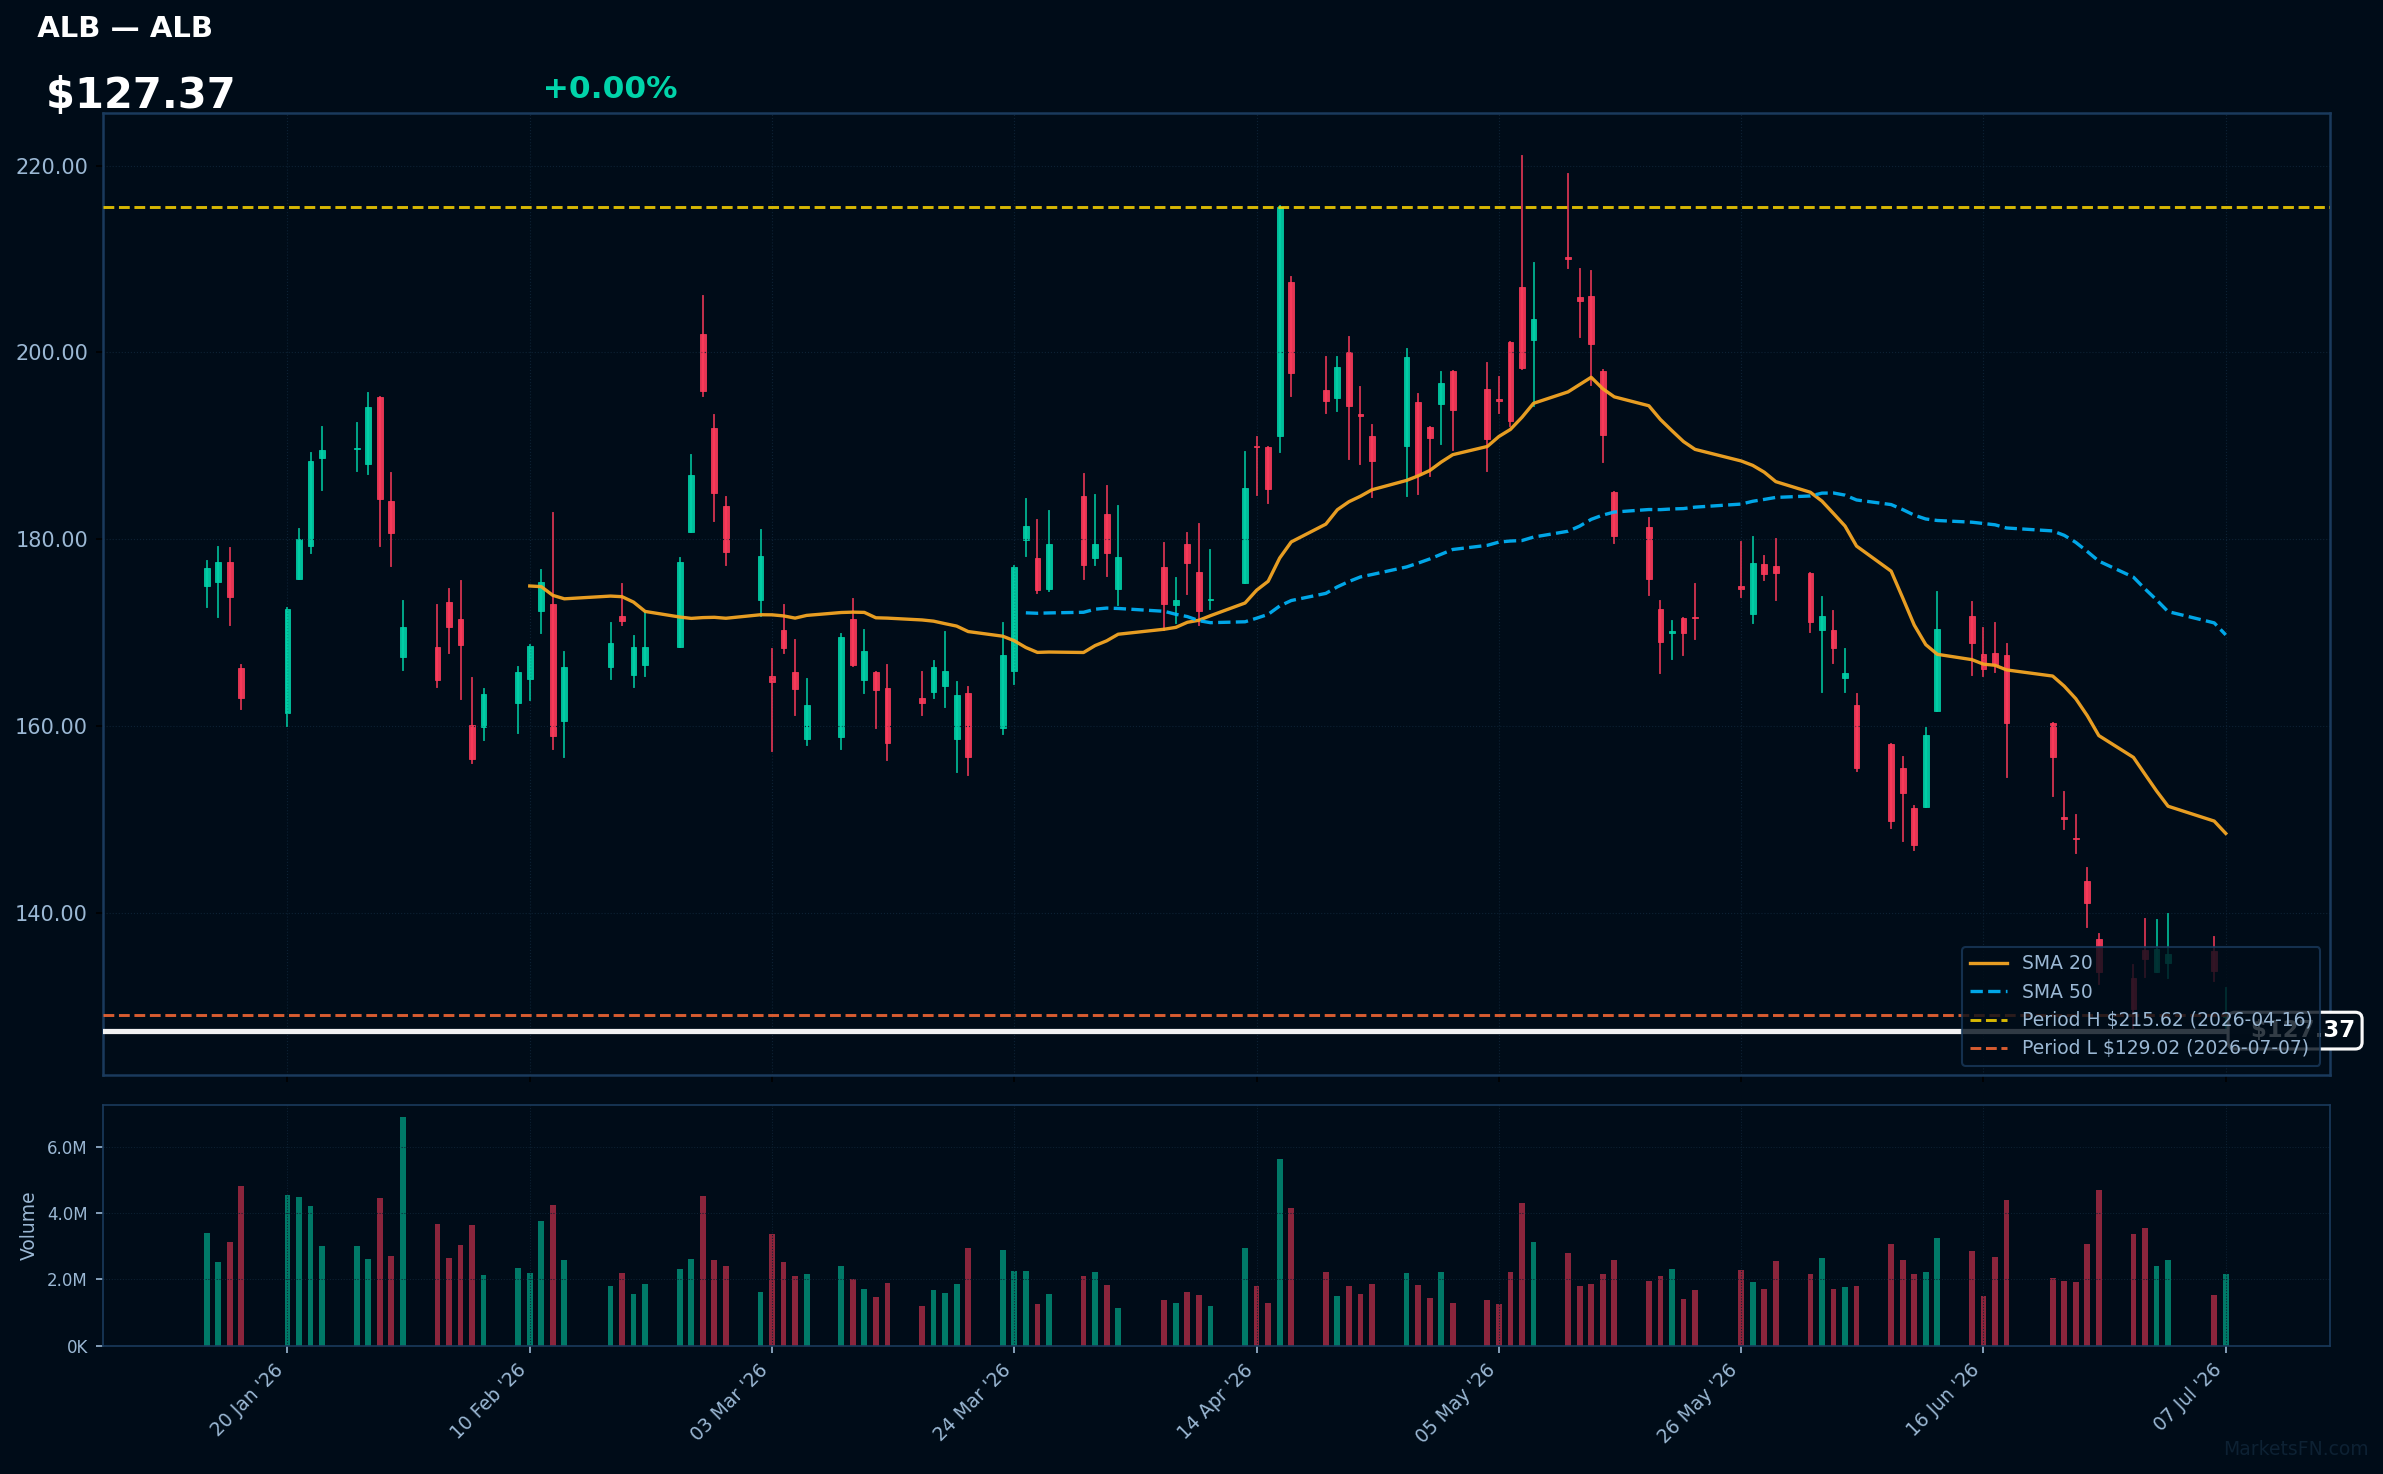
ALB | Albemarle Corp | Basic Materials | Price Last: $129.02 | % Realized: -10.36% | RSI: 28.5 | % above MA200: -13.8% | Trend: Below MA20, MA50, MA200
Albemarle Corp (ALB) is a leading producer of lithium, a critical component in electric vehicle batteries. Investors should care due to its key role in the energy transition and growing demand for lithium-ion batteries.
ALB's RSI(14) is 28.5, indicating oversold conditions. It's below MA20, MA50, and MA200, showing mixed signals. The stock is at its 2026 YTD low, testing major support, with a -10.4% YTD return, suggesting a potential warning sign.
Related headlines
- Albemarle Corporation to Release Second Quarter 2026 Earnings Results on Wednesday, August 5, 2026
- Albemarle Corp. stock outperforms competitors on strong trading day
- Albemarle Corp. stock underperforms Friday when compared to competitors
- Albemarle Corp. stock underperforms Thursday when compared to competitors
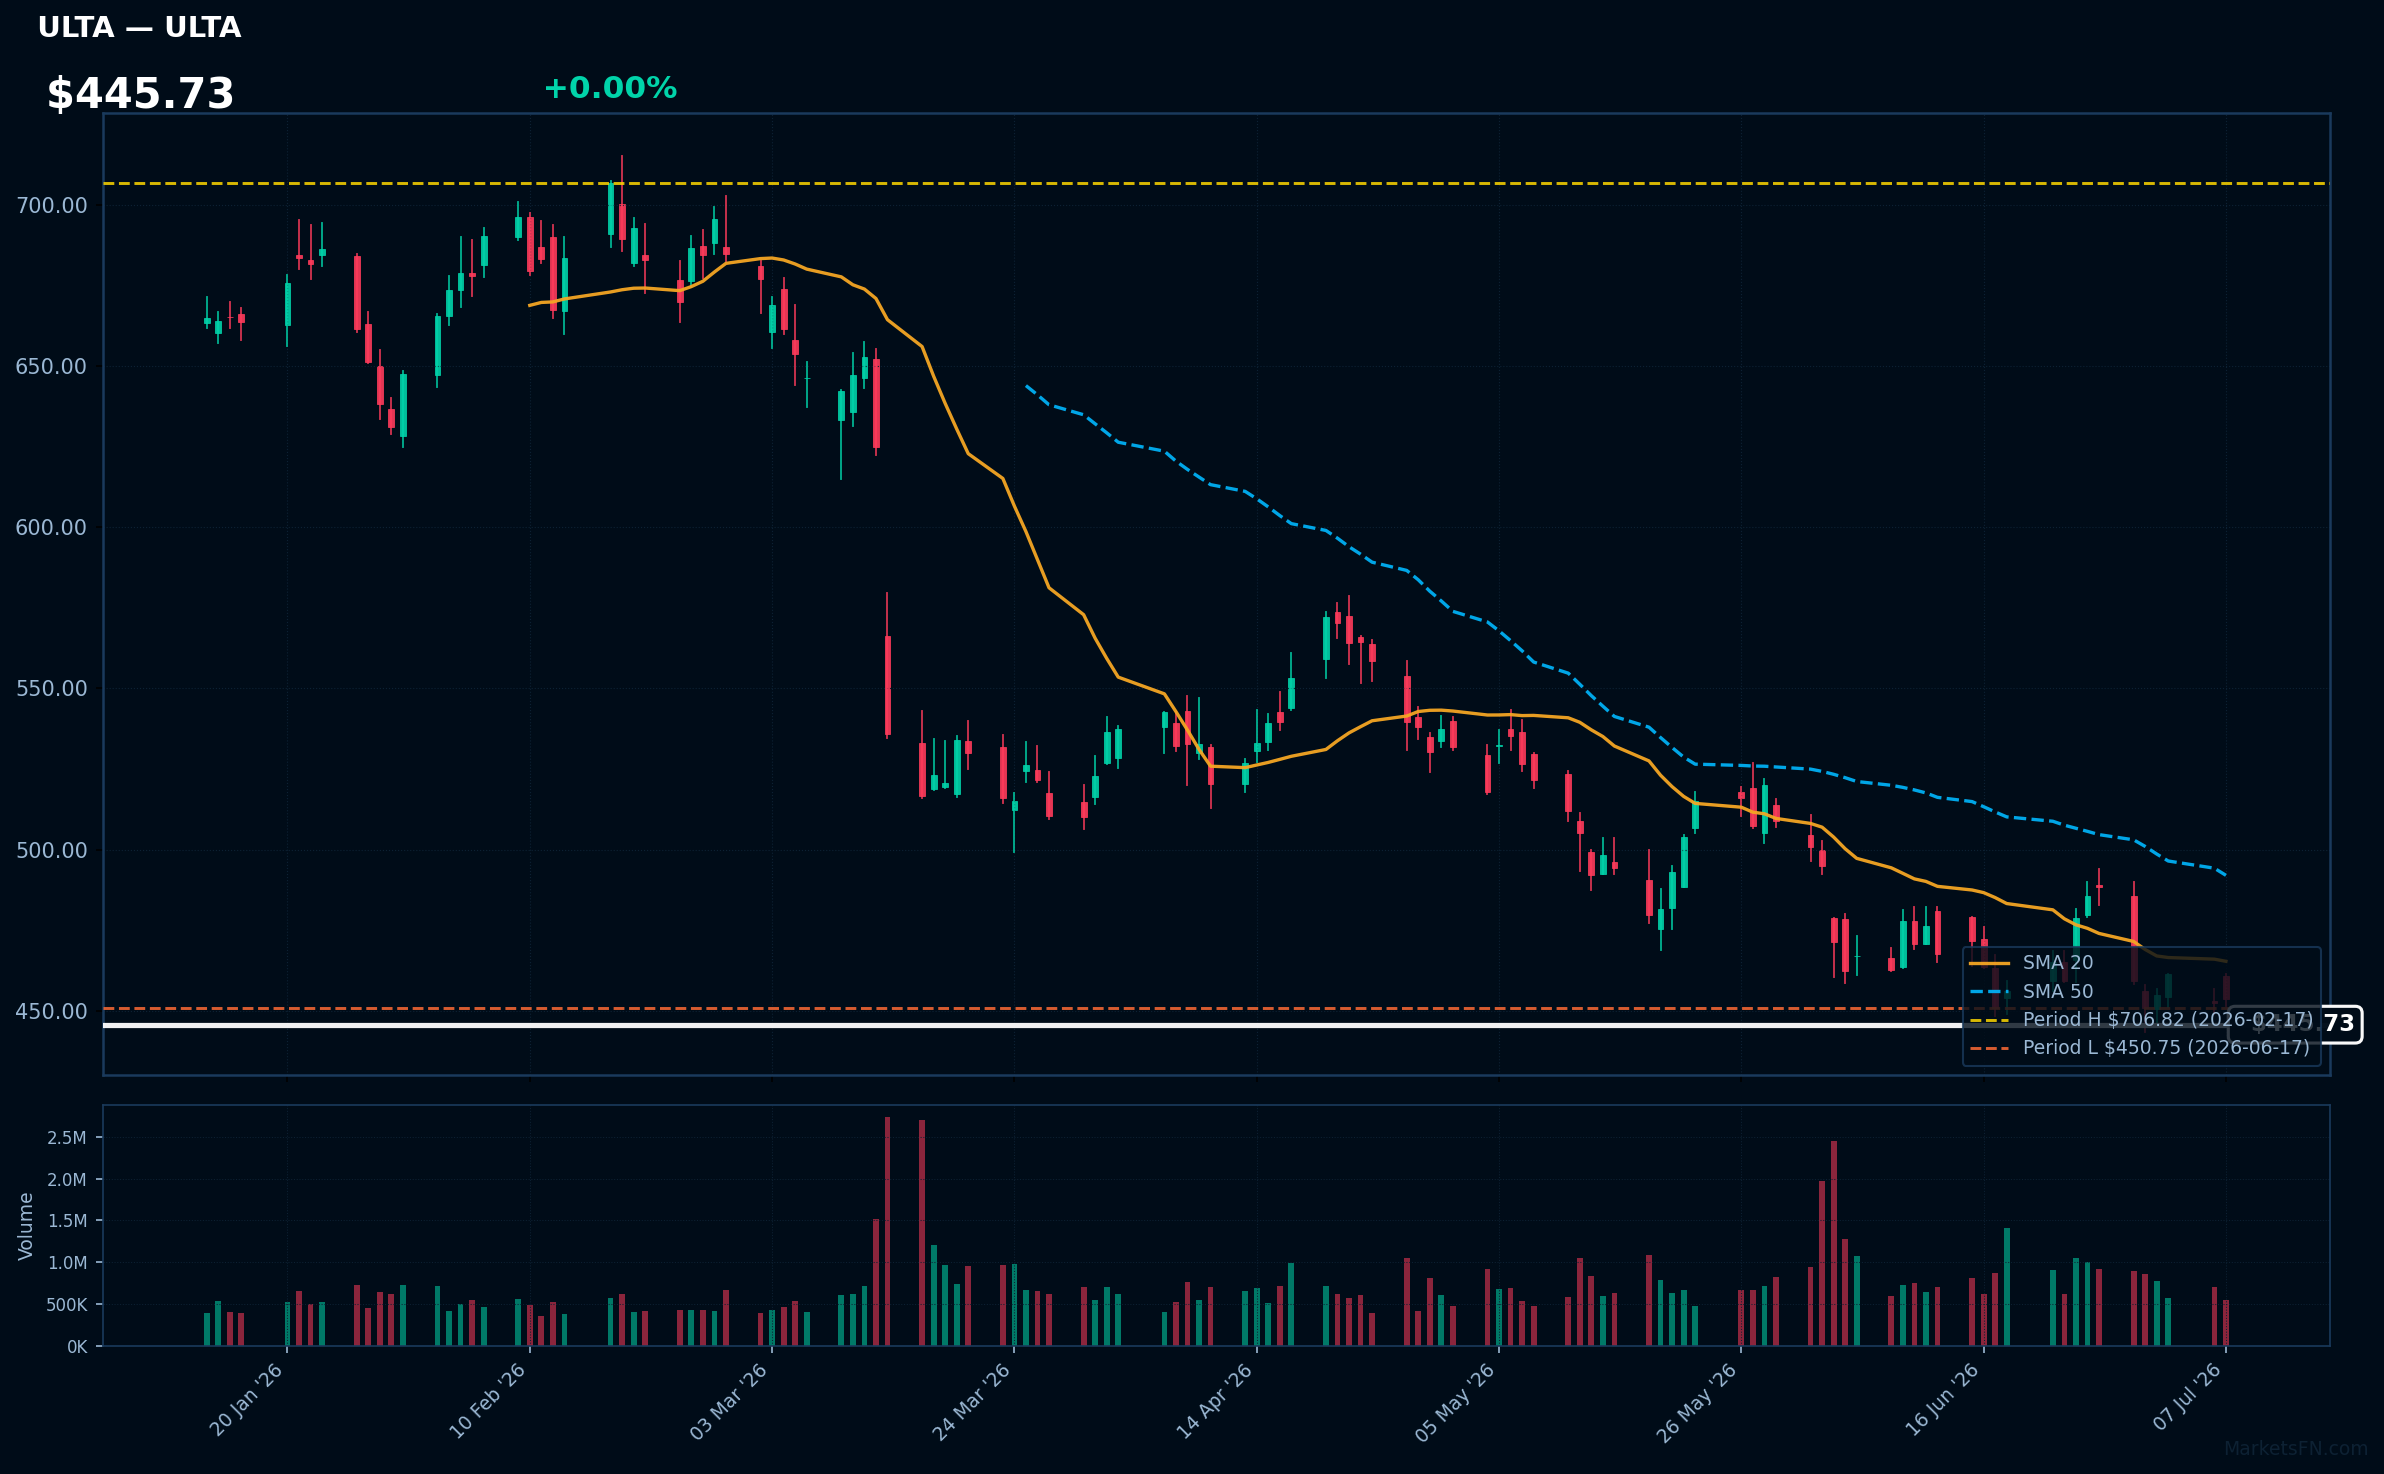
ULTA | Ulta Beauty Inc | Consumer Cyclical | Price Last: $453.78 | % Realized: -26.81% | RSI: 38.7 | % above MA200: -19.0% | Trend: Below MA20, MA50, MA200
Ulta Beauty Inc operates as a beauty retailer offering cosmetics, fragrances, and skincare products across over 1,300 stores. Investors should care about its performance as it reflects consumer spending trends and competitive dynamics in the beauty retail market.
Ulta Beauty Inc is in a sustained downtrend with price ($445.73) below MA20, MA50, and MA200. The RSI(14) is 38.7, nearing oversold territory, and the stock is 0.7% above its 2026 YTD low, testing major support, indicating a potential warning sign.
Related headlines
- Target to replace Ulta shops in 600+ stores with its in-house Beauty Studio
- Bath & Body Works Ulta Beauty launch may expand reach, but channel shift risks remain: Jefferies
- Ulta Beauty CMO on Evolving a 47 Million-Member Loyalty Program into a Relationship Engine
- Bath & Body Works is bringing its products to 600 Ulta Beauty stores
Market Commentary
The S&P 500 stocks listed are near their 2026 year-to-date (YTD) extremes, with some at their highs and others at their lows. Stocks like JPMorgan Chase & Co (JPM), Eli Lilly & Co (LLY), and Johnson & Johnson (JNJ) are at their 2026 YTD highs, indicating strong performance, while Las Vegas Sands Corp (LVS) and Warner Bros. Discovery Inc (WBD) are at their 2026 YTD lows.
The stocks near 2026 YTD highs are primarily from the financial and healthcare sectors, suggesting strength in these areas. In contrast, the stocks near their lows are from diverse sectors, including consumer discretionary (LVS, HAS, ULTA) and chemicals (ALB), indicating potential challenges in these industries. This divergence may reflect varying market conditions and investor sentiment towards different sectors.
Investors should monitor these stocks and their respective sectors for signs of continued strength or weakness. As the year progresses, changes in their performance relative to their YTD extremes could indicate broader market trends and sector rotations, providing valuable insights for investment decisions.
Methodology: All 503 S&P 500 constituents screened. Close prices downloaded from 2026-01-01. Period high = highest close since Jan 1 2026; period low = lowest close since Jan 1 2026. Distance = (current price / period extreme − 1) × 100. Technical indicators computed on up to 1 year of daily OHLCV data.
Disclaimer: For informational purposes only. Not investment advice. Past performance is not indicative of future results.

