S&P 500 52-Week Highs & Lows Radar: Crowdstrike (CRWD), Home Depot, (HD) and more
MarketsFN Team

S&P 500 52-Week Highs & Lows Radar: Crowdstrike (CRWD), Home Depot, (HD) and more
Screening all 503 S&P 500 constituents for stocks nearest to their 52-week high and their 52-week low. Data as of October 01, 2026. % Realized = 52-week total return.
Legend: RSI > 70 = overbought · RSI < 30 = oversold · Green % Realized = positive 52W return · Red = negative.
📈 Nearest to 52-Week High
Sectors represented: Technology (3), Communication Services (1), Healthcare (1)
| Ticker | Company | Sector | Price Last | % Realized | 52-Week High Date | RSI | % above MA200 | Trend |
|---|---|---|---|---|---|---|---|---|
| CRWD | Crowdstrike Holdings Inc | Technology | $267.10 | +113.70% | 2026-10-01 | 67.2 | +74.8% | Above MA20, MA50, MA200 |
| WBD | Warner Bros. Discovery Inc | Communication Services | $30.95 | +59.97% | 2026-10-01 | 75.4 | +11.9% | Above MA20, MA50, MA200 |
| NTAP | Netapp Inc | Technology | $210.40 | +77.55% | 2026-10-01 | 67.1 | +52.3% | Above MA20, MA50, MA200 |
| RVTY | Revvity Inc | Healthcare | $153.88 | +67.70% | 2026-10-01 | 75.7 | +45.1% | Above MA20, MA50, MA200 |
| FTNT | Fortinet Inc | Technology | $178.43 | +109.47% | 2026-09-30 | 61.2 | +51.1% | Above MA20, MA50, MA200 |
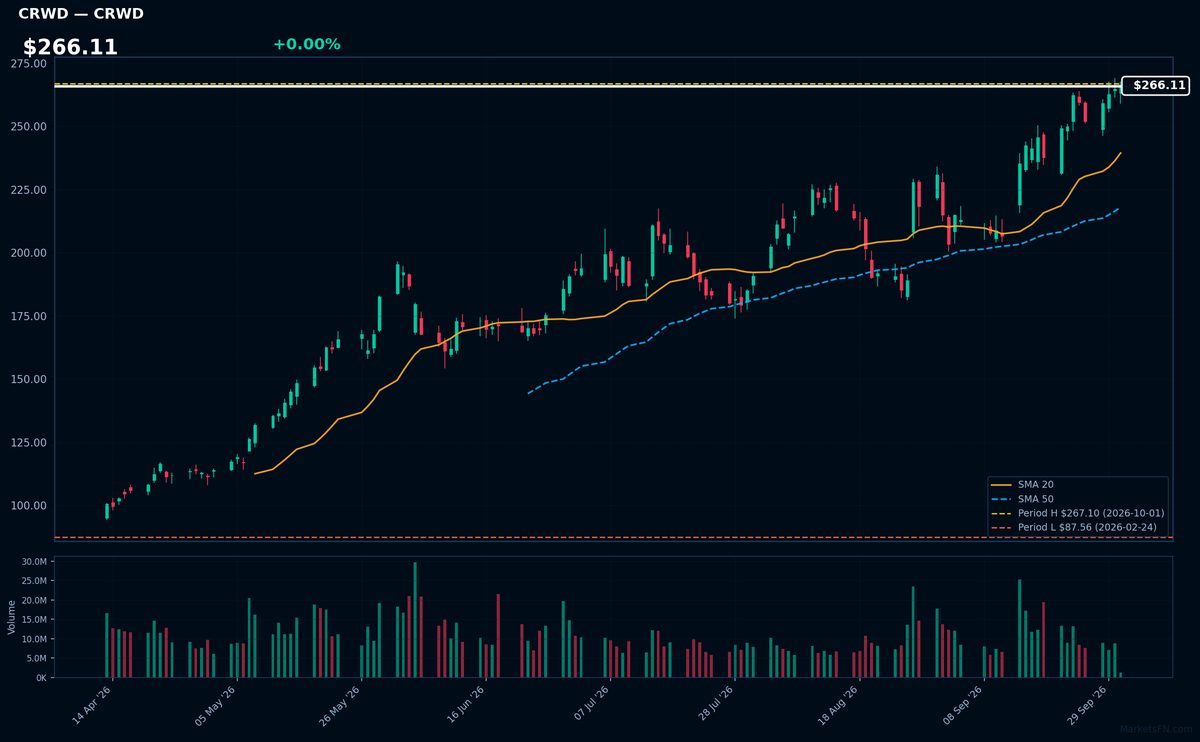
CRWD | Crowdstrike Holdings Inc | Technology | Price Last: $267.10 | % Realized: +113.70% | RSI: 67.2 | % above MA200: +74.8% | Trend: Above MA20, MA50, MA200
Crowdstrike Holdings Inc provides cloud-delivered endpoint security solutions, protecting enterprises from cyber threats. Investors should care as its innovative Falcon platform has driven significant growth, capitalizing on the increasing demand for robust cybersecurity measures in a digitally driven economy.
Crowdstrike's technicals indicate strong momentum: RSI(14) is 67.2, and the stock is in a bullish MA alignment with price > MA20 > MA50 > MA200. It's 0.0% below its 52-Week high, suggesting a potential breakout.
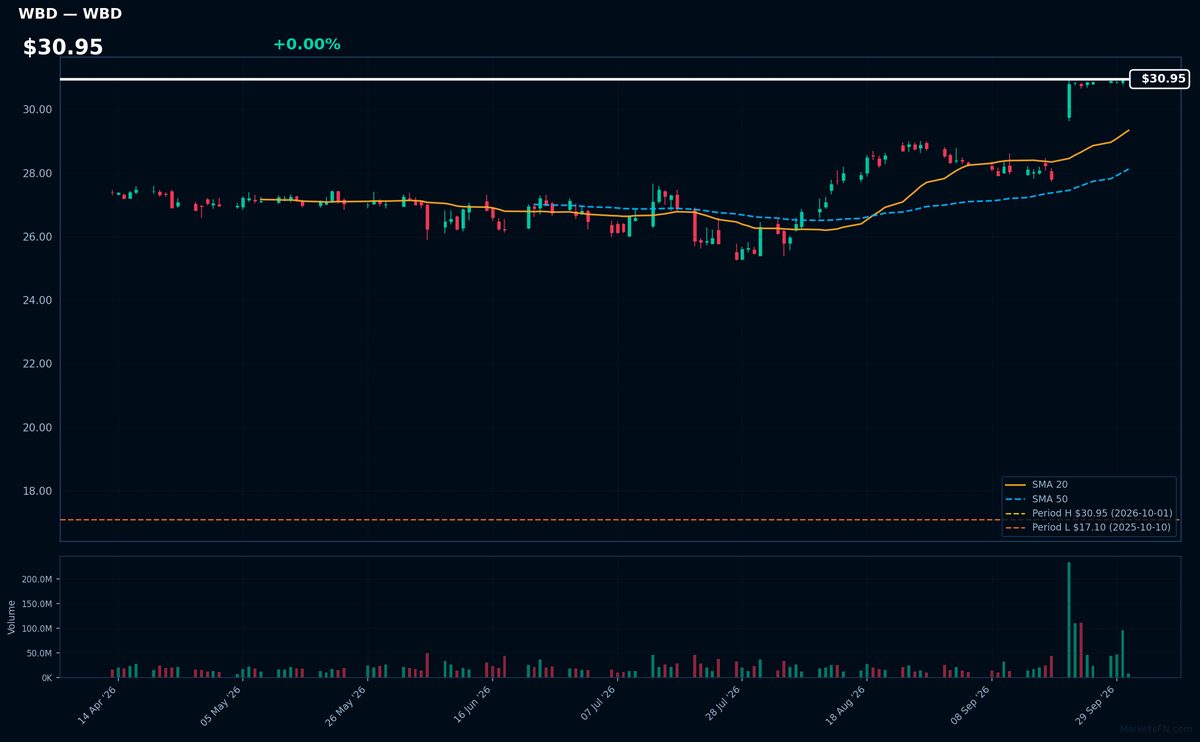
WBD | Warner Bros. Discovery Inc | Communication Services | Price Last: $30.95 | % Realized: +59.97% | RSI: 75.4 | % above MA200: +11.9% | Trend: Above MA20, MA50, MA200
Warner Bros. Discovery Inc is a media conglomerate owning major entertainment brands like HBO, Warner Bros., and Discovery Channel, generating revenue through content creation, distribution, and advertising, making it a significant player in the global media landscape.
WBD's RSI(14) is 75.4, indicating strong momentum as it's near overbought territory. The MA alignment (price > MA20 > MA50 > MA200) confirms a sustained uptrend. With the stock 0.0% below its 52-Week high, it suggests a potential breakout level is near.
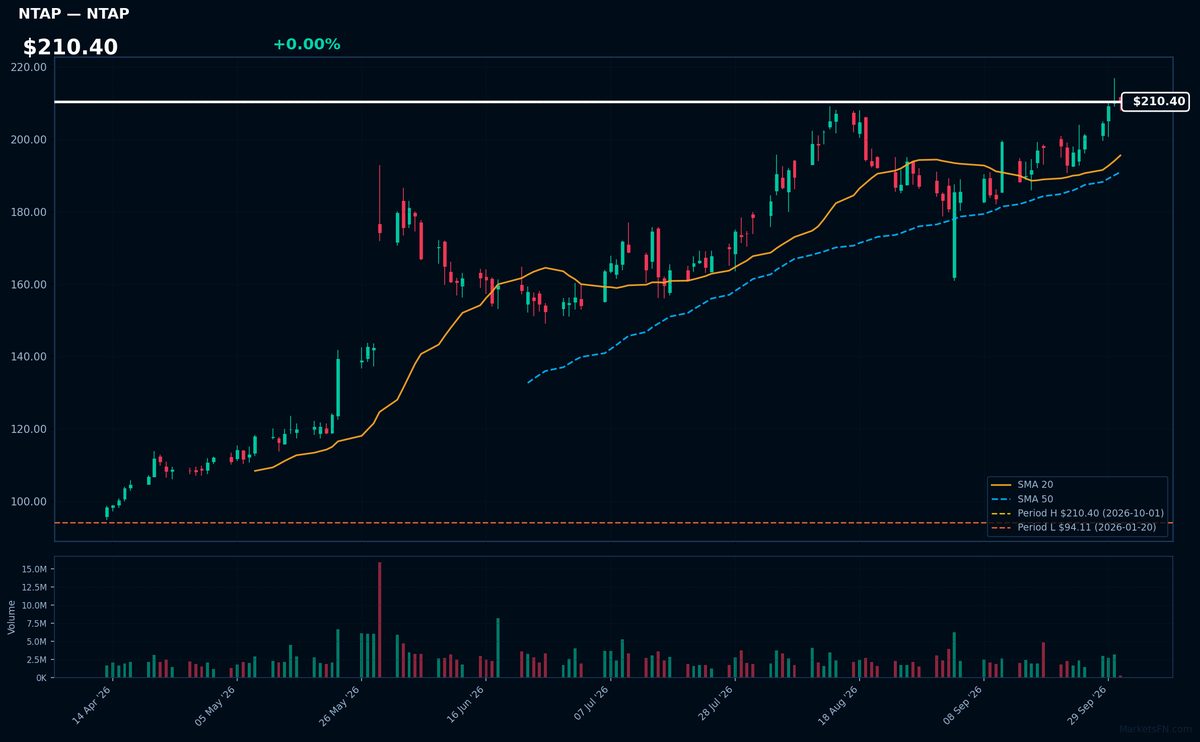
NTAP | Netapp Inc | Technology | Price Last: $210.40 | % Realized: +77.55% | RSI: 67.1 | % above MA200: +52.3% | Trend: Above MA20, MA50, MA200
NetApp provides cloud data services and storage solutions, enabling businesses to manage and store data across on-premises and cloud environments. Investors should care as the company plays a crucial role in the growing cloud infrastructure and data management market.
NetApp's current technical situation indicates strong momentum: RSI(14) is 67.1, and the stock is in a sustained uptrend with price > MA20 > MA50 > MA200. It's near a potential breakout level, 0.0% below its 52-Week high, after a 77.5% 52-Week return.
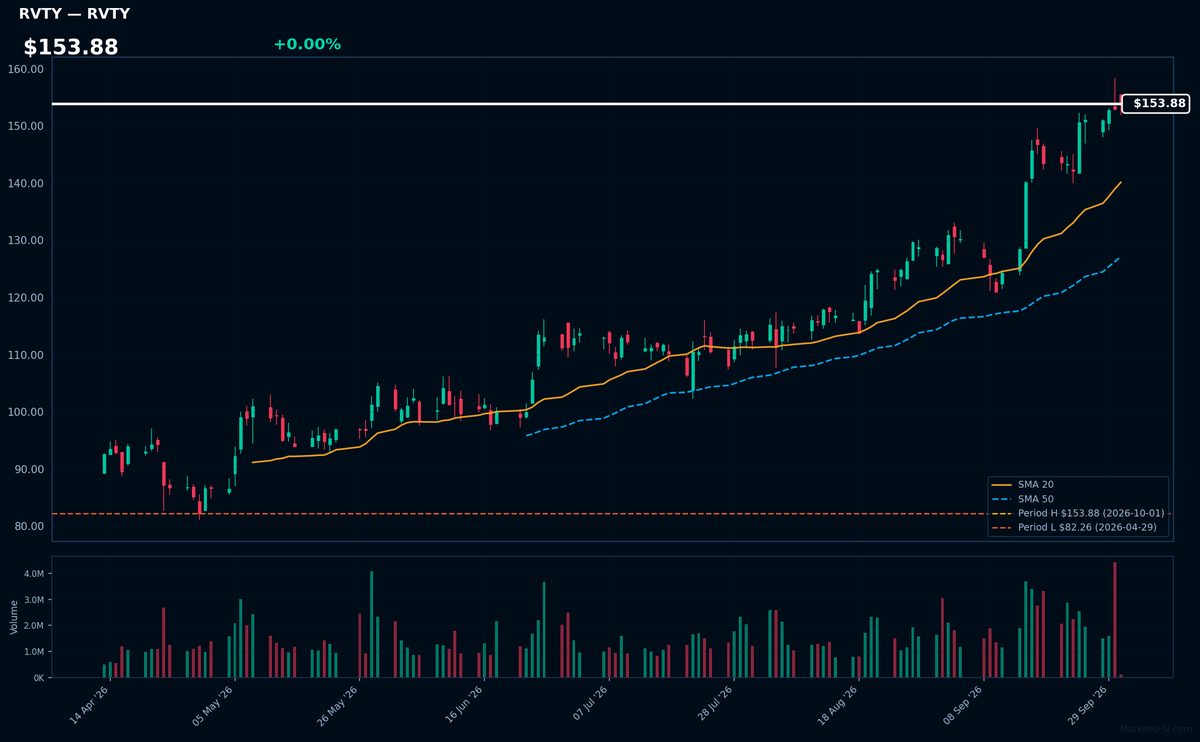
RVTY | Revvity Inc | Healthcare | Price Last: $153.88 | % Realized: +67.70% | RSI: 75.7 | % above MA200: +45.1% | Trend: Above MA20, MA50, MA200
Revvity Inc provides scientific instruments and services for life sciences, diagnostics, and applied markets, enabling discovery and analysis in genomics, drug discovery, and clinical diagnostics; investors should care due to its role in advancing biomedical research and diagnostics.
Revvity Inc's RSI(14) is 75.7, indicating strong momentum; its price is above MA20, MA50, and MA200, showing a sustained uptrend; being 0.0% below its 52-Week high suggests a potential breakout level, reinforcing the bullish technical situation.
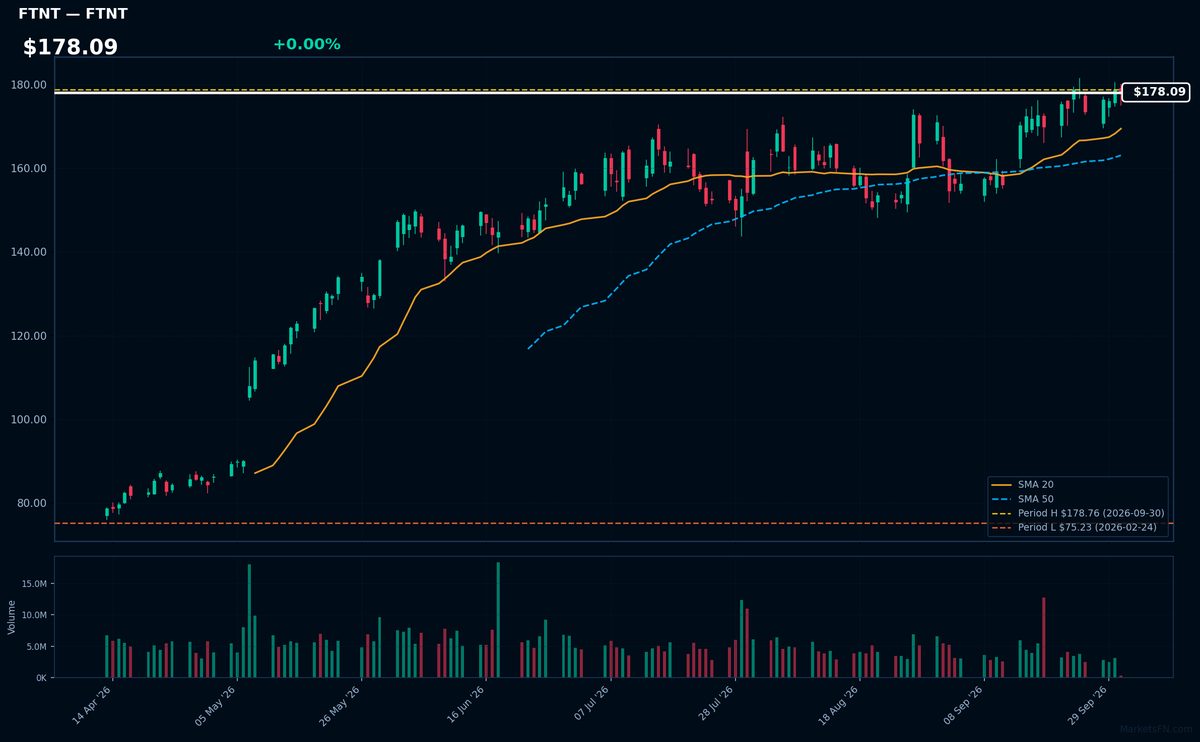
FTNT | Fortinet Inc | Technology | Price Last: $178.43 | % Realized: +109.47% | RSI: 61.2 | % above MA200: +51.1% | Trend: Above MA20, MA50, MA200
Fortinet Inc is a cybersecurity company providing network security solutions, including firewalls and threat intelligence. Investors should care due to its strong growth prospects driven by increasing demand for cybersecurity services.
Fortinet Inc is in a sustained uptrend with price > MA20 > MA50 > MA200, RSI(14) at 61.2, and is 0.2% below its 52-Week high, indicating strong momentum with potential for breakout.
📉 Nearest to 52-Week Low
Sectors represented: Consumer Cyclical (2), Utilities (2), Consumer Defensive (1)
| Ticker | Company | Sector | Price Last | % Realized | 52-Week Low Date | RSI | % above MA200 | Trend |
|---|---|---|---|---|---|---|---|---|
| HD | Home Depot, Inc | Consumer Cyclical | $279.05 | -29.71% | 2026-10-01 | 23.6 | -17.8% | Below MA20, MA50, MA200 |
| PEP | PepsiCo Inc | Consumer Defensive | $126.50 | -11.62% | 2026-10-01 | 25.4 | -14.2% | Below MA20, MA50, MA200 |
| NEE | NextEra Energy Inc | Utilities | $74.60 | -5.17% | 2026-10-01 | 21.5 | -14.7% | Below MA20, MA50, MA200 |
| LOW | Lowe's Cos., Inc | Consumer Cyclical | $180.82 | -27.09% | 2026-10-01 | 25.5 | -22.0% | Below MA20, MA50, MA200 |
| SO | Southern Company | Utilities | $82.16 | -13.33% | 2026-10-01 | 25.8 | -10.9% | Below MA20, MA50, MA200 |
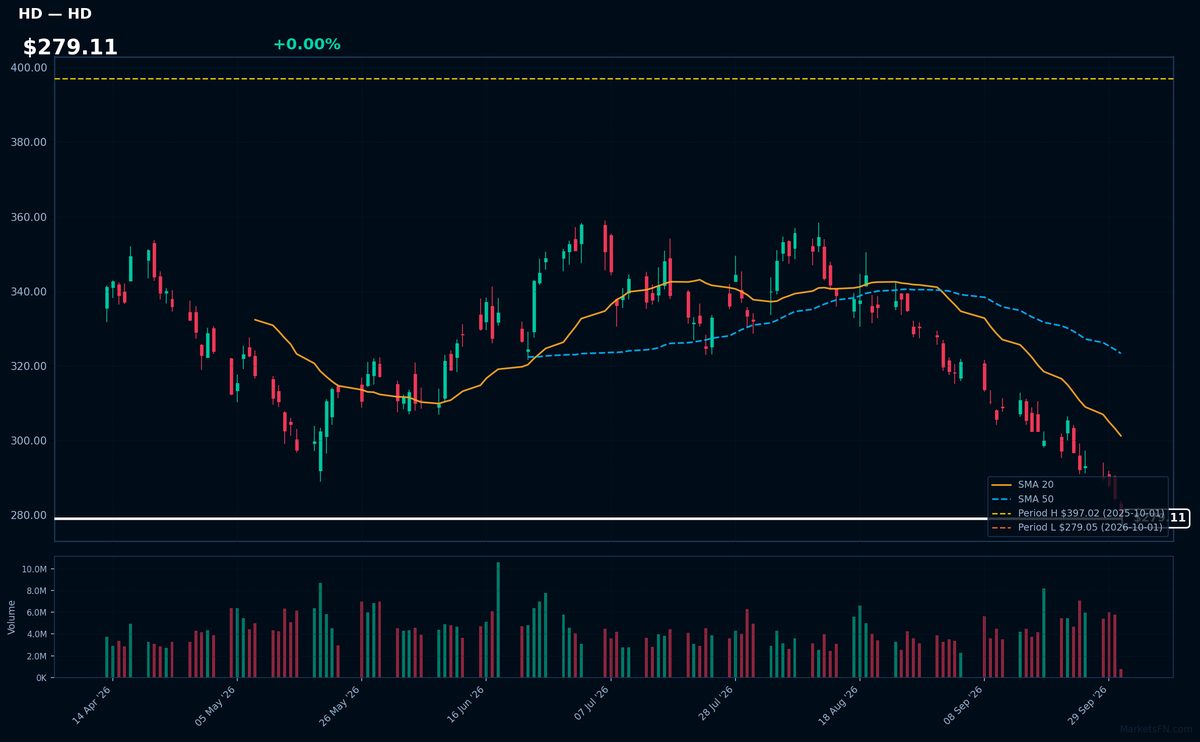
HD | Home Depot, Inc | Consumer Cyclical | Price Last: $279.05 | % Realized: -29.71% | RSI: 23.6 | % above MA200: -17.8% | Trend: Below MA20, MA50, MA200
Home Depot, Inc is a home improvement retailer selling building materials, tools, and gardening supplies. Investors care about its performance as it reflects housing market trends and consumer spending on home renovations.
Home Depot's technical situation is bearish, with an RSI(14) of 23.6 indicating oversold conditions, and a sustained downtrend as price ($279.11) remains below MA20, MA50, and MA200, testing major support near its 52-Week low.
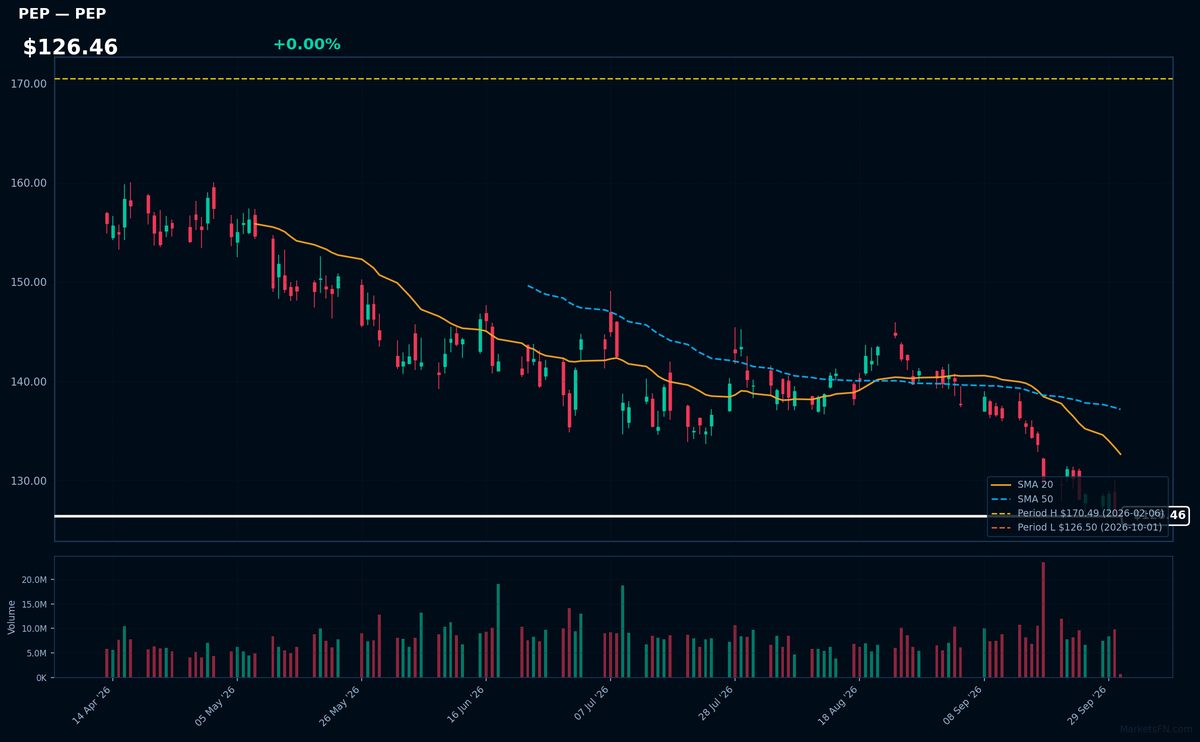
PEP | PepsiCo Inc | Consumer Defensive | Price Last: $126.50 | % Realized: -11.62% | RSI: 25.4 | % above MA200: -14.2% | Trend: Below MA20, MA50, MA200
PepsiCo Inc is a diversified food and beverage company with brands like Pepsi, Lay's, and Gatorade, generating revenue through beverage sales, snack foods, and other categories, making it a significant player in the consumer staples sector.
PepsiCo's current technical situation is bearish, with an RSI(14) of 25.4 indicating oversold conditions, and a sustained downtrend as price ($126.46) remains below MA20, MA50, and MA200, testing major support near its 52-Week low.
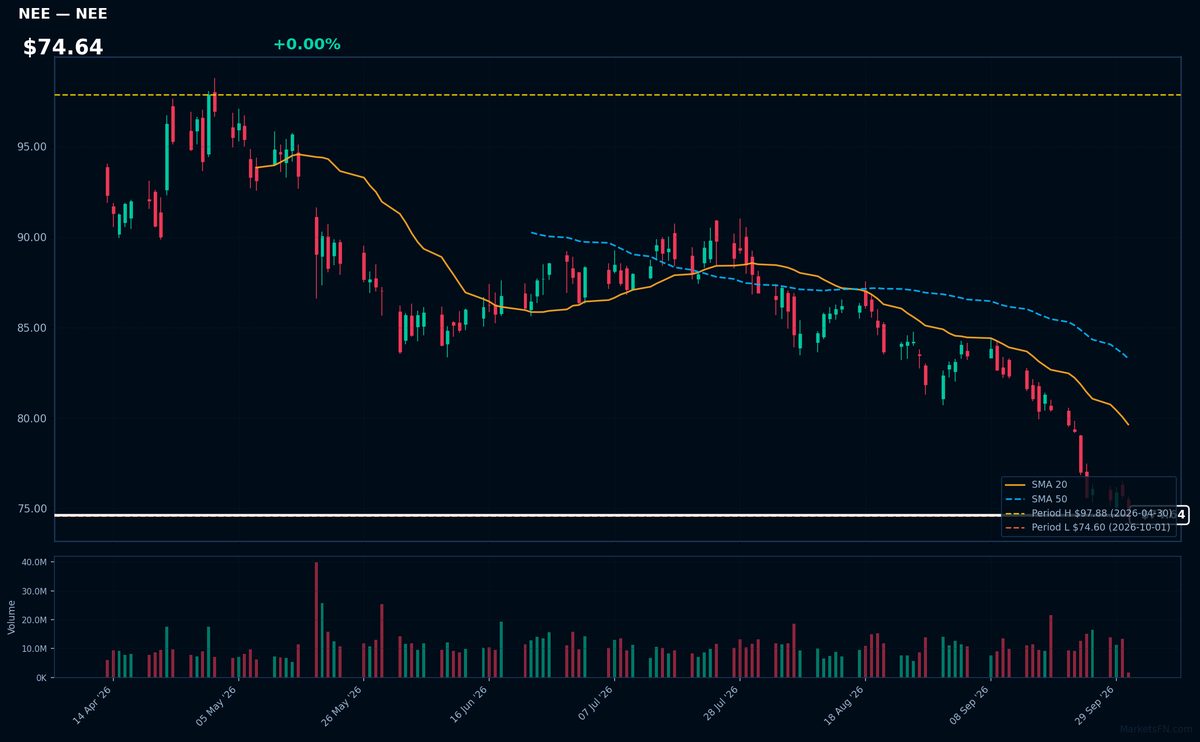
NEE | NextEra Energy Inc | Utilities | Price Last: $74.60 | % Realized: -5.17% | RSI: 21.5 | % above MA200: -14.7% | Trend: Below MA20, MA50, MA200
NextEra Energy Inc is a leading clean energy company that generates and distributes electricity through its subsidiaries, focusing on wind and solar power. Investors care due to its significant role in the renewable energy transition.
NextEra Energy Inc is in a sustained downtrend with price below all MAs (MA20, MA50, MA200). The RSI(14) is 21.5, near oversold territory, and the stock is at its 52-Week low, indicating a potential warning sign.
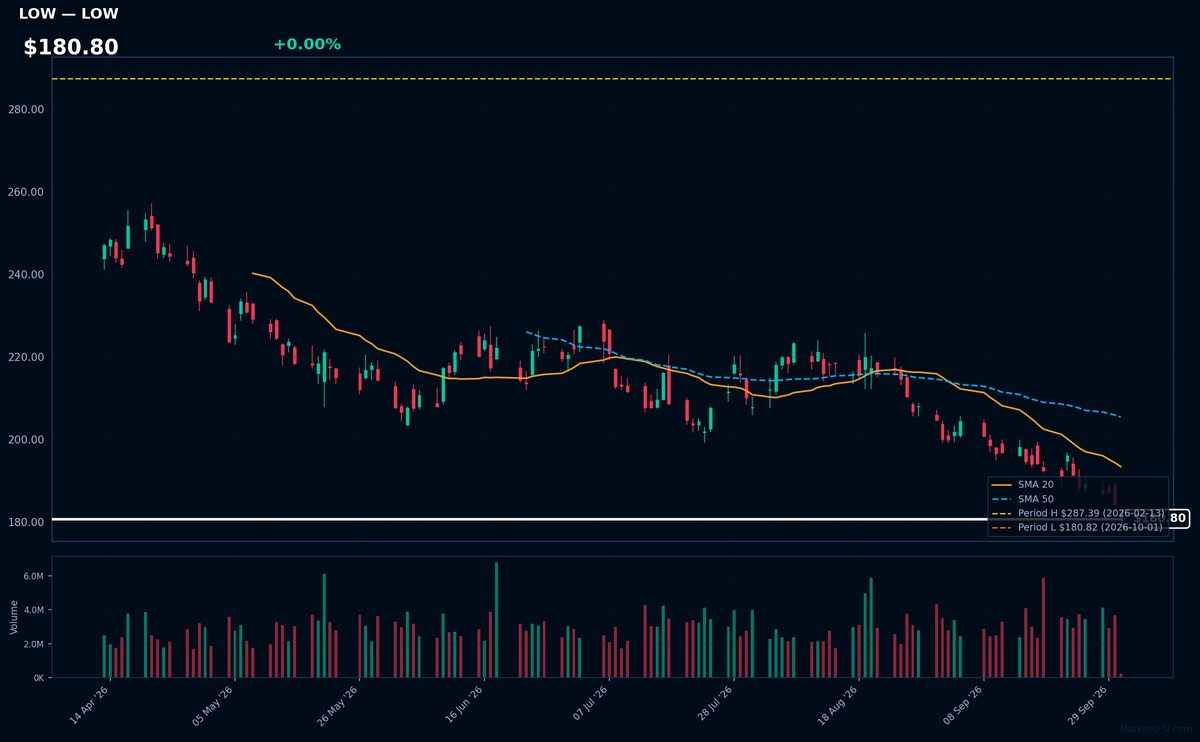
LOW | Lowe's Cos., Inc | Consumer Cyclical | Price Last: $180.82 | % Realized: -27.09% | RSI: 25.5 | % above MA200: -22.0% | Trend: Below MA20, MA50, MA200
Lowe's Cos., Inc operates as a home improvement retailer, selling products such as building materials, tools, and appliances. Investors should care as the company's performance reflects housing market trends and consumer spending habits.
Lowe's is in a sustained downtrend with price ($180.80) below MA20, MA50, and MA200. RSI(14) is 25.5, near oversold territory, and the stock is at its 52-Week low, indicating potential major support testing, a technical warning sign.
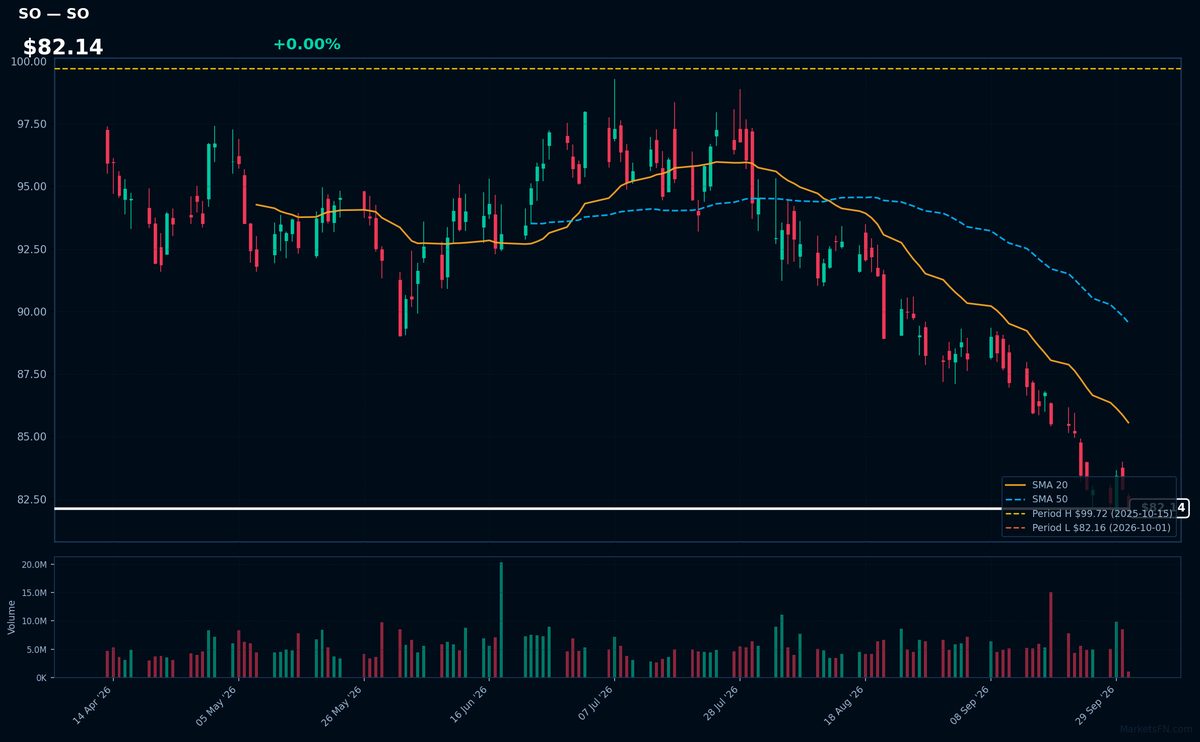
SO | Southern Company | Utilities | Price Last: $82.16 | % Realized: -13.33% | RSI: 25.8 | % above MA200: -10.9% | Trend: Below MA20, MA50, MA200
Southern Company is a large electric utility holding company providing electricity to a significant portion of the southeastern United States. Investors care about its regulated returns, dividend yield, and ability to navigate energy transition.
Southern Company's technical situation is bearish, with an RSI(14) of 25.8 indicating oversold conditions, price below all key MAs (MA20, MA50, MA200), and a 52-Week low test, signaling a sustained downtrend and potential further downside.
Market Commentary
The S&P 500 stocks listed are currently near 52-week extremes, with some at new highs and others at new lows. Stocks like CRWD, WBD, NTAP, and RVTY are at their 52-week highs, while HD, PEP, NEE, LOW, and SO are at their 52-week lows. Being at these extremes can signal strong trends, either upward or downward, and may indicate a shift in investor sentiment.
The stocks near 52-week highs are from the technology and consumer discretionary sectors, while those near 52-week lows are from the consumer staples and utilities sectors. This sector rotation may be driven by macro themes such as changing investor risk appetite and expectations around interest rates and economic growth. The technology sector's strength could be driven by continued innovation and growth prospects.
Key levels to watch include the current prices of these stocks, as a break above or below their 52-week extremes could signal further trend continuation. Potential catalysts include earnings reports and macroeconomic data releases that could impact investor sentiment and drive further price movements. Monitoring these levels and catalysts will be crucial in understanding the future direction of these stocks.
Methodology: All 503 S&P 500 constituents screened. 52-week high = highest daily close over the past 252 trading days (approx. 1 year). 52-week low = lowest daily close over the same period. Distance = (current price / extreme − 1) × 100. Technical indicators computed on up to 1 year of daily OHLCV data.
Disclaimer: For informational purposes only. Not investment advice. Past performance is not indicative of future results.