S&P 500 52-Week Highs & Lows Radar: Merck & (MRK), L3Harris (LHX) and more
MarketsFN Team

S&P 500 52-Week Highs & Lows Radar: Merck & (MRK), L3Harris (LHX) and more
Screening all 503 S&P 500 constituents for stocks nearest to their 52-week high and their 52-week low. Data as of August 25, 2026. % Realized = 52-week total return.
Legend: RSI > 70 = overbought · RSI < 30 = oversold · Green % Realized = positive 52W return · Red = negative.
📈 Nearest to 52-Week High
Sectors represented: Communication Services (2), Healthcare (1), Technology (1), Consumer Cyclical (1)
| Ticker | Company | Sector | Price Last | % Realized | 52-Week High Date | RSI | % above MA200 | Trend |
|---|---|---|---|---|---|---|---|---|
| MRK | Merck & Co Inc | Healthcare | $152.74 | +79.05% | 2026-08-25 | 75.4 | +31.7% | Above MA20, MA50, MA200 |
| EA | Electronic Arts, Inc | Communication Services | $209.70 | +0.38% | 2026-08-04 | — | — | — |
| PAYC | Paycom Software Inc | Technology | $231.76 | +0.43% | 2026-08-25 | 78.5 | +58.3% | Above MA20, MA50, MA200 |
| KMX | Carmax Inc | Consumer Cyclical | $63.53 | +6.13% | 2026-08-25 | 69.4 | +40.8% | Above MA20, MA50, MA200 |
| MTCH | Match Group Inc | Communication Services | $42.04 | +13.07% | 2026-08-25 | 66.6 | +22.5% | Above MA20, MA50, MA200 |
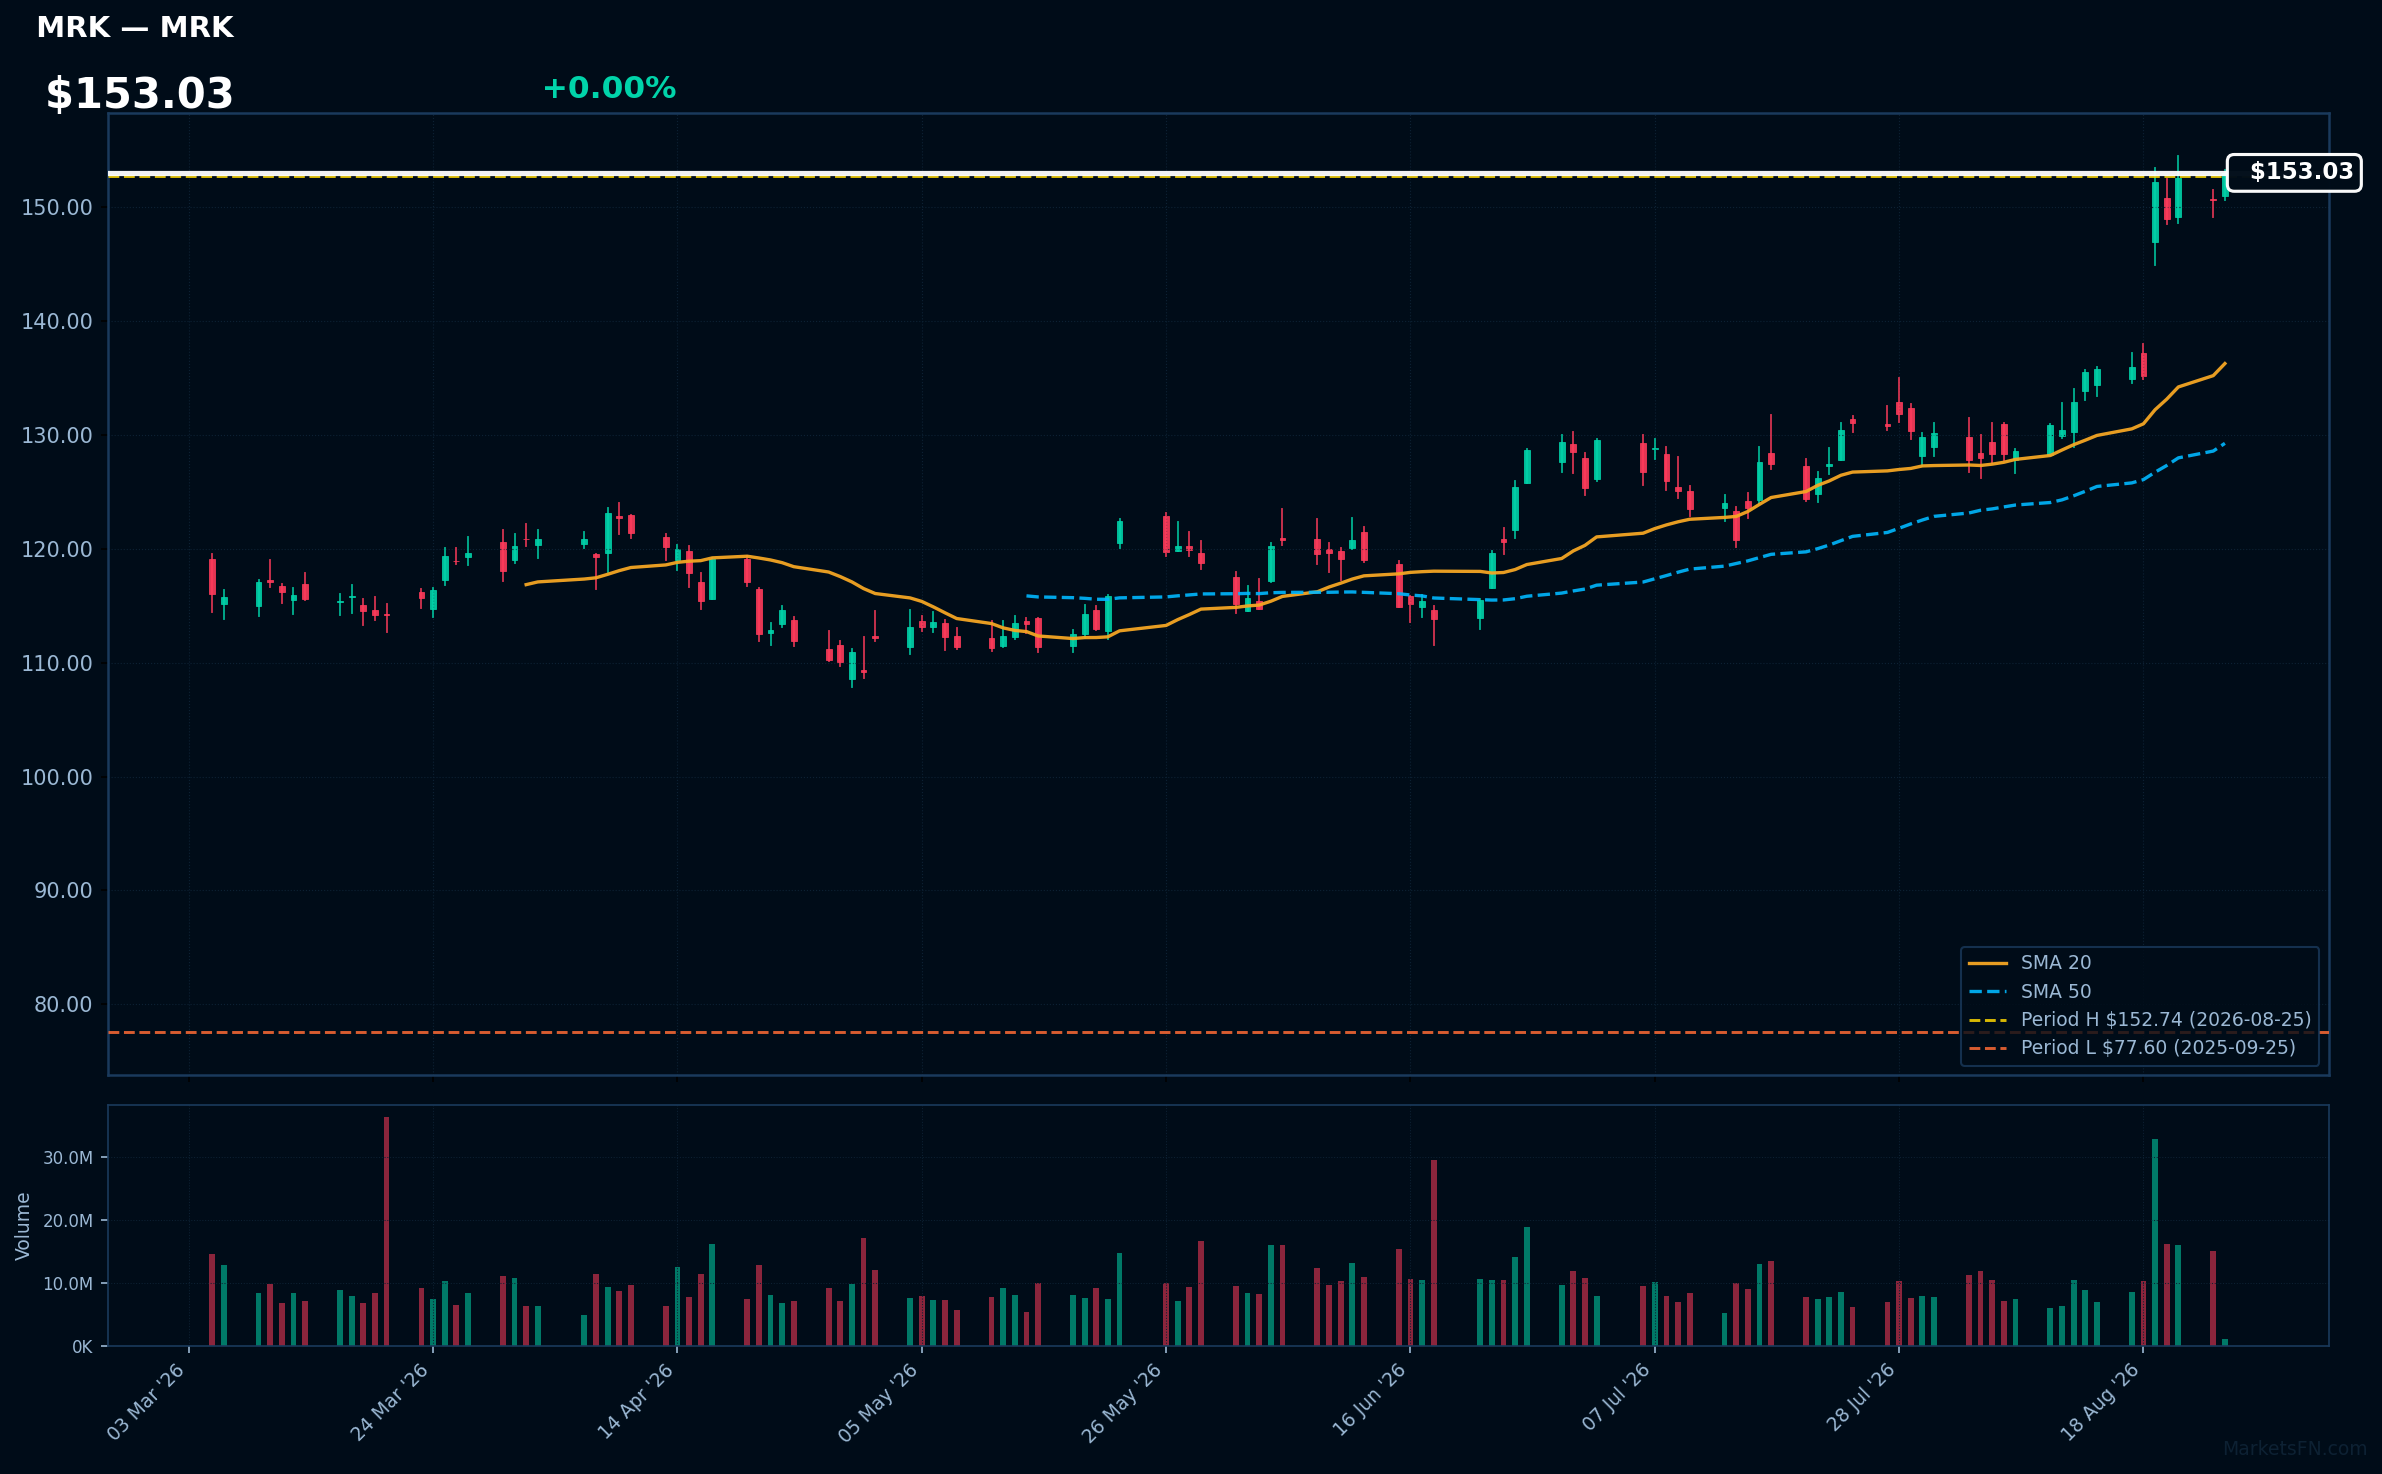
MRK | Merck & Co Inc | Healthcare | Price Last: $152.74 | % Realized: +79.05% | RSI: 75.4 | % above MA200: +31.7% | Trend: Above MA20, MA50, MA200
Merck & Co Inc develops innovative pharmaceuticals and vaccines, focusing on areas like oncology, infectious diseases, and immunology. Investors should care due to its strong pipeline and market position, which can drive future growth and profitability.
The current technical situation shows bullish momentum with an RSI(14) of 75.4 and a bullish MA alignment: price > MA20 > MA50 > MA200. The stock is also 0.0% below its 52-Week high.
Related headlines
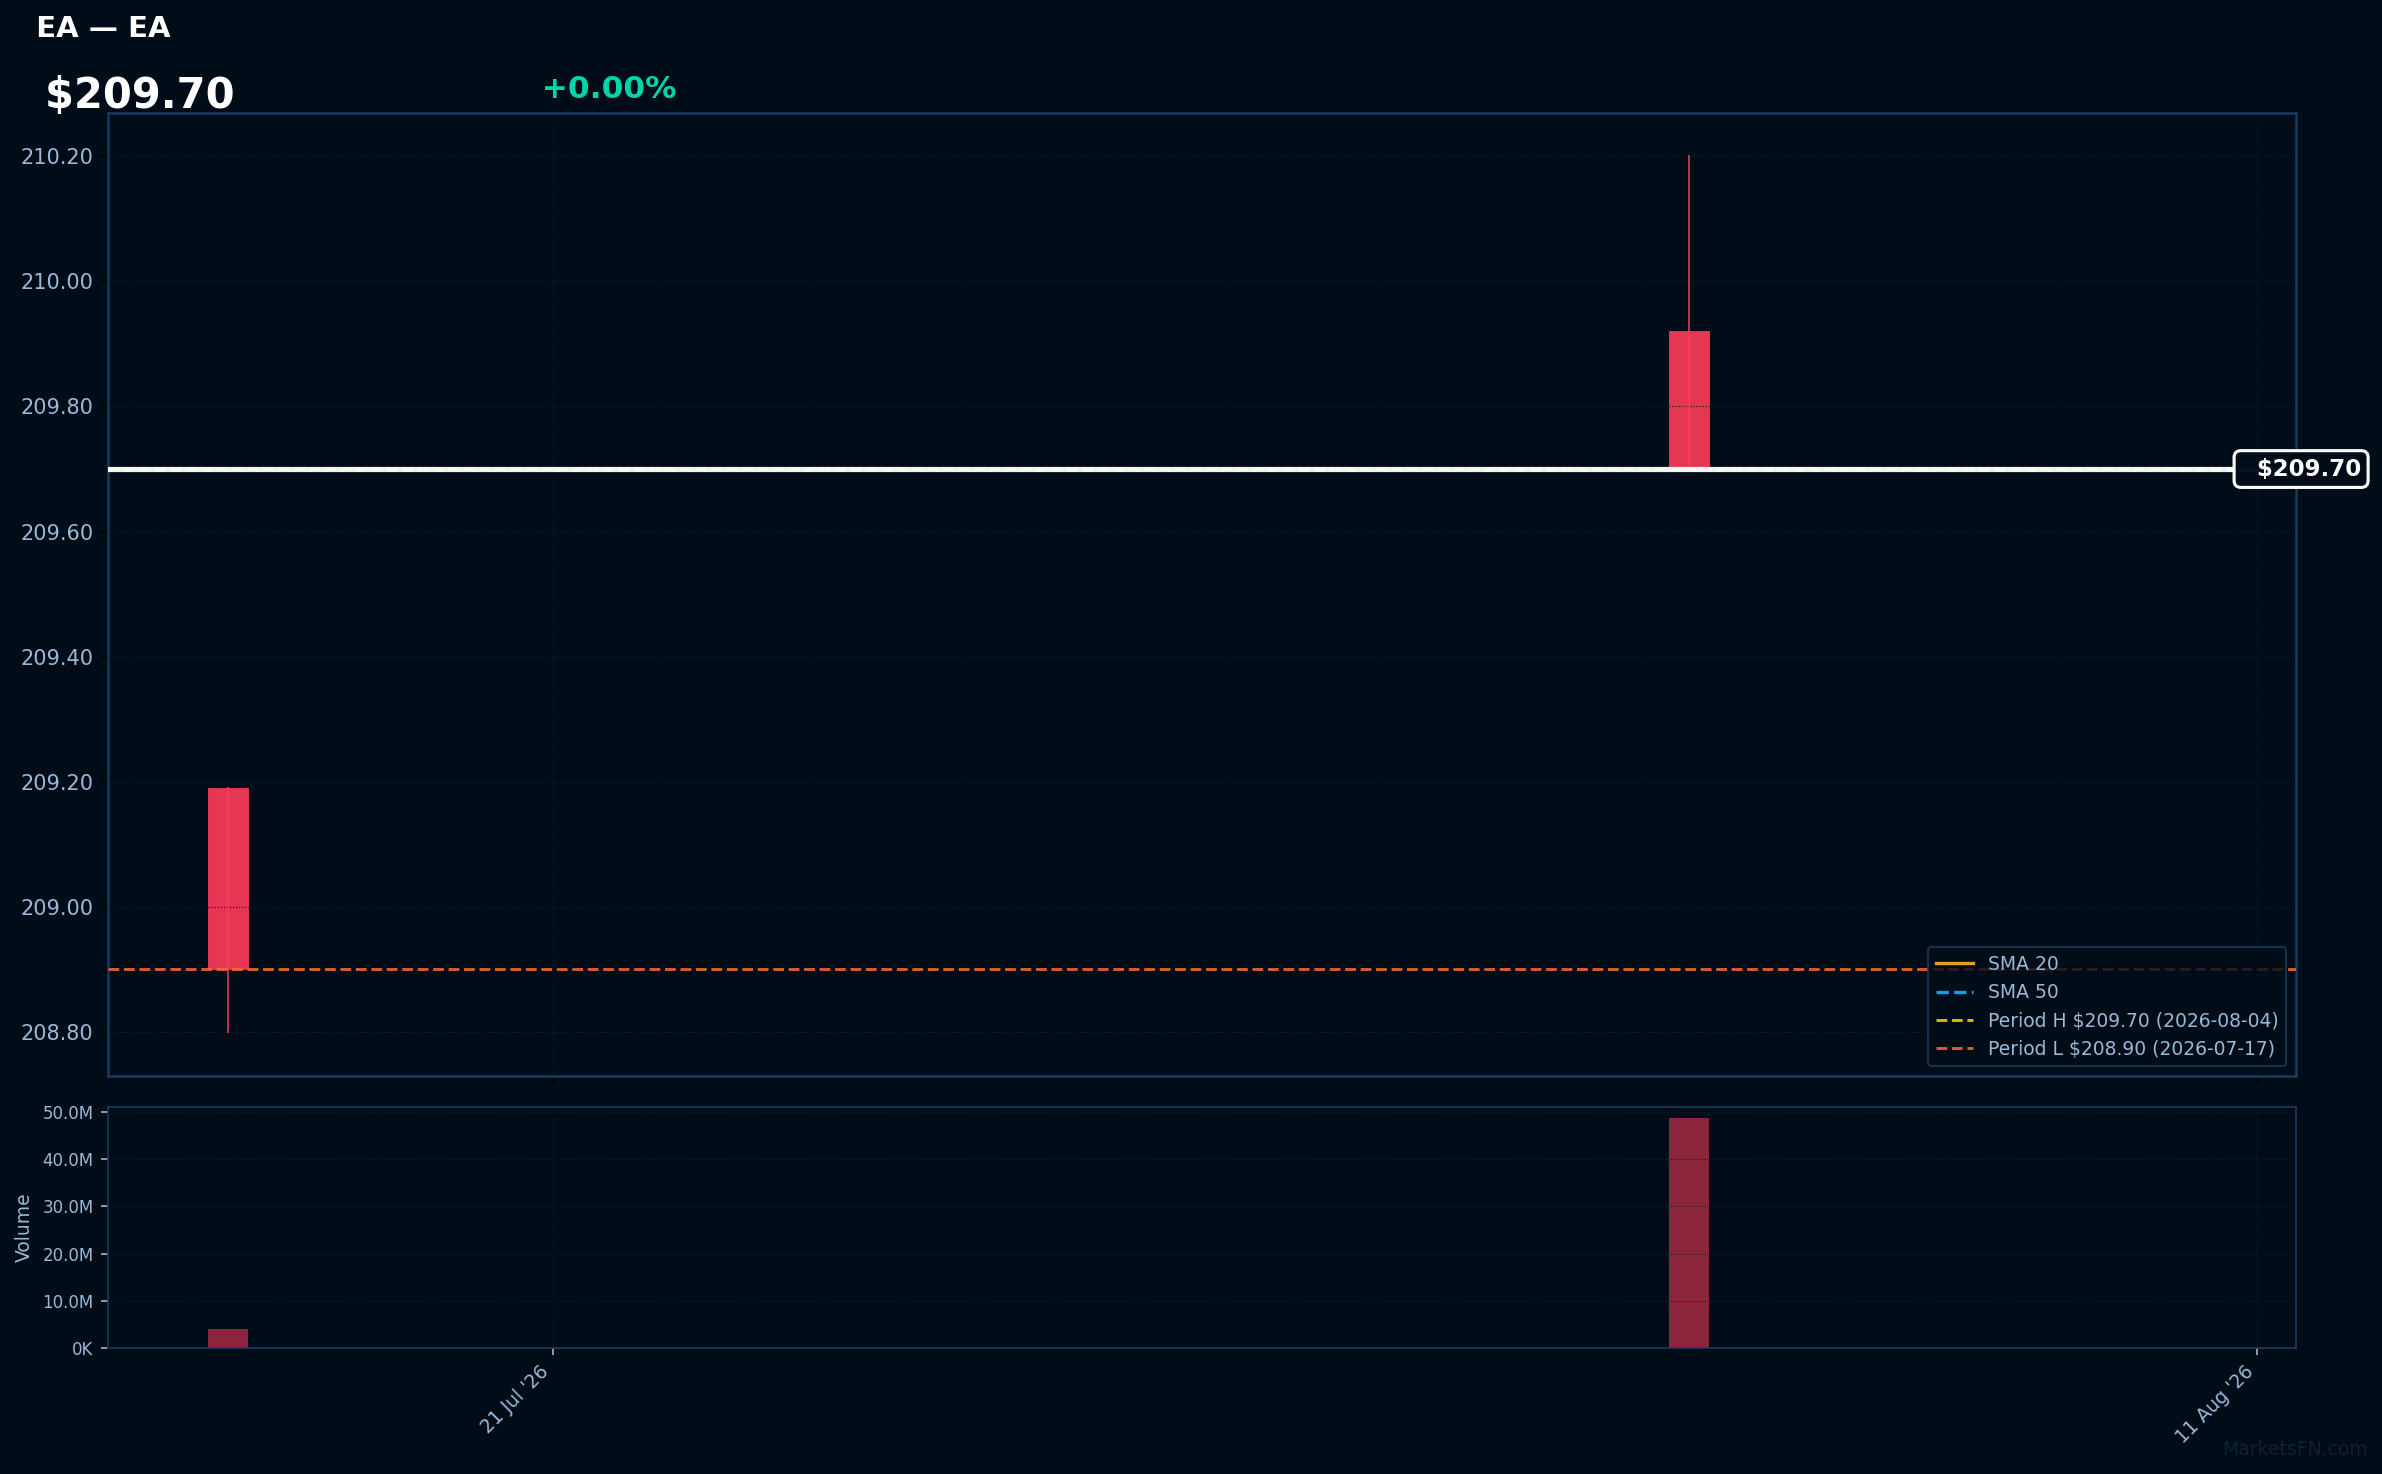
EA | Electronic Arts, Inc | Communication Services | Price Last: $209.70 | % Realized: +0.38% | RSI: — | % above MA200: — | Trend: —
Electronic Arts, Inc. develops and publishes interactive entertainment software, known for franchises like FIFA and The Sims. Investors should care due to its strong market position and potential for growth in the gaming industry, especially with ongoing trends in digital gaming and esports.
The stock is 0.0% below its 52-Week high, indicating a potential breakout level. However, RSI(14) data is N/A and MA data is incomplete, limiting the assessment of momentum or fundamental strength.
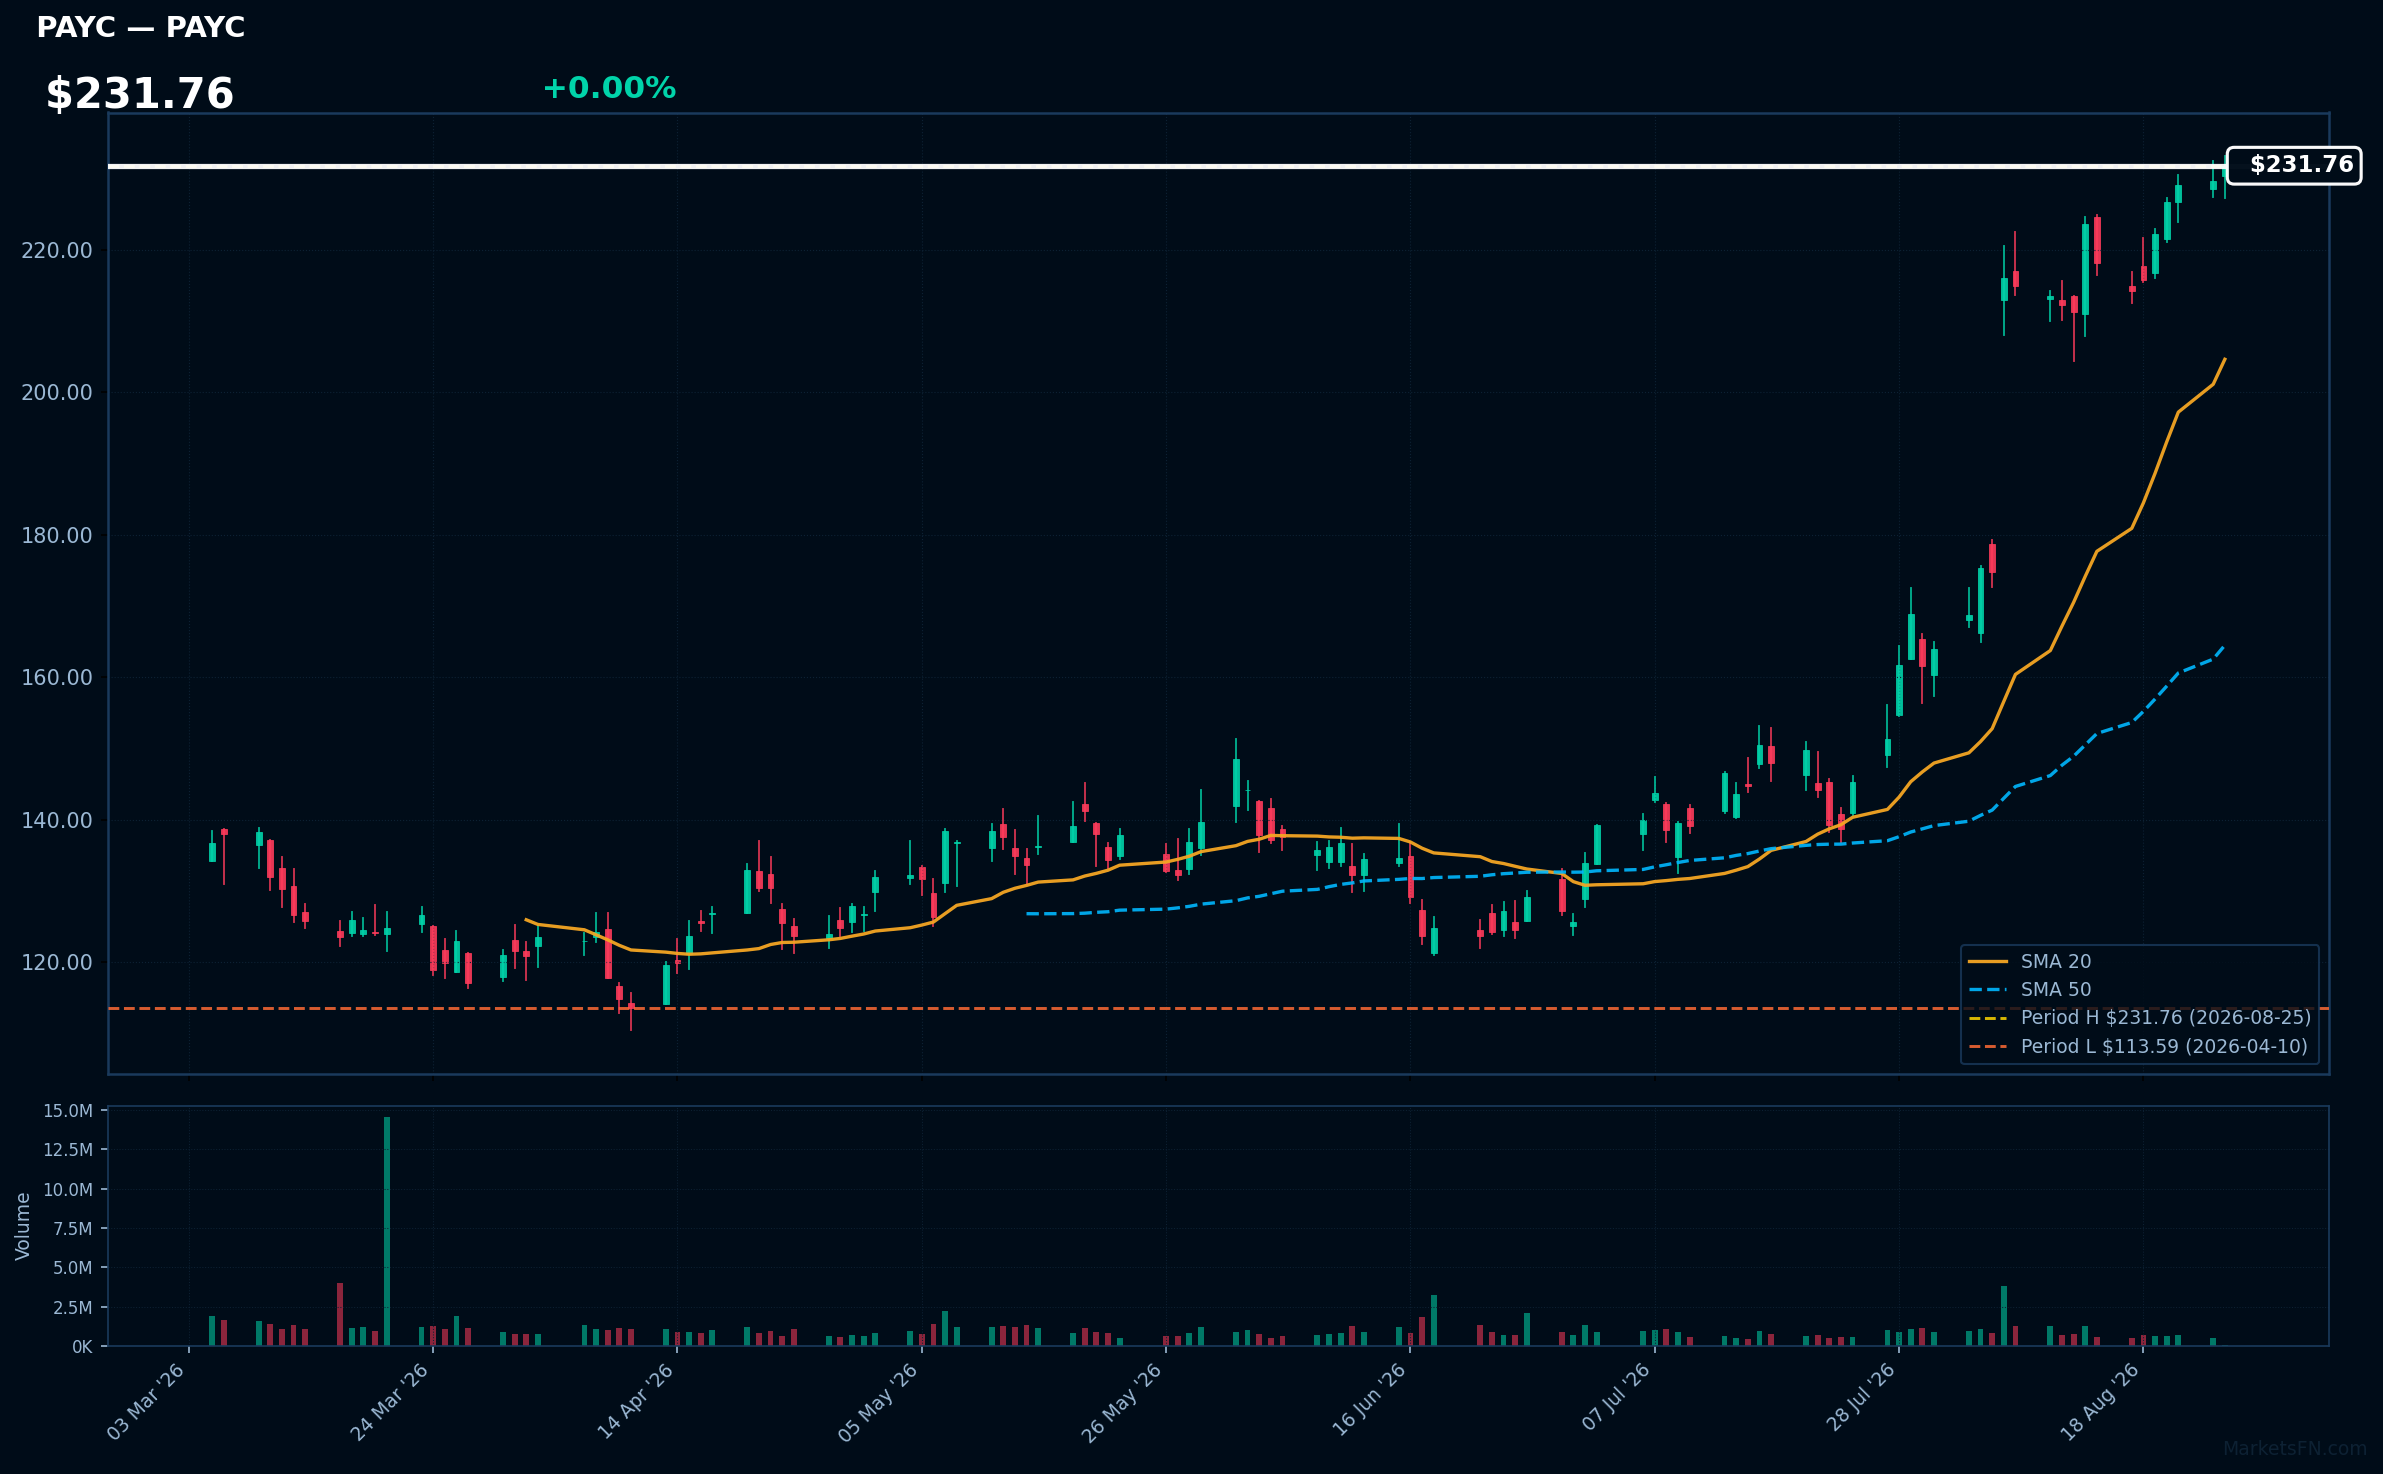
PAYC | Paycom Software Inc | Technology | Price Last: $231.76 | % Realized: +0.43% | RSI: 78.5 | % above MA200: +58.3% | Trend: Above MA20, MA50, MA200
Paycom Software Inc provides cloud-based human capital management software, streamlining payroll and HR processes for businesses. Investors should care due to its innovative solutions that enhance operational efficiency, driving demand in a competitive market.
The current technical situation shows bullish momentum with an RSI of 78.5 and a strong MA alignment: price > MA20 > MA50 > MA200, indicating a sustained uptrend.
Related headlines
- Oklahoma Sports Hall of Fame and Jim Thorpe Association Proudly Reveal the Paycom Jim Thorpe Award 2026 Preseason Watch List
- Paycom Software, Inc. Q2 2026 Earnings Call Summary
- Paycom jumps premarket after earnings; Data storage companies fall
- Paycom Software Inc (PAYC) (Q2 2026) Earnings Call Highlights: Record Margins and Strategic ...
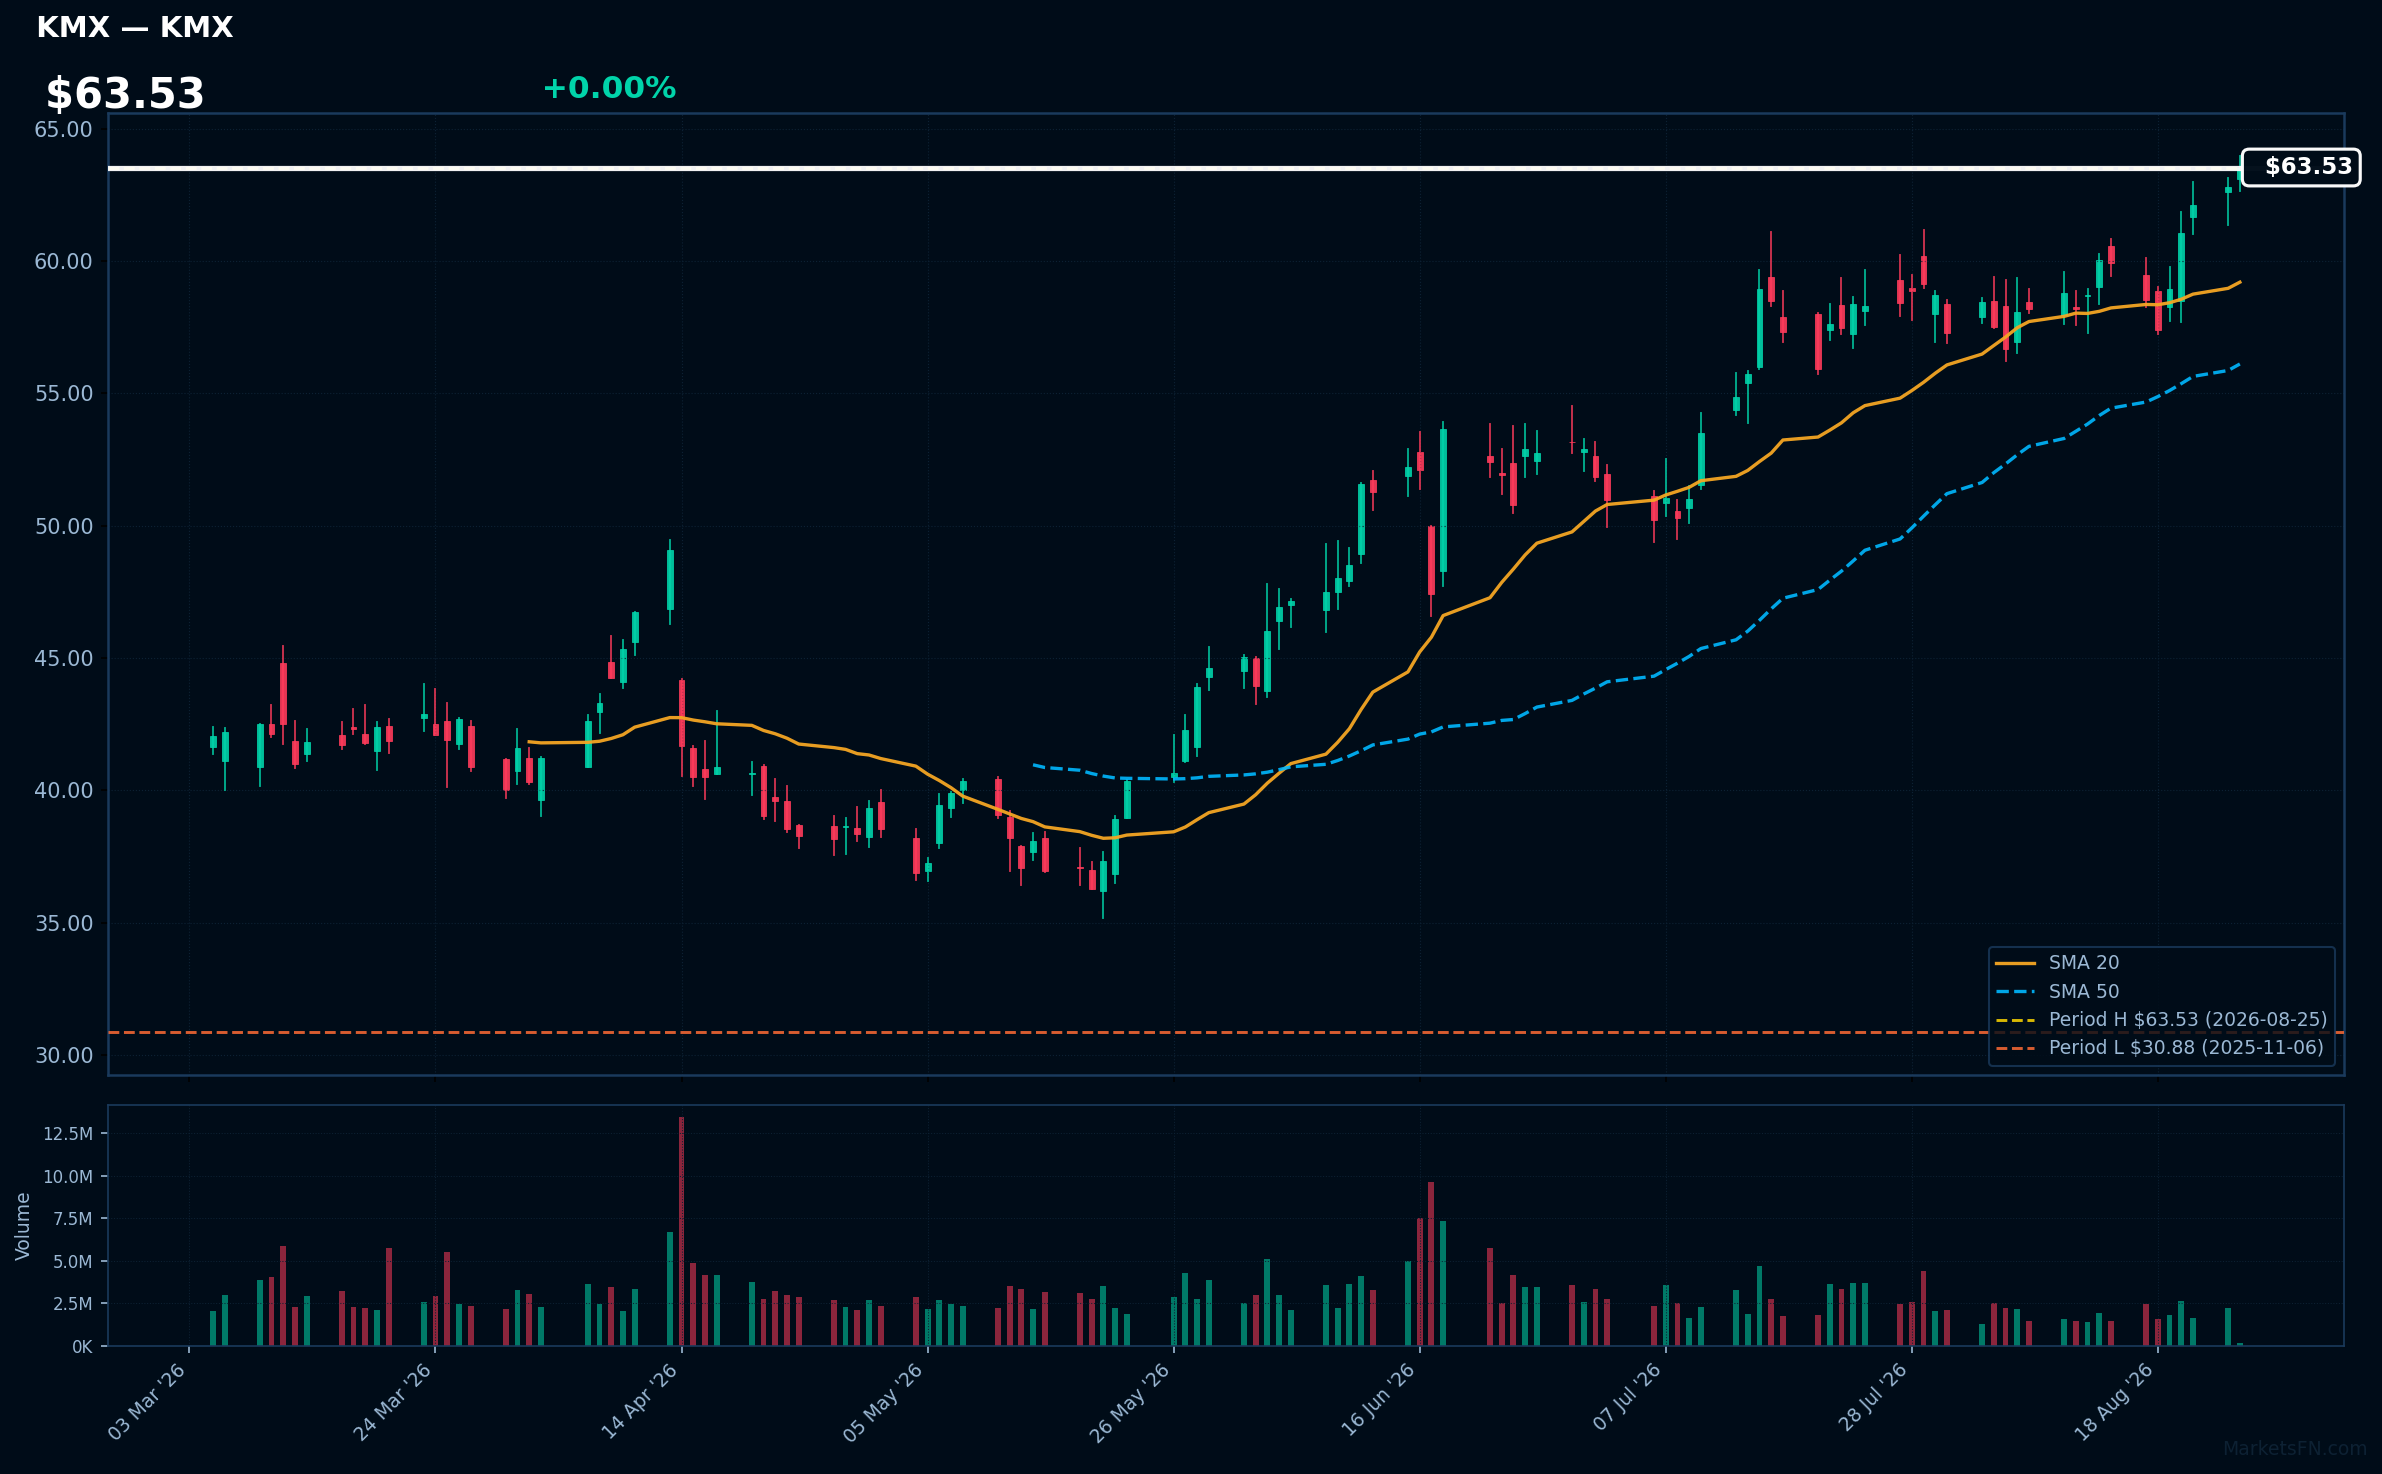
KMX | Carmax Inc | Consumer Cyclical | Price Last: $63.53 | % Realized: +6.13% | RSI: 69.4 | % above MA200: +40.8% | Trend: Above MA20, MA50, MA200
Carmax Inc operates as a used car retailer, providing a no-haggle pricing model and a wide selection of vehicles. Investors should care due to its strong market position and consistent growth in a competitive automotive sector.
Carmax shows bullish momentum with an RSI(14) of 69.4 and a strong MA alignment: price > MA20 > MA50 > MA200, indicating a sustained uptrend and proximity to its 52-Week high.
Related headlines
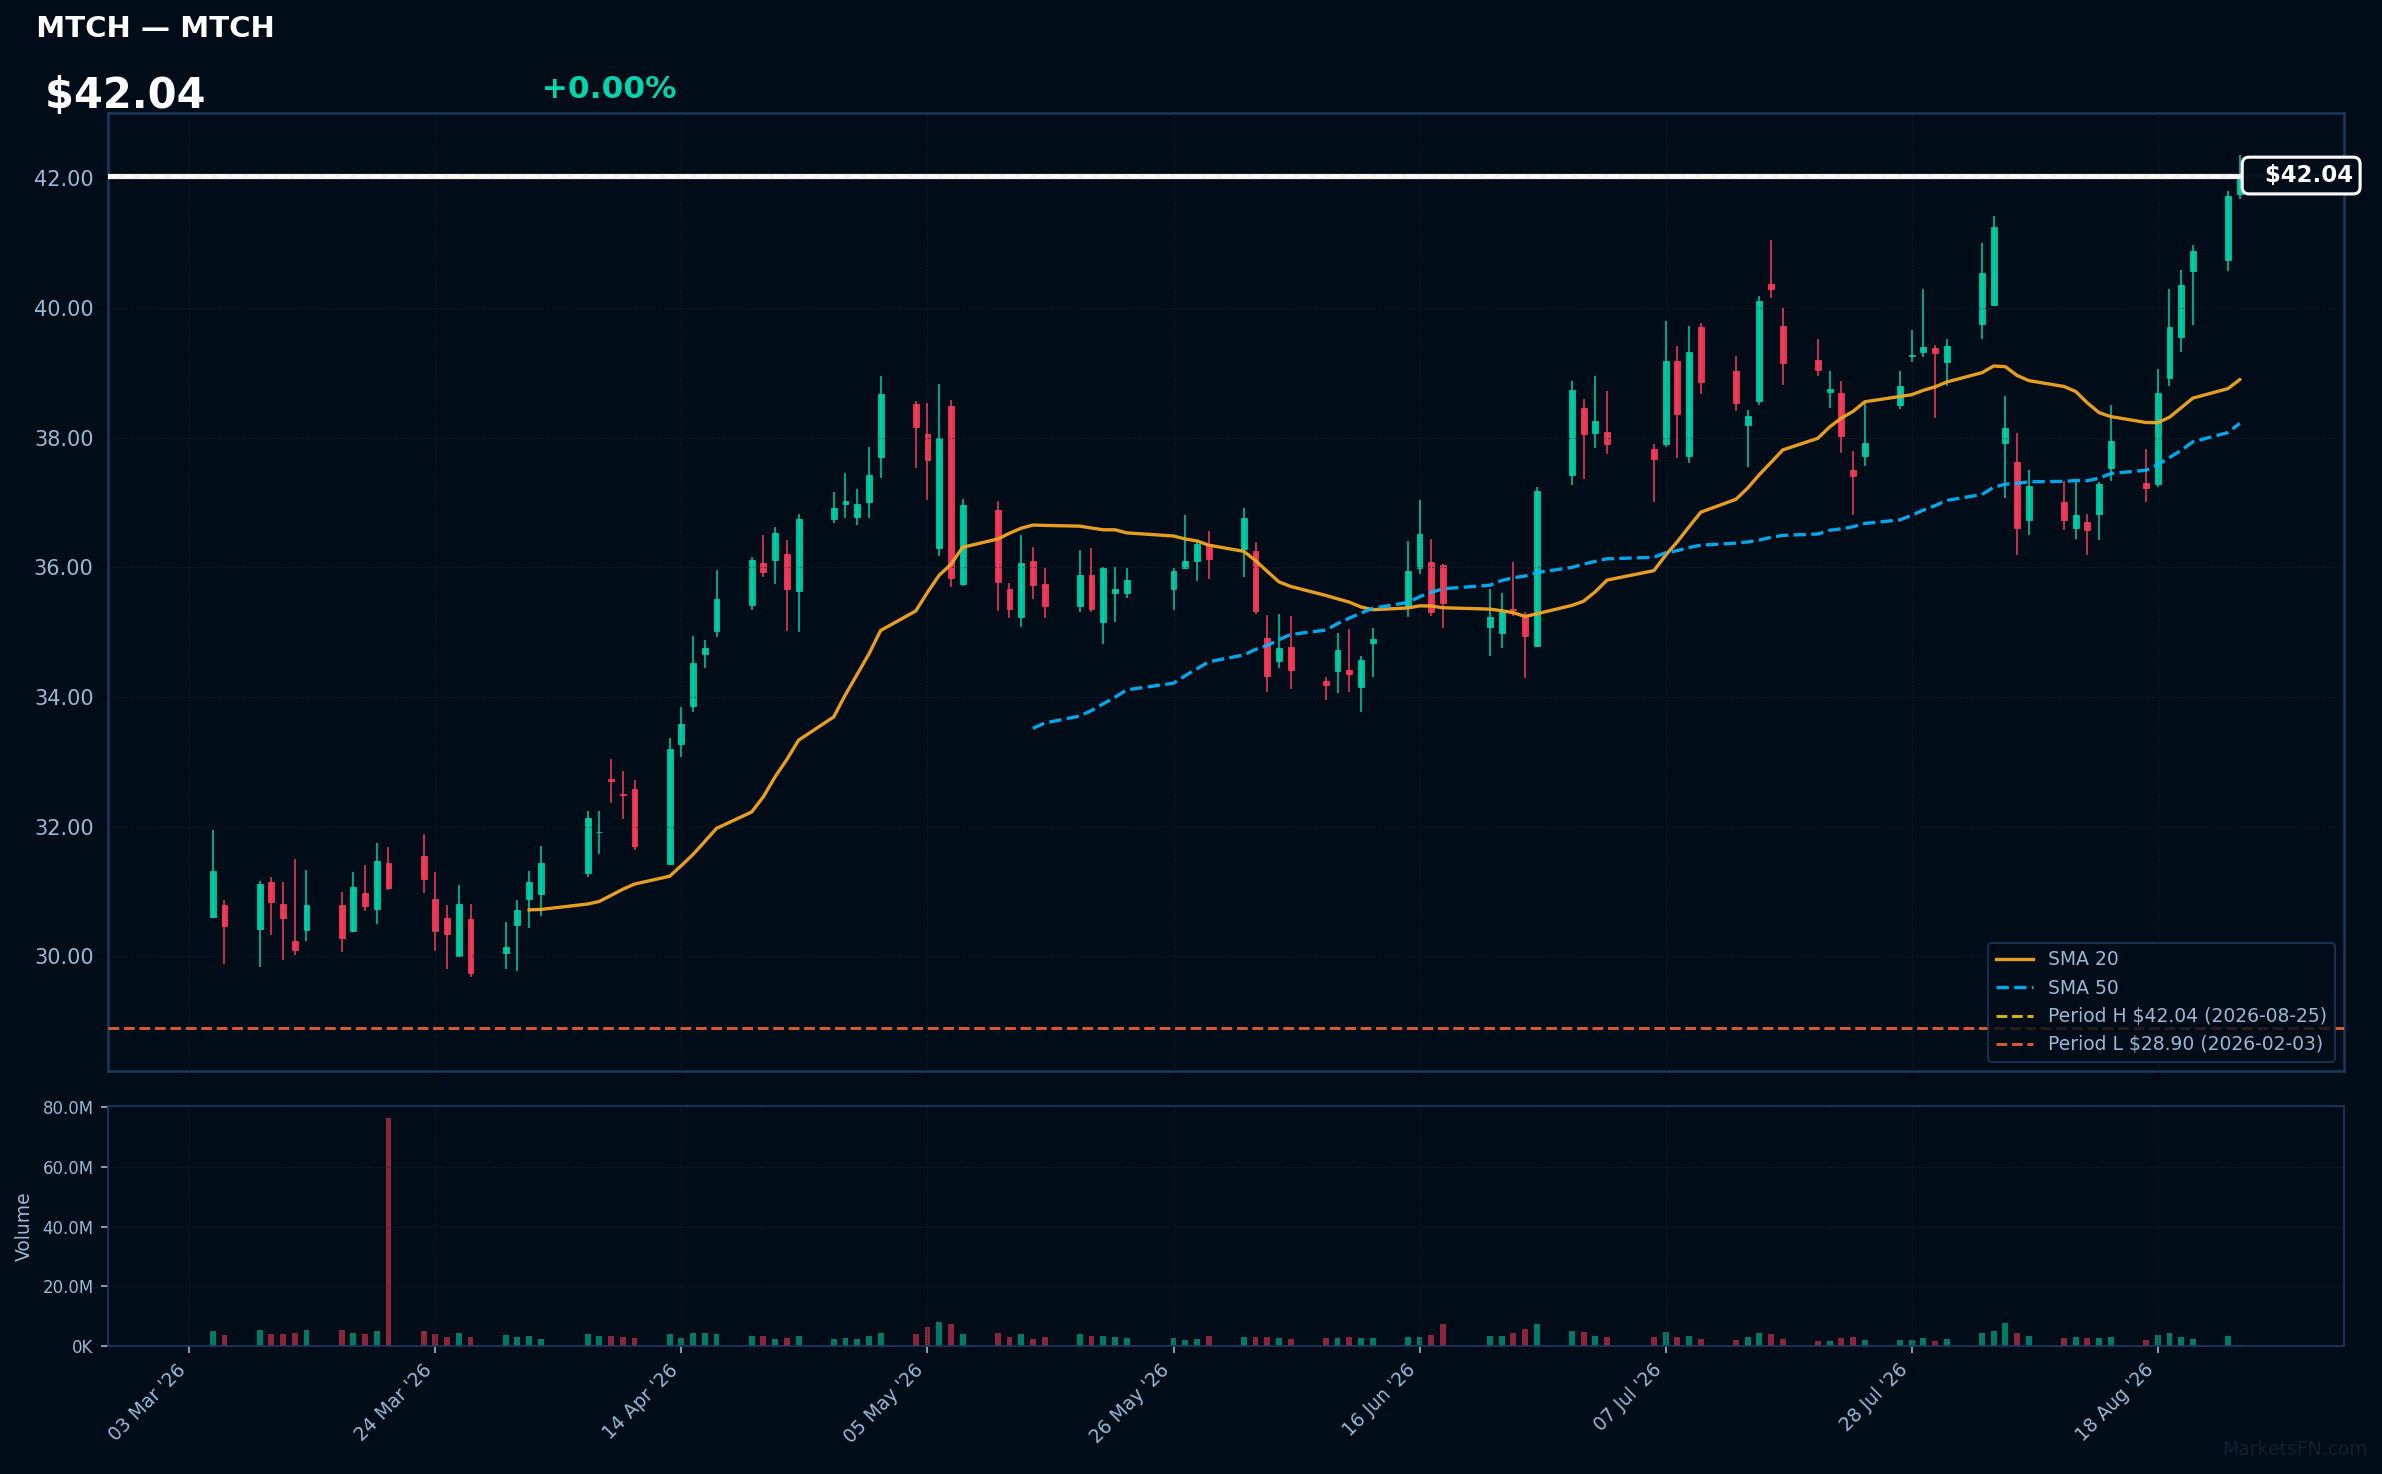
MTCH | Match Group Inc | Communication Services | Price Last: $42.04 | % Realized: +13.07% | RSI: 66.6 | % above MA200: +22.5% | Trend: Above MA20, MA50, MA200
Match Group Inc operates dating services, including Tinder and OkCupid, catering to diverse demographics. Investors should care due to its significant market share and growth potential in the online dating sector, which continues to expand globally.
The current technical situation shows bullish momentum with an RSI(14) of 66.6 and a strong MA alignment: price > MA20 > MA50 > MA200, indicating a sustained uptrend.
Related headlines
📉 Nearest to 52-Week Low
Sectors represented: Industrials (2), Communication Services (2), Utilities (1)
| Ticker | Company | Sector | Price Last | % Realized | 52-Week Low Date | RSI | % above MA200 | Trend |
|---|---|---|---|---|---|---|---|---|
| LHX | L3Harris Technologies Inc | Industrials | $262.57 | -4.92% | 2026-08-25 | 32.8 | -16.7% | Below MA20, MA50, MA200 |
| LII | Lennox International Inc | Industrials | $392.15 | -31.27% | 2026-08-25 | 27.9 | -21.9% | Below MA20, MA50, MA200 |
| CMS | CMS Energy Corporation | Utilities | $68.53 | -5.11% | 2026-08-21 | 32.4 | -7.1% | Below MA20, MA50, MA200 |
| EA | Electronic Arts, Inc | Communication Services | $209.70 | +0.38% | 2026-07-17 | — | — | — |
| TTD | Trade Desk Inc | Communication Services | $13.26 | -74.68% | 2026-08-21 | 32.2 | -49.4% | Below MA20, MA50, MA200 |
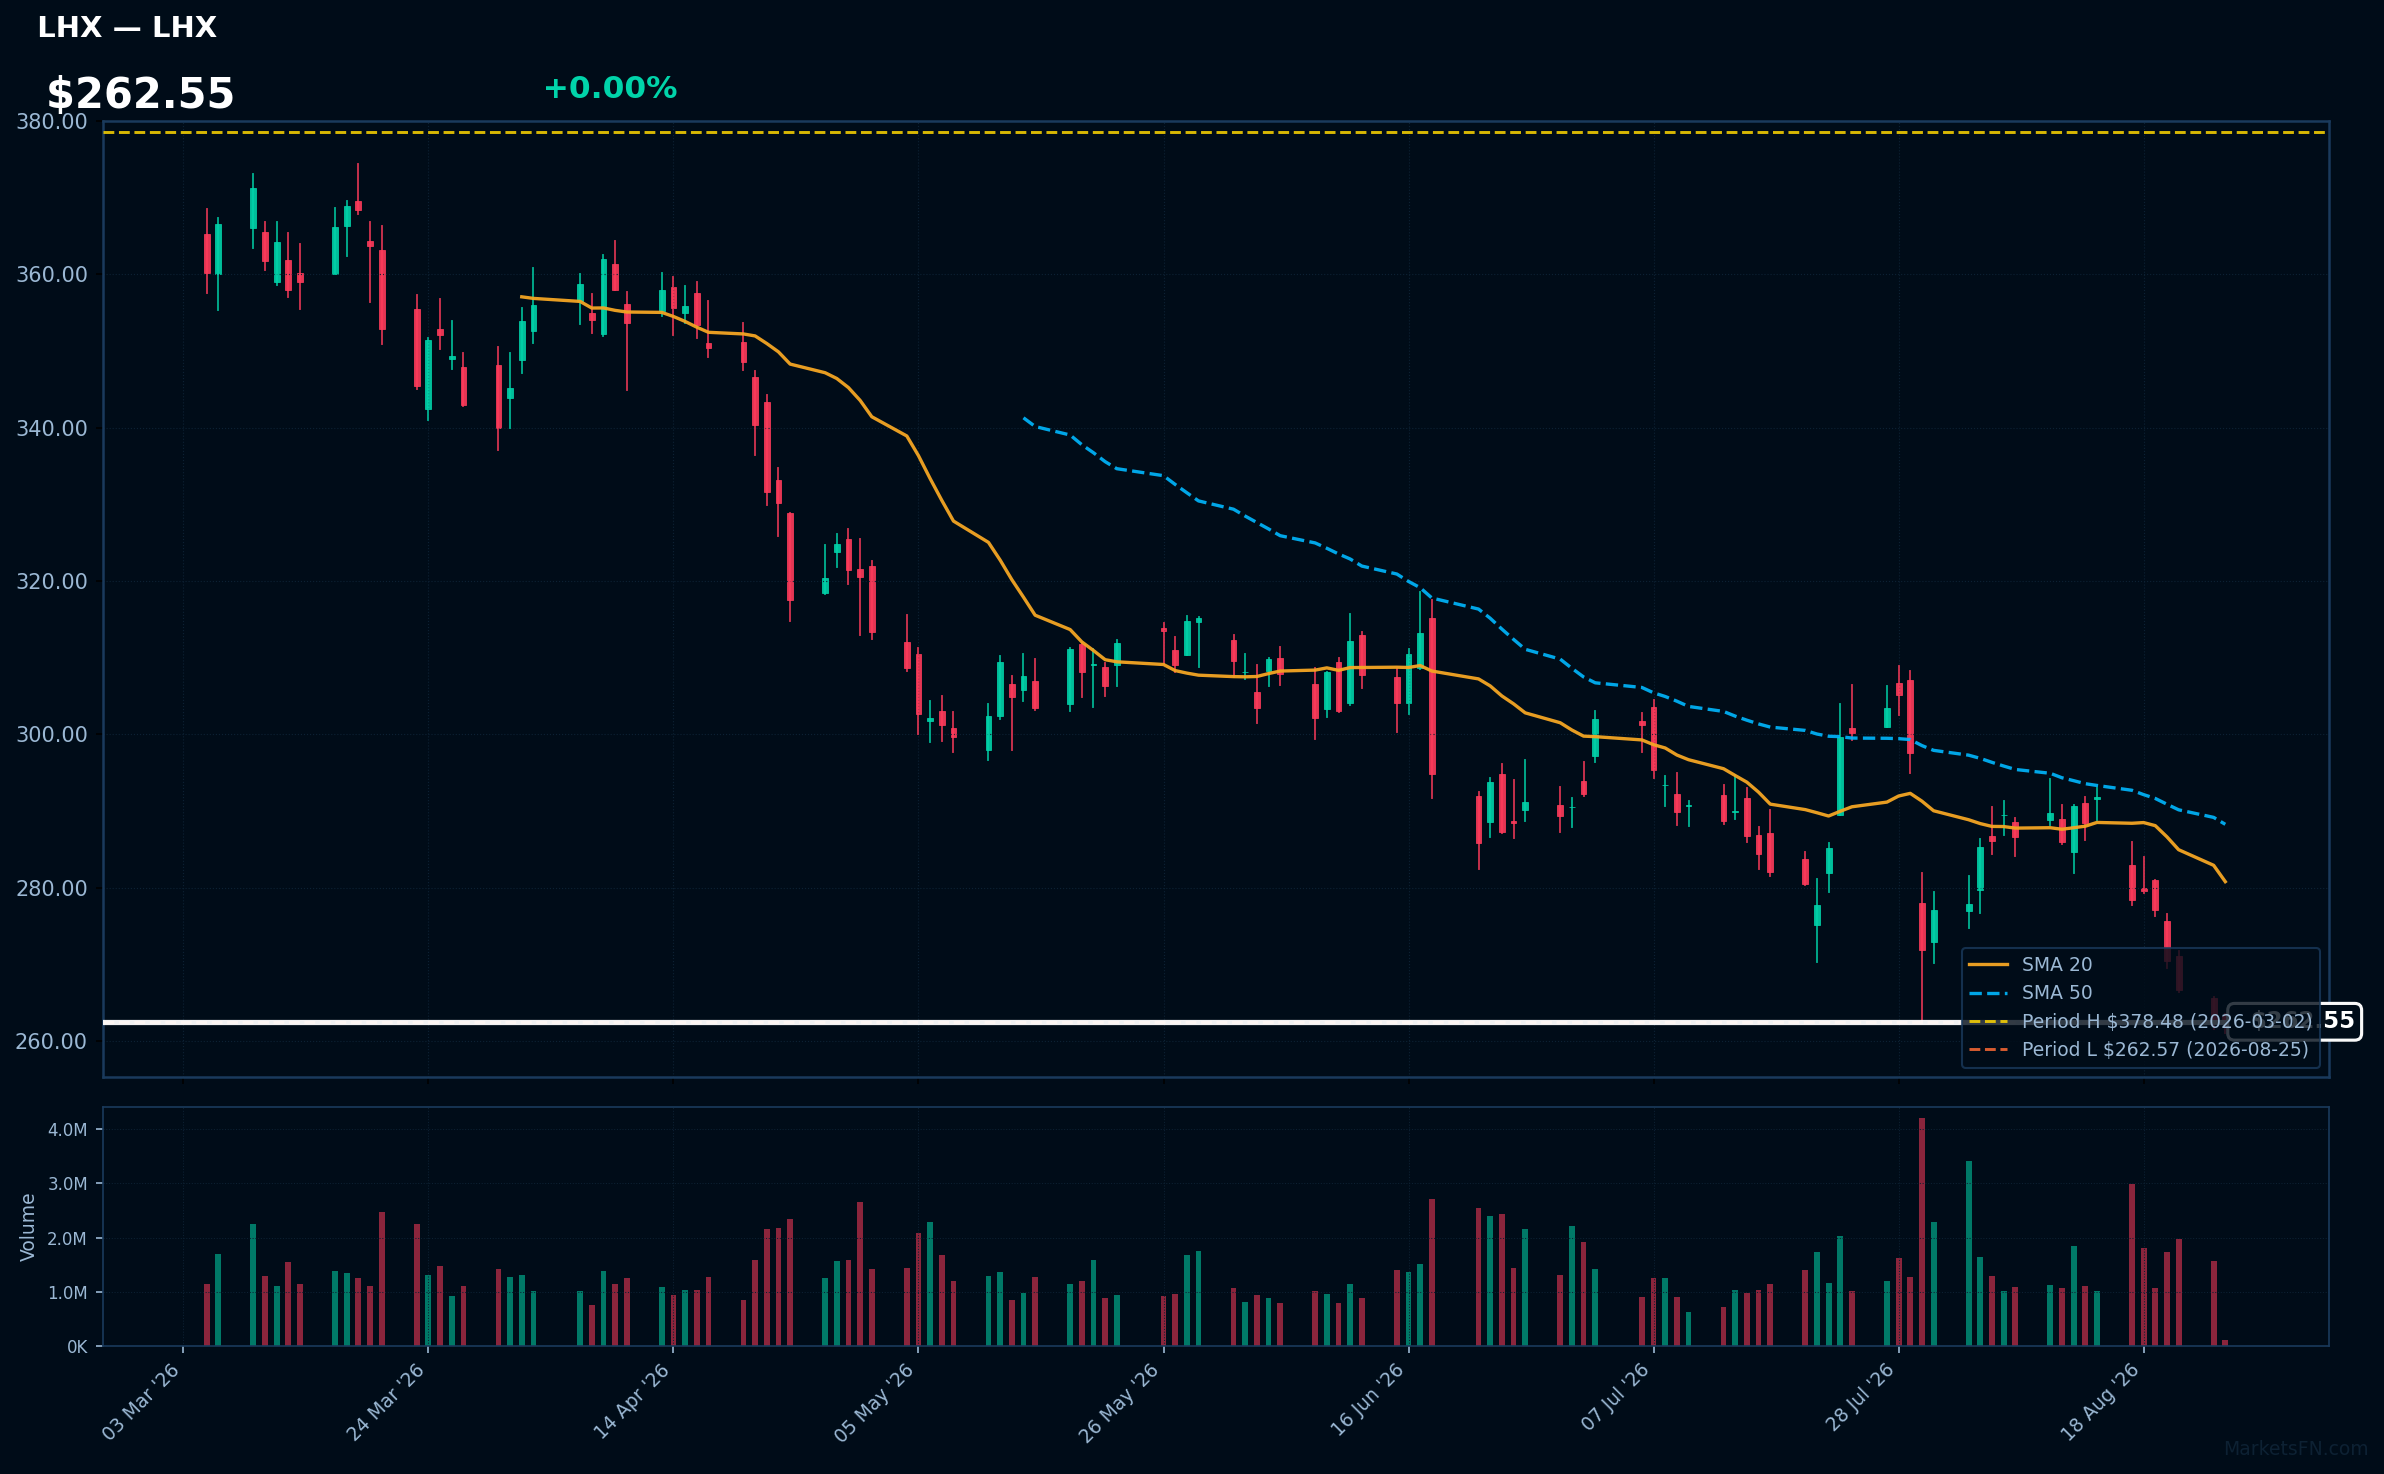
LHX | L3Harris Technologies Inc | Industrials | Price Last: $262.57 | % Realized: -4.92% | RSI: 32.8 | % above MA200: -16.7% | Trend: Below MA20, MA50, MA200
L3Harris Technologies Inc specializes in communication and electronic systems for defense and civil markets, providing critical technologies for military operations, cybersecurity, and air traffic management. Investors should care due to its strategic role in national security and potential growth in defense spending.
The current technical situation indicates a warning sign, with an RSI(14) of 32.8 and a bearish MA alignment: price < MA20 < MA50 < MA200, suggesting a sustained downtrend and testing major support just 0.0% above its 52-Week low.
Related headlines
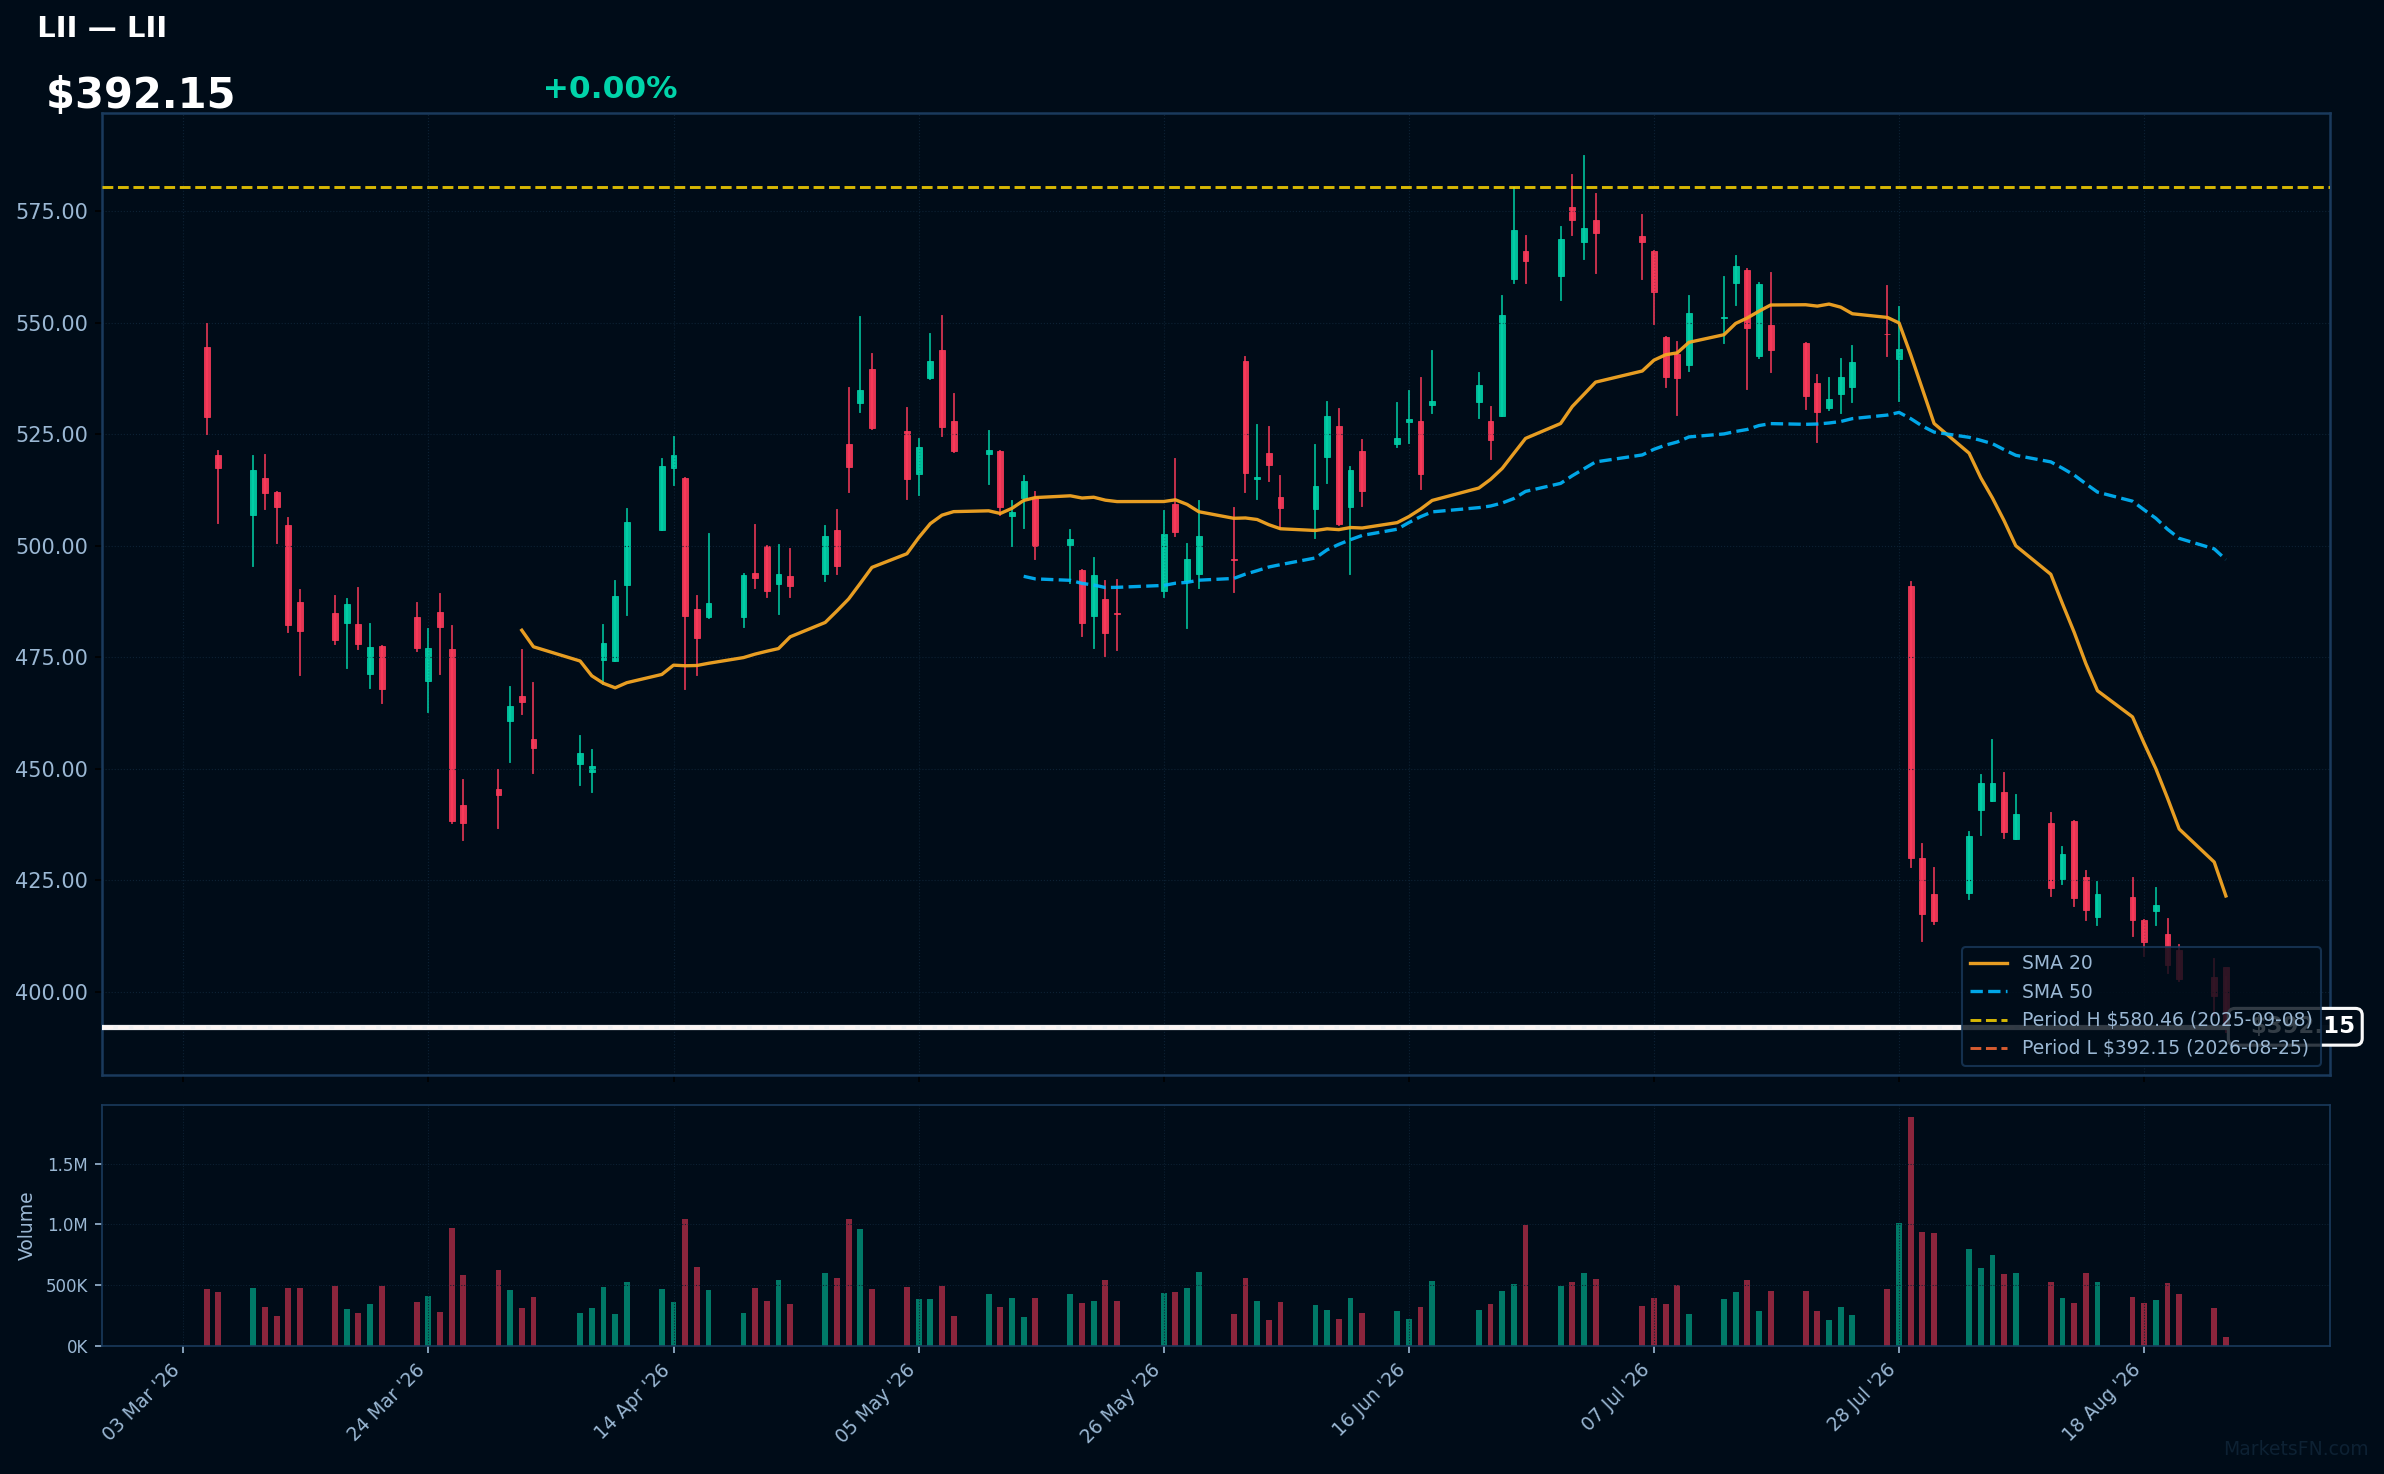
LII | Lennox International Inc | Industrials | Price Last: $392.15 | % Realized: -31.27% | RSI: 27.9 | % above MA200: -21.9% | Trend: Below MA20, MA50, MA200
Lennox International Inc designs and manufactures heating, ventilation, and air conditioning (HVAC) systems. Investors should care due to its significant market presence and the impact of seasonal demand on its revenue, particularly in residential and commercial sectors.
The current technical situation indicates a bearish trend, with an RSI(14) of 27.9 and a MA alignment of price < MA20 < MA50 < MA200, suggesting sustained downtrend and potential warning signs for investors.
Related headlines
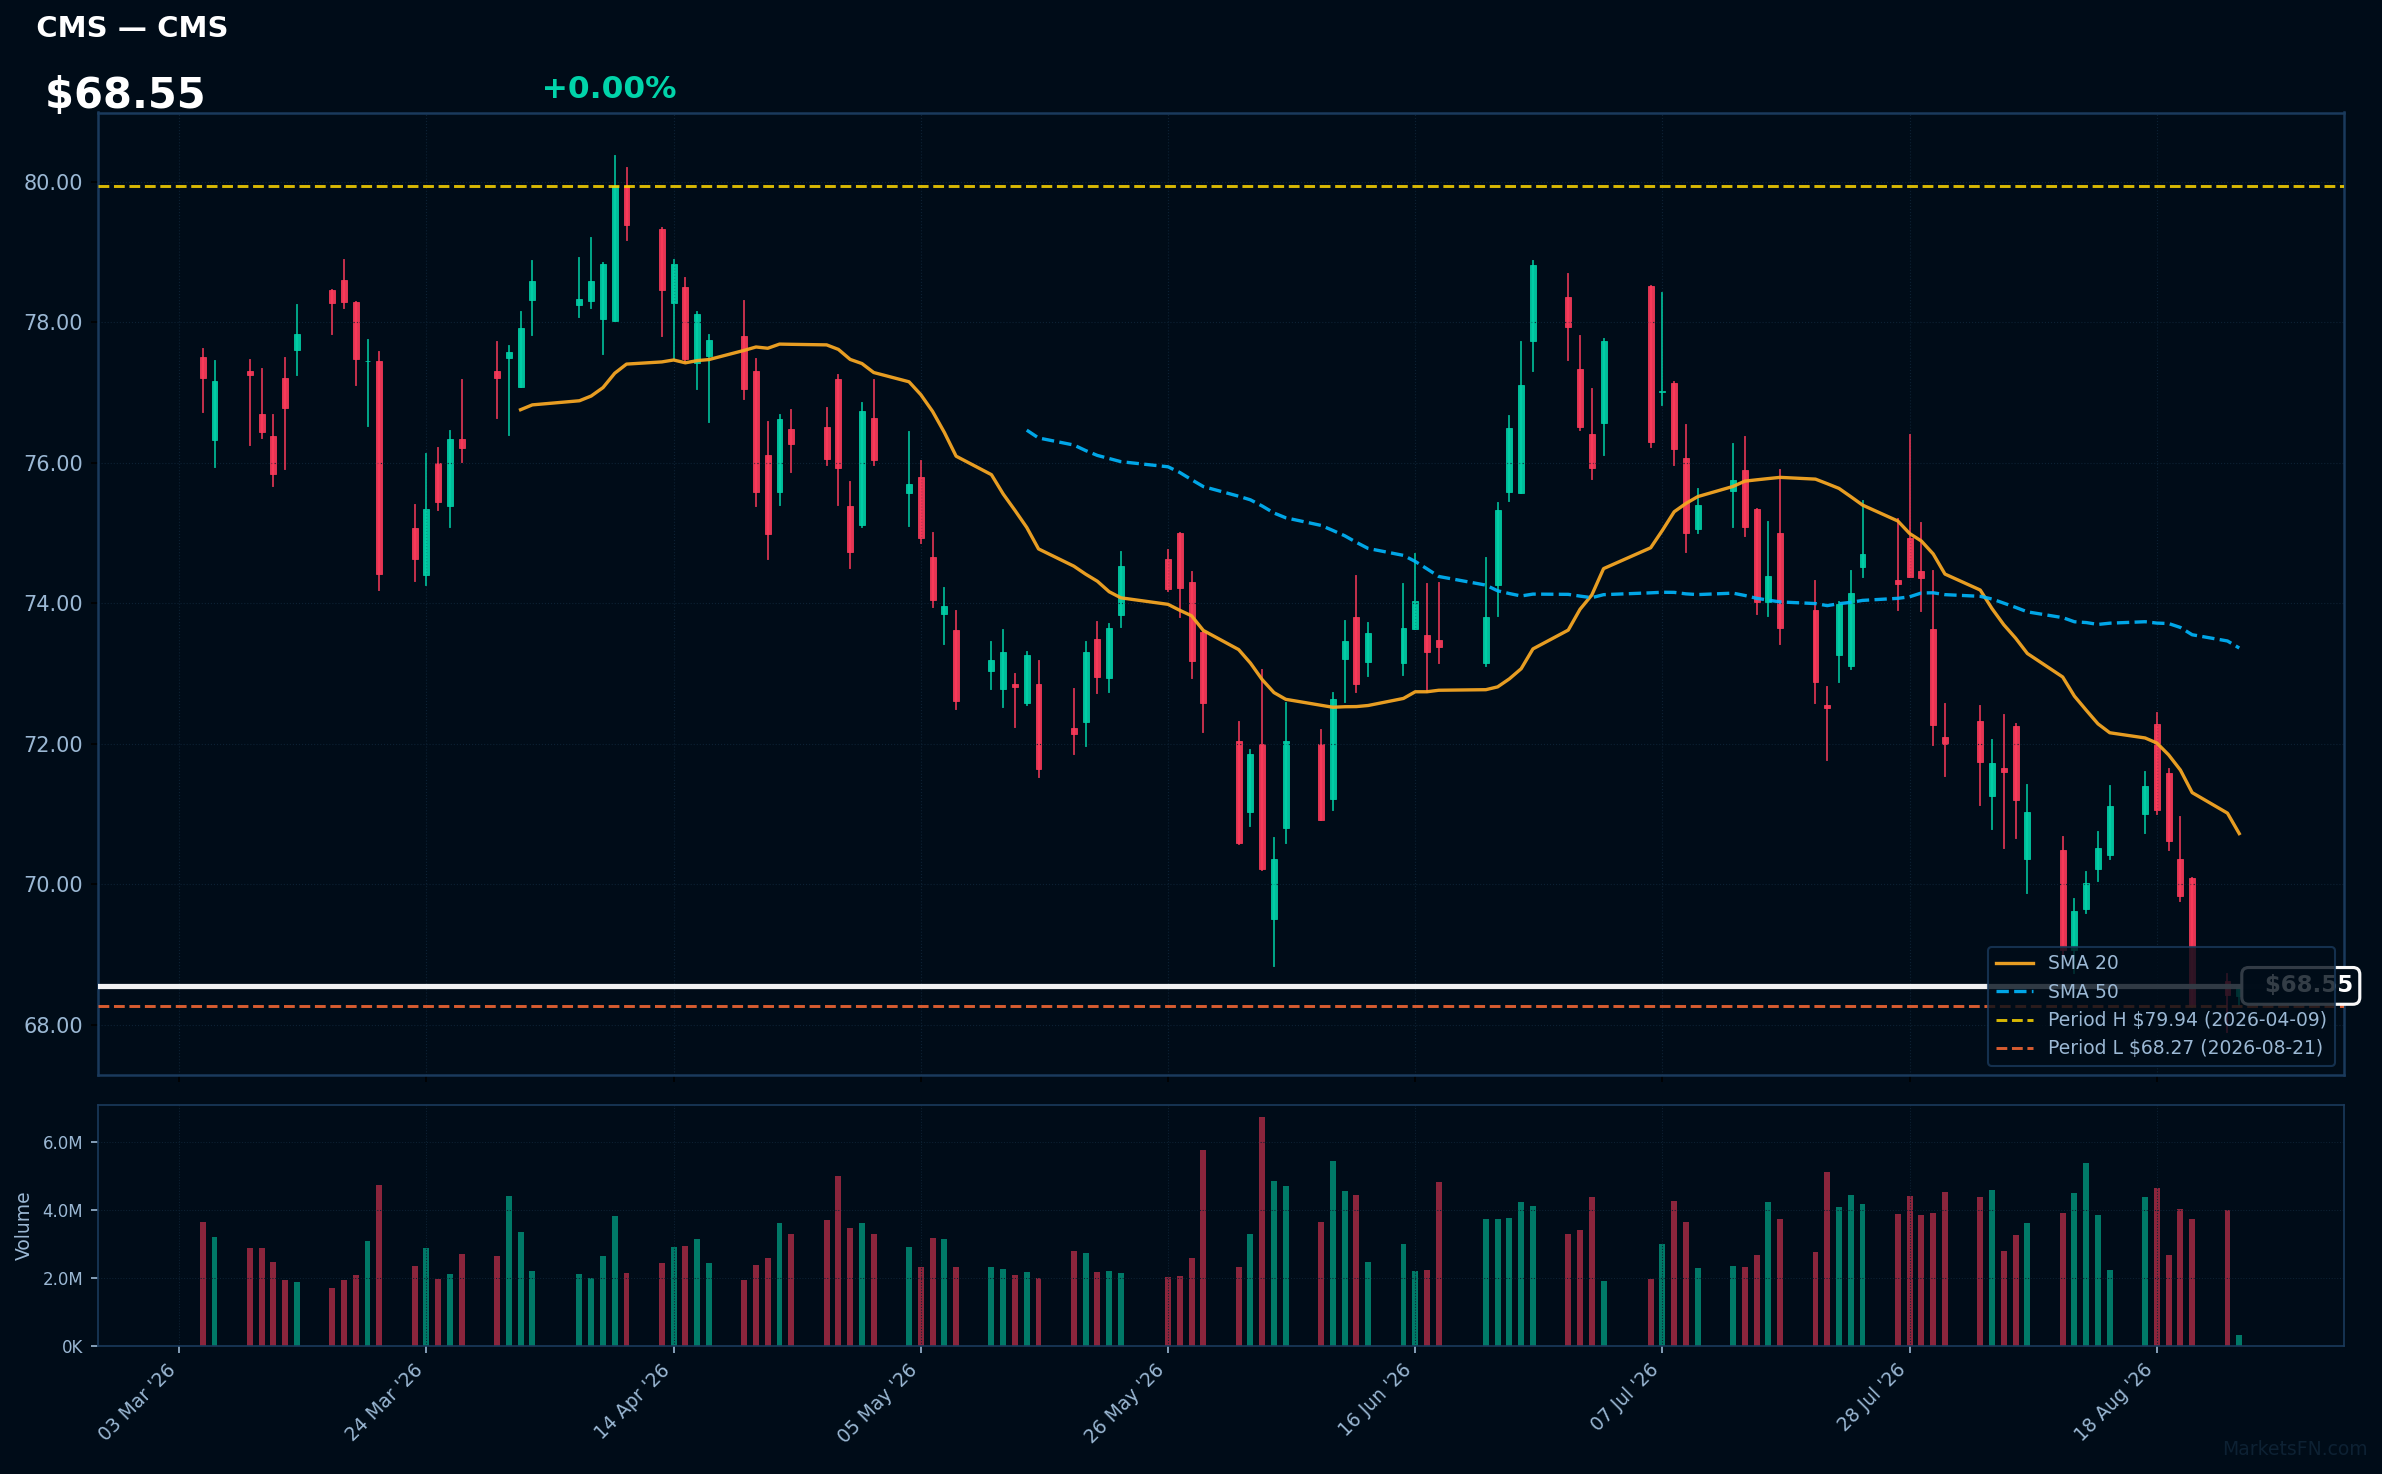
CMS | CMS Energy Corporation | Utilities | Price Last: $68.53 | % Realized: -5.11% | RSI: 32.4 | % above MA200: -7.1% | Trend: Below MA20, MA50, MA200
CMS Energy Corporation is a utility company focused on providing electricity and natural gas to customers in Michigan. Investors should care due to its essential services, regulatory environment, and potential for stable dividends, which can be attractive in volatile markets.
The current technical situation indicates a bearish trend with an RSI(14) of 32.4 and a MA alignment of price < MA20 < MA50 < MA200, suggesting a sustained downtrend and testing major support just 0.4% above its 52-Week low.
Related headlines
- Why Did APP, CMS, MVIS Stocks Plunge To 52-Week Lows Last Week?
- Consumers Energy Invests in Reliability Upgrades to Secure the Grid for Michigan Customers
- Consumers Energy Secures Natural Gas System with Nearly 150 Miles of Upgrades Across Michigan
- Consumers Energy Foundation launches Community Impact Awards with Grants up to $20,000
EA | Electronic Arts, Inc | Communication Services | Price Last: $209.70 | % Realized: +0.38% | RSI: — | % above MA200: — | Trend: —
Electronic Arts, Inc. develops and publishes interactive entertainment software, known for franchises like FIFA and The Sims. Investors should care due to its strong market position and potential for growth in the gaming industry, especially with ongoing trends in digital gaming and esports.
The stock is 0.0% below its 52-Week high, indicating a potential breakout level. However, RSI(14) data is N/A and MA data is incomplete, limiting the assessment of momentum or fundamental strength.
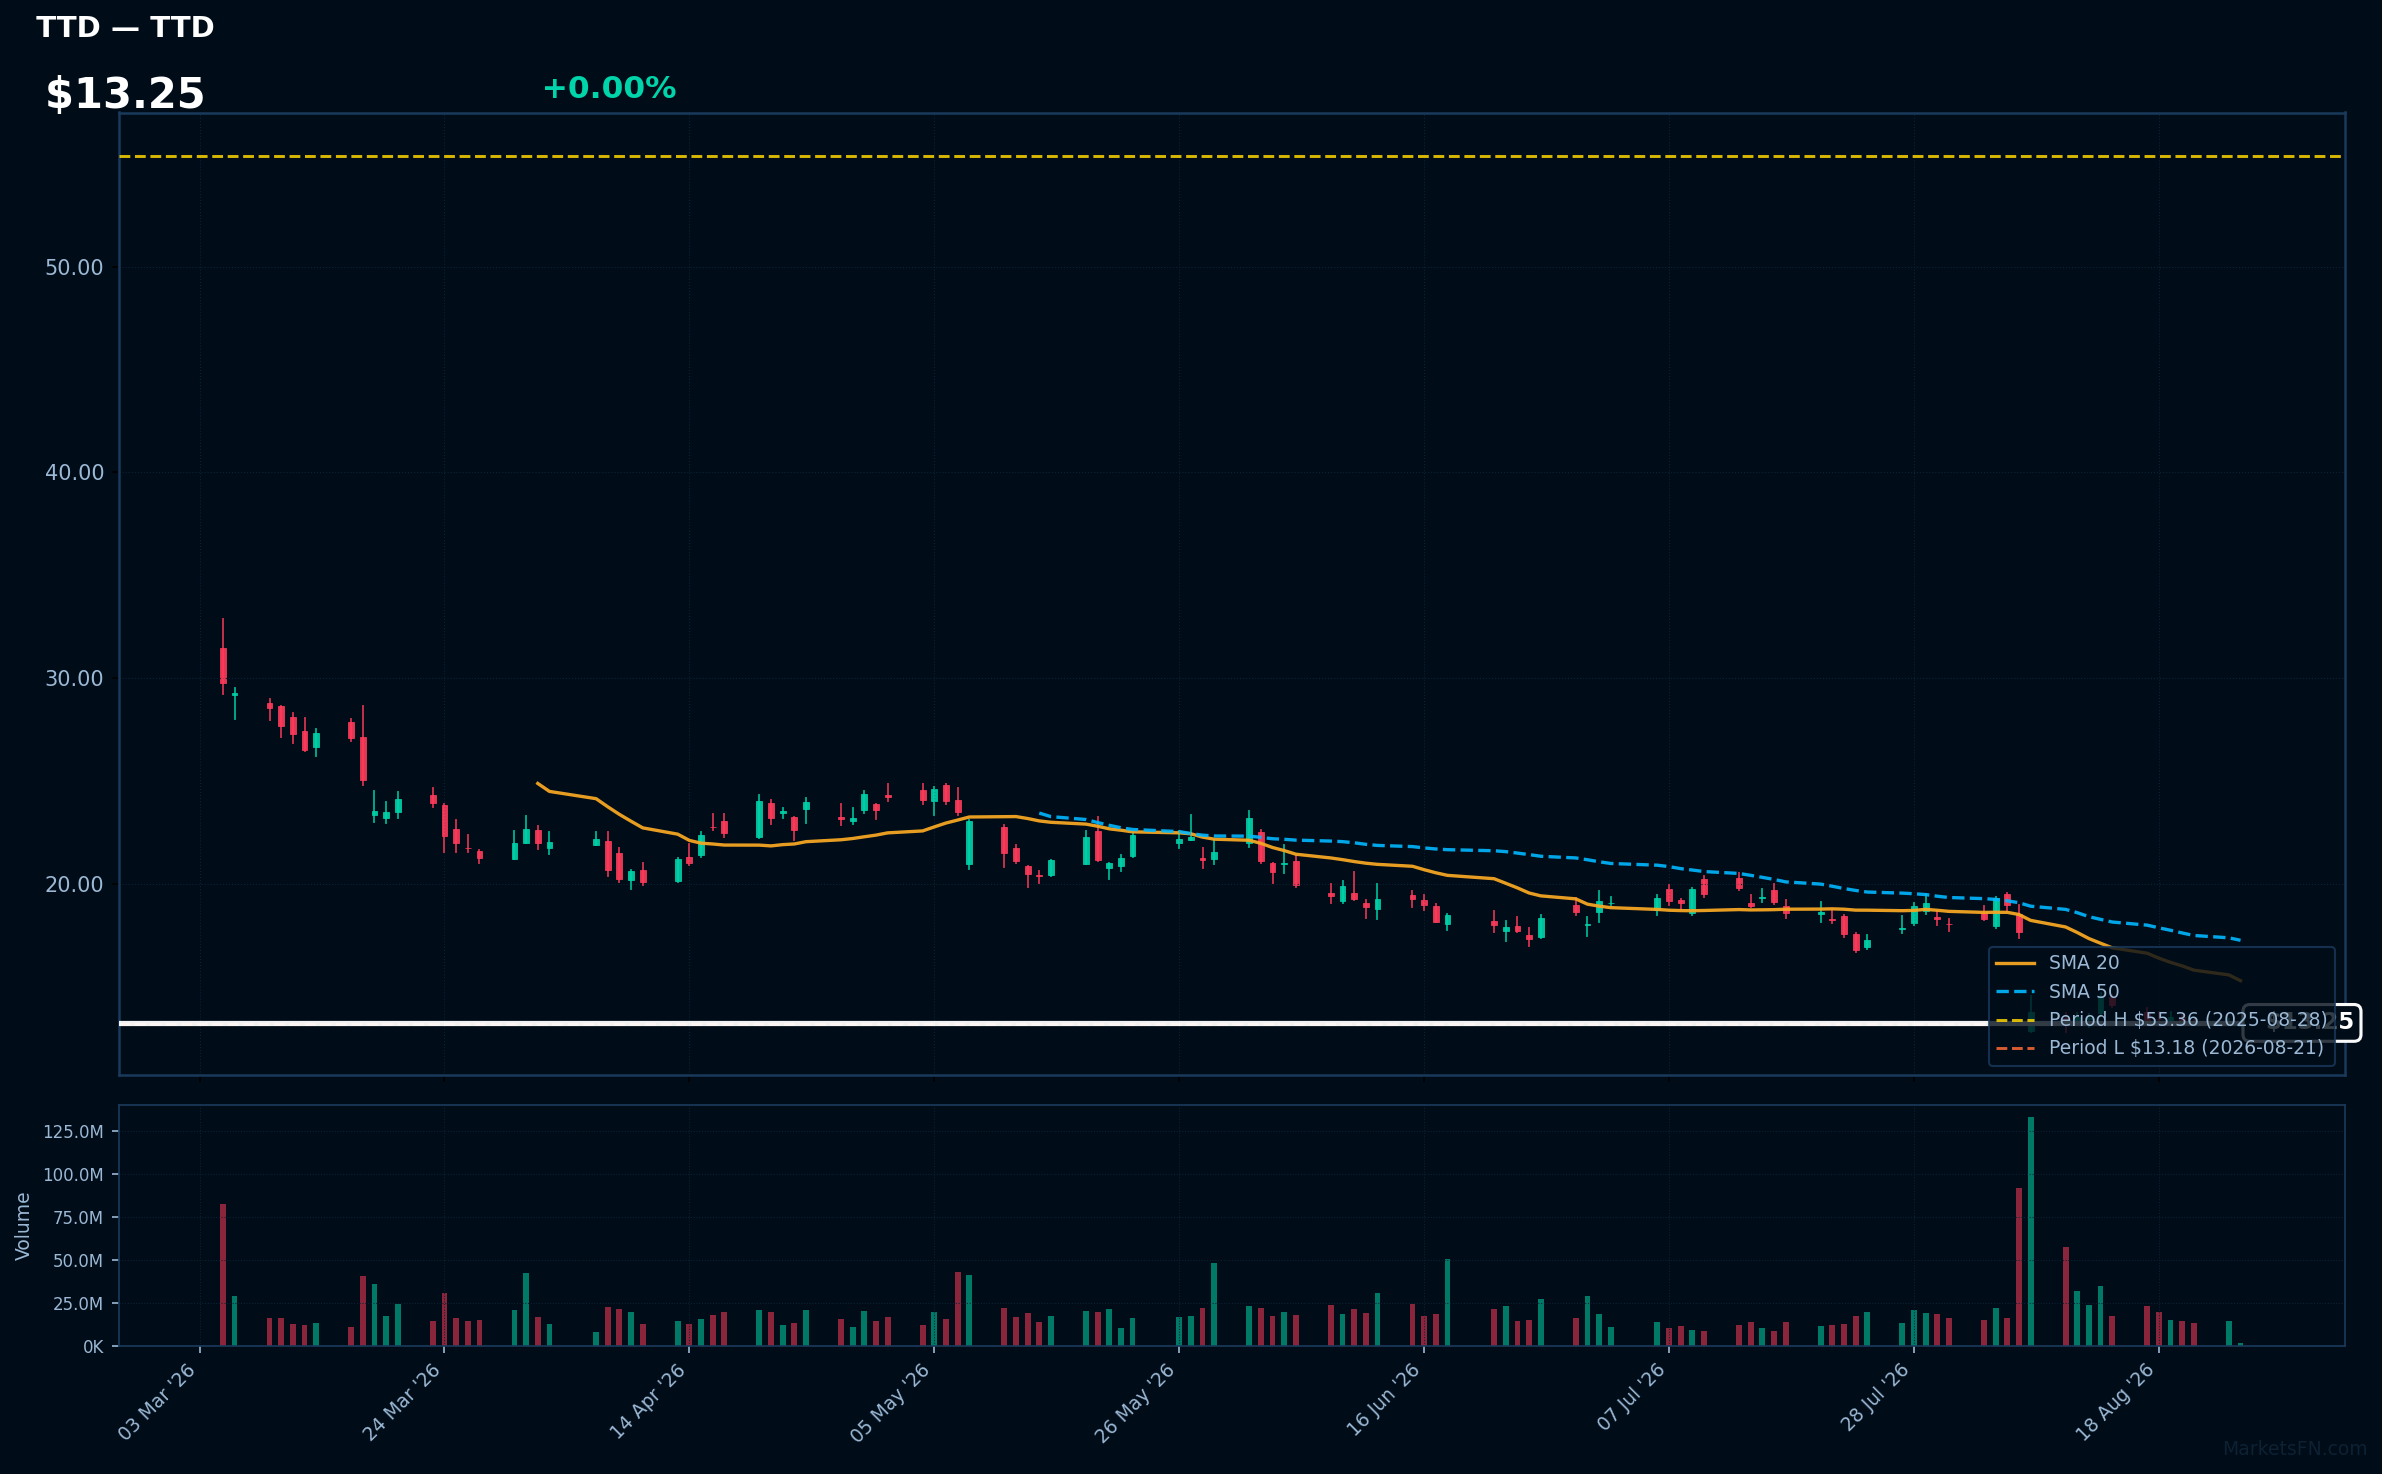
TTD | Trade Desk Inc | Communication Services | Price Last: $13.26 | % Realized: -74.68% | RSI: 32.2 | % above MA200: -49.4% | Trend: Below MA20, MA50, MA200
Trade Desk Inc (TTD) operates a digital advertising platform that enables advertisers to purchase and manage data-driven digital ad campaigns across various channels, including display, video, and social media. Investors should care due to its significant market position in programmatic advertising.
The current technical situation indicates a warning sign, with an RSI(14) of 32.2 and a bearish MA alignment: price < MA20 < MA50 < MA200, reflecting a sustained downtrend. The stock is also only 0.6% above its 52-Week low.
Related headlines
Market Commentary
The presence of S&P 500 stocks near 52-week extremes signals significant market sentiment and investor behavior. Stocks like Merck & Co Inc (MRK), Electronic Arts, Inc (EA), and Paycom Software Inc (PAYC) are at their 52-week highs, indicating strong demand and bullish sentiment. Conversely, stocks such as L3Harris Technologies Inc (LHX) and Lennox International Inc (LII) are near their 52-week lows, suggesting potential bearish sentiment or sector-specific challenges.
Sector rotation may be influencing these price levels, with technology and consumer discretionary sectors showing strength, as evidenced by EA and Paycom's positions near highs. Meanwhile, the presence of stocks like CMS Energy Corporation and Trade Desk Inc near their lows may reflect broader macroeconomic themes, such as rising interest rates or shifts in consumer spending patterns that impact specific industries differently.
Key levels to watch include the 52-week highs for the leading stocks, which could serve as resistance points if the momentum falters. For those near lows, any significant recovery could indicate a reversal. Potential catalysts include upcoming earnings reports, economic data releases, and changes in monetary policy that could impact investor sentiment and sector performance.
Methodology: All 503 S&P 500 constituents screened. 52-week high = highest daily close over the past 252 trading days (approx. 1 year). 52-week low = lowest daily close over the same period. Distance = (current price / extreme − 1) × 100. Technical indicators computed on up to 1 year of daily OHLCV data.
Disclaimer: For informational purposes only. Not investment advice. Past performance is not indicative of future results.