S&P 500 52-Week Highs & Lows Radar: Phillips 66 (PSX), TJXmpanies, (TJX) and more
MarketsFN Team

S&P 500 52-Week Highs & Lows Radar: Phillips 66 (PSX), TJXmpanies, (TJX) and more
Screening all 503 S&P 500 constituents for stocks nearest to their 52-week high and their 52-week low. Data as of September 10, 2026. % Realized = 52-week total return.
Legend: RSI > 70 = overbought · RSI < 30 = oversold · Green % Realized = positive 52W return · Red = negative.
📈 Nearest to 52-Week High
Sectors represented: Energy (2), Communication Services (1), Healthcare (1), Consumer Defensive (1)
| Ticker | Company | Sector | Price Last | % Realized | 52-Week High Date | RSI | % above MA200 | Trend |
|---|---|---|---|---|---|---|---|---|
| PSX | Phillips 66 | Energy | $261.41 | +98.91% | 2026-09-10 | 78.2 | +50.0% | Above MA20, MA50, MA200 |
| EA | Electronic Arts, Inc | Communication Services | $209.70 | +0.38% | 2026-08-04 | — | — | — |
| HUM | Humana Inc | Healthcare | $410.02 | +49.87% | 2026-09-10 | 63.1 | +45.2% | Above MA20, MA50, MA200 |
| ADM | Archer Daniels Midland Co | Consumer Defensive | $88.18 | +43.60% | 2026-09-10 | 68.0 | +21.6% | Above MA20, MA50, MA200 |
| MPC | Marathon Petroleum Corp | Energy | $399.08 | +119.65% | 2026-09-09 | 80.4 | +63.1% | Above MA20, MA50, MA200 |
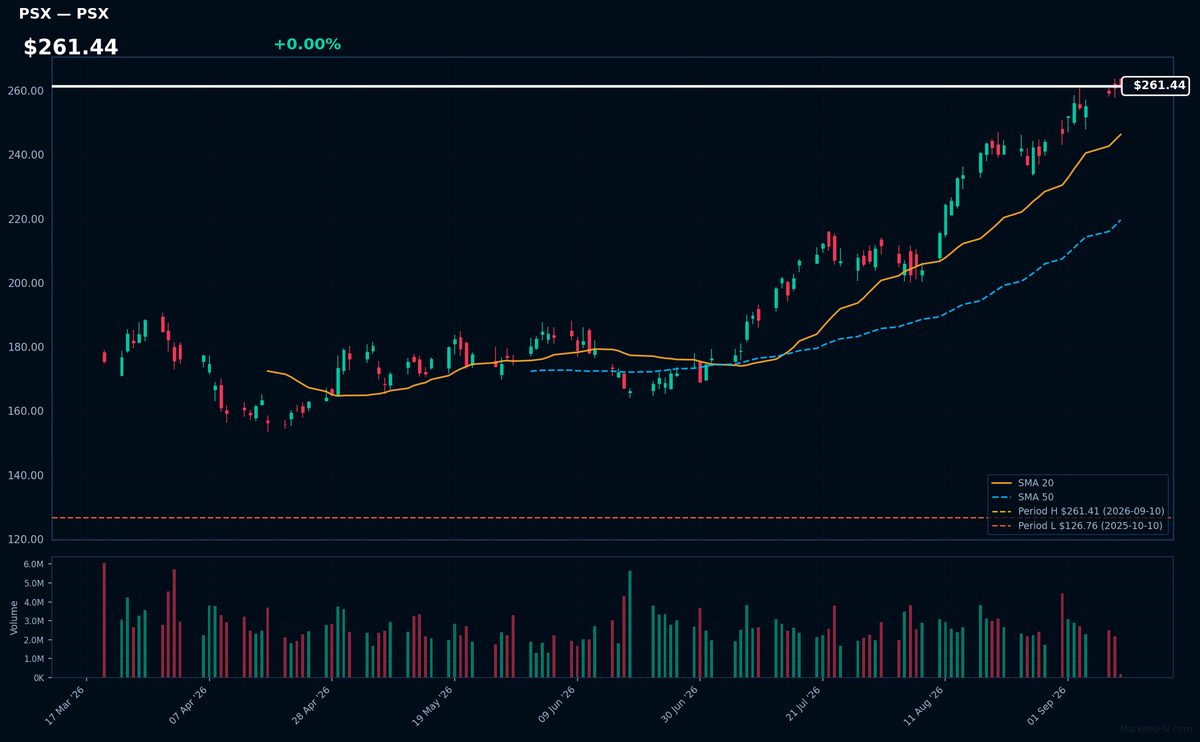
PSX | Phillips 66 | Energy | Price Last: $261.41 | % Realized: +98.91% | RSI: 78.2 | % above MA200: +50.0% | Trend: Above MA20, MA50, MA200
Phillips 66 is a diversified energy company with midstream, chemicals, refining, and marketing segments. Investors should care about its refining margins, midstream volumes, and chemicals demand, as these drive profitability and cash flow.
PSX's RSI(14) is 78.2, indicating strong momentum with price > MA20 > MA50 > MA200, a sustained uptrend. At 0.0% below its 52-Week high, it nears a potential breakout, with a 98.9% 52-Week return, suggesting continued upward pressure.
Related headlines
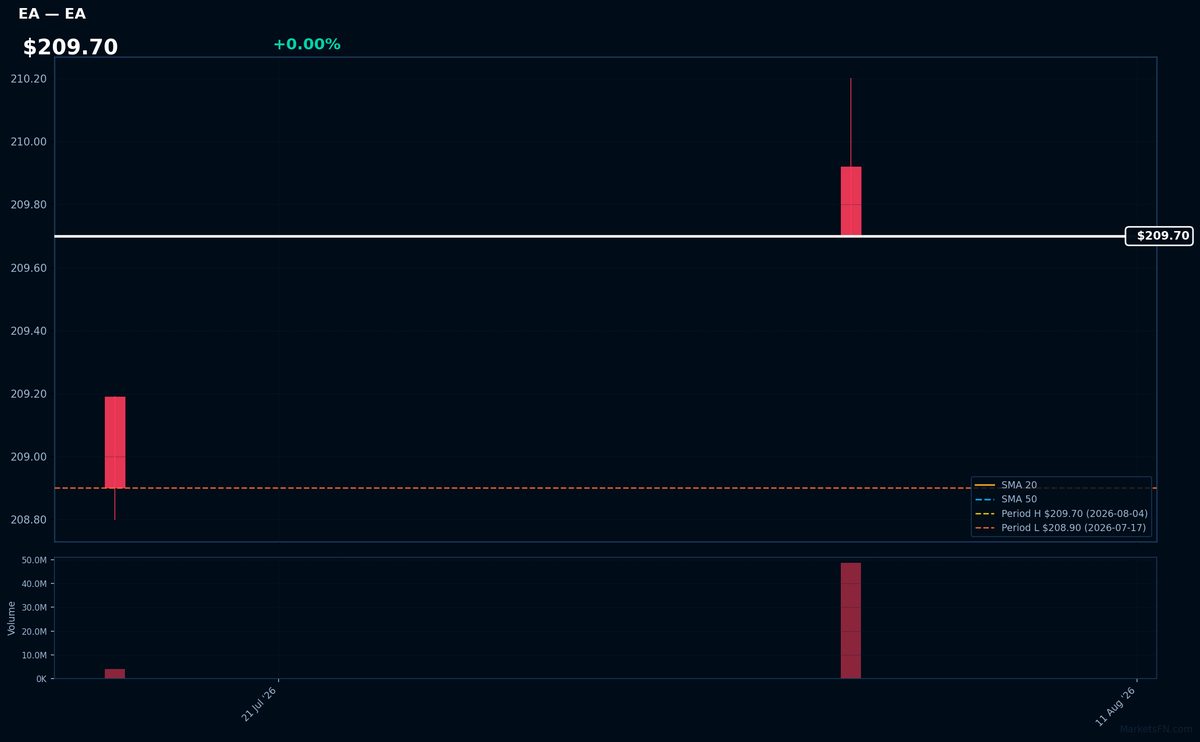
EA | Electronic Arts, Inc | Communication Services | Price Last: $209.70 | % Realized: +0.38% | RSI: — | % above MA200: — | Trend: —
Electronic Arts, Inc (EA) is a video game publisher with popular titles like FIFA and Madden NFL. Investors care about its ability to innovate and drive engagement in the gaming market, impacting revenue growth.
The stock is near its 52-Week high, up 0.4% over the period, with RSI and MA data unavailable. Its proximity to the high suggests a potential breakout.
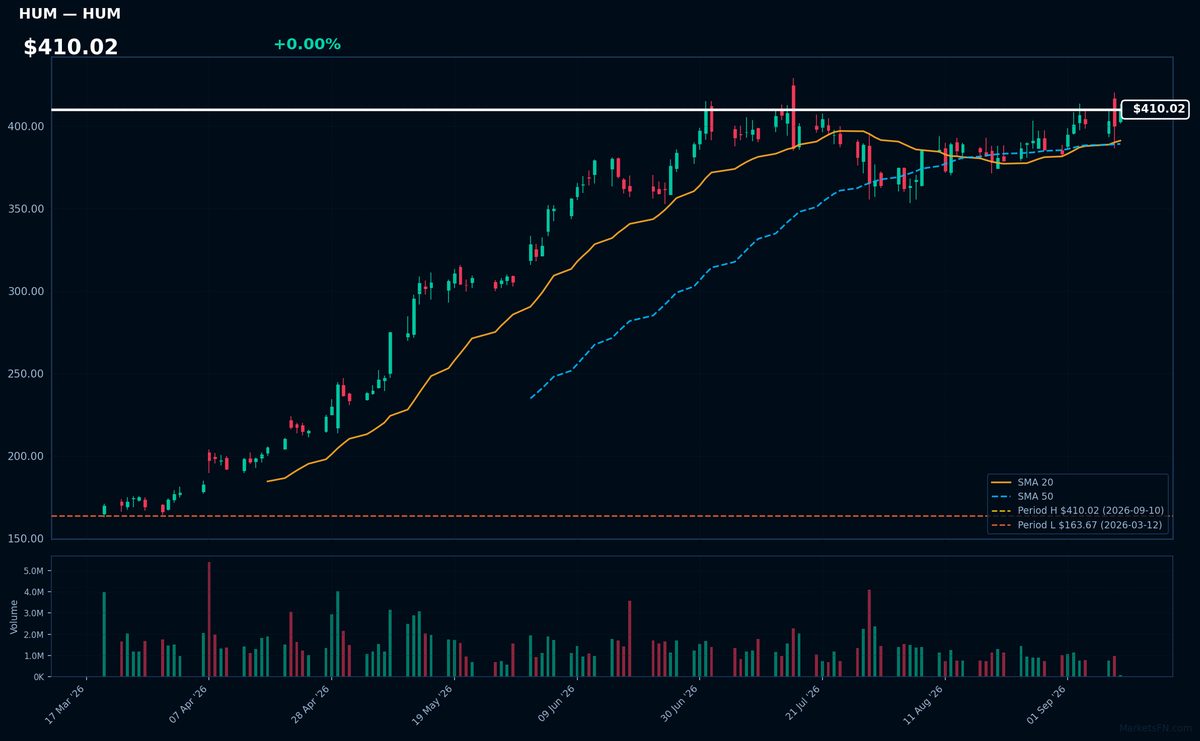
HUM | Humana Inc | Healthcare | Price Last: $410.02 | % Realized: +49.87% | RSI: 63.1 | % above MA200: +45.2% | Trend: Above MA20, MA50, MA200
Humana Inc is a health insurance company providing Medicare Advantage, Medicaid, and commercial plans. Investors should care about its growth in Medicare Advantage enrollment and potential impact on profitability due to changing healthcare regulations and reimbursement rates.
Humana Inc's RSI(14) is 63.1, indicating rising momentum. The stock is in a sustained uptrend with price > MA20 > MA50 > MA200. It's 0.0% below its 52-Week high, near a potential breakout, with a 49.9% 52-Week return, signaling strong technical strength.
Related headlines
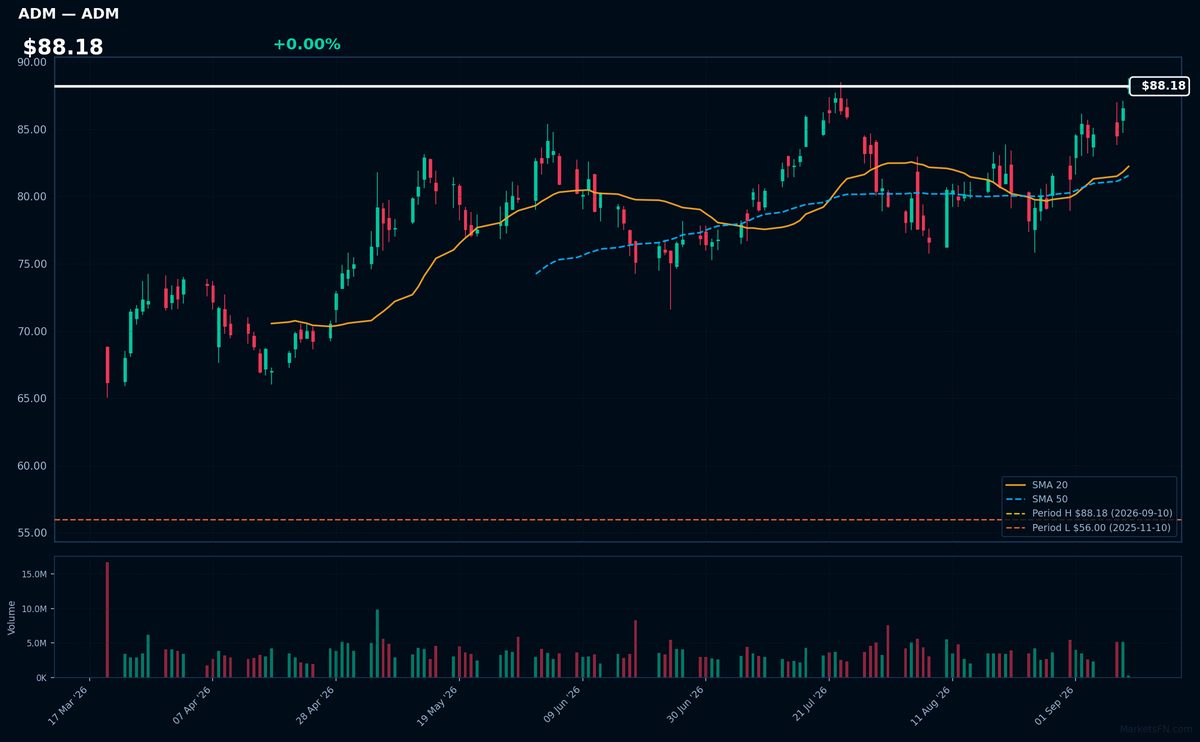
ADM | Archer Daniels Midland Co | Consumer Defensive | Price Last: $88.18 | % Realized: +43.60% | RSI: 68.0 | % above MA200: +21.6% | Trend: Above MA20, MA50, MA200
Archer Daniels Midland Co (ADM) is a global food processing and commodities trading company. Investors should care because it plays a crucial role in the agricultural supply chain, processing crops like corn, soybeans, and wheat into products used in food, animal feed, and biofuels.
ADM's current technical situation indicates strong momentum: RSI(14) is 68.0, and the stock is in a sustained uptrend with price > MA20 > MA50 > MA200. It's 0.0% below its 52-Week high, near a potential breakout, having risen 43.6% over the 52-Week period.
Related headlines
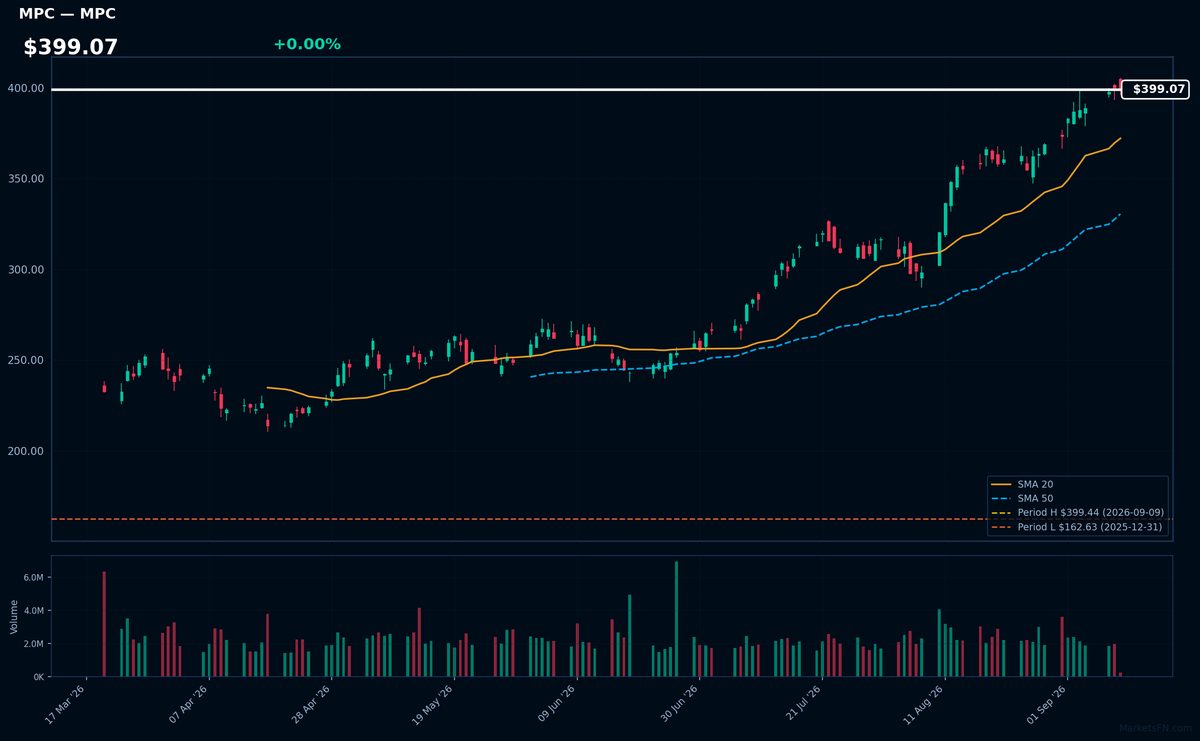
MPC | Marathon Petroleum Corp | Energy | Price Last: $399.08 | % Realized: +119.65% | RSI: 80.4 | % above MA200: +63.1% | Trend: Above MA20, MA50, MA200
Marathon Petroleum Corp (MPC) operates as a refining, marketing, and transportation company, generating revenue primarily through refining and distributing petroleum products. Investors care due to its exposure to energy market fluctuations and refining margins.
MPC's RSI(14) is 80.4, indicating overbought conditions. The MA alignment is bullish with price > MA20 > MA50 > MA200, and the stock is 0.1% below its 52-Week high, suggesting potential breakout momentum.
Related headlines
- Bull of the Day: Marathon Petroleum (MPC)
- Marathon Petroleum Named a Top 100 Internship Program for the Third Consecutive Year
- PSX, MPC Reportedly Weighed A Giant Merger What Sank The $180B Deal Between Phillips 66 And Marathon Petroleum
- MPC, PSX Stocks Hit All-Time Highs Whats Driving The Rally In These Energy Stocks?
📉 Nearest to 52-Week Low
Sectors represented: Consumer Cyclical (4), Healthcare (1)
| Ticker | Company | Sector | Price Last | % Realized | 52-Week Low Date | RSI | % above MA200 | Trend |
|---|---|---|---|---|---|---|---|---|
| TJX | TJX Companies, Inc | Consumer Cyclical | $125.92 | -9.97% | 2026-09-10 | 16.8 | -18.5% | Below MA20, MA50, MA200 |
| SYK | Stryker Corp | Healthcare | $274.01 | -28.45% | 2026-09-10 | 24.0 | -18.7% | Below MA20, MA50, MA200 |
| LOW | Lowe's Cos., Inc | Consumer Cyclical | $195.43 | -26.68% | 2026-09-10 | 32.4 | -17.1% | Below MA20, MA50, MA200 |
| NKE | Nike, Inc | Consumer Cyclical | $36.92 | -50.28% | 2026-09-10 | 33.8 | -27.7% | Below MA20, MA50, MA200 |
| AZO | Autozone Inc | Consumer Cyclical | $2900.93 | -31.79% | 2026-09-10 | 39.9 | -13.9% | Below MA20, MA50, MA200 |
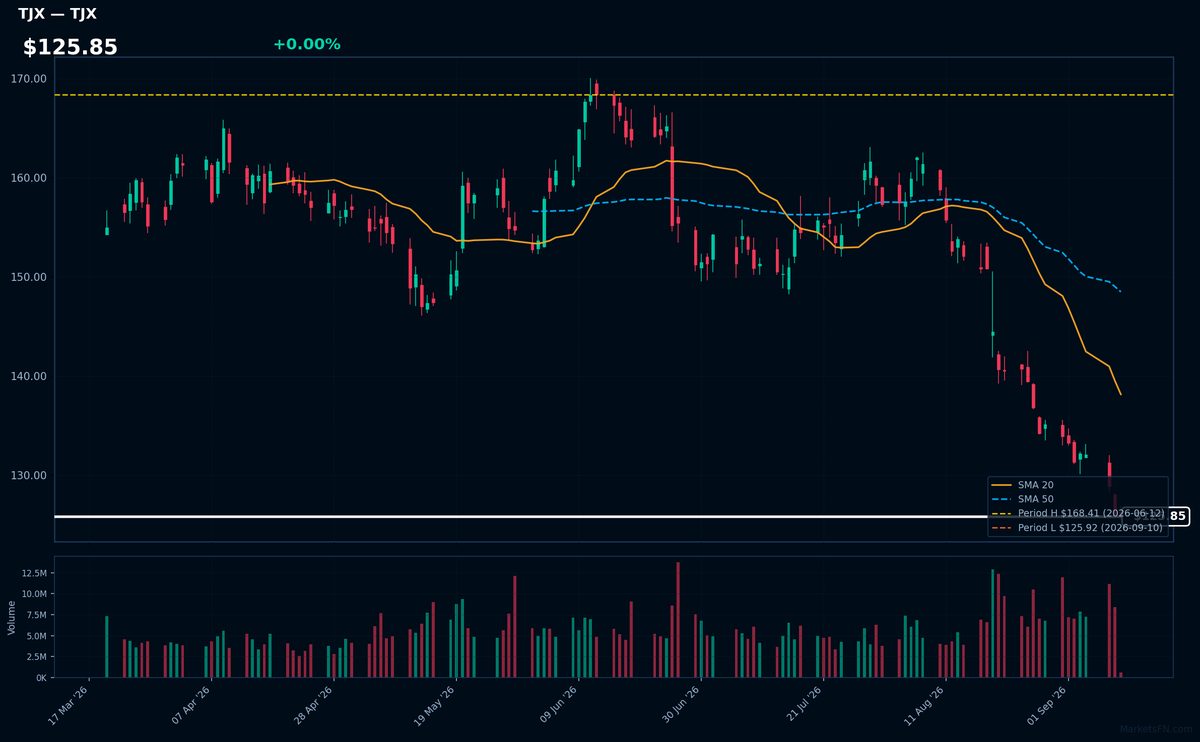
TJX | TJX Companies, Inc | Consumer Cyclical | Price Last: $125.92 | % Realized: -9.97% | RSI: 16.8 | % above MA200: -18.5% | Trend: Below MA20, MA50, MA200
TJX Companies, Inc operates off-price retail stores, offering brand-name merchandise at discounted prices. Investors should care about its ability to maintain margins and sales growth amidst competitive pressures, influencing its stock performance.
TJX is in a sustained downtrend with price ($125.85) below MA20, MA50, and MA200. The RSI(14) is 16.8, near oversold territory, and the stock is at its 52-Week low, indicating potential support testing, a warning sign for investors.
Related headlines
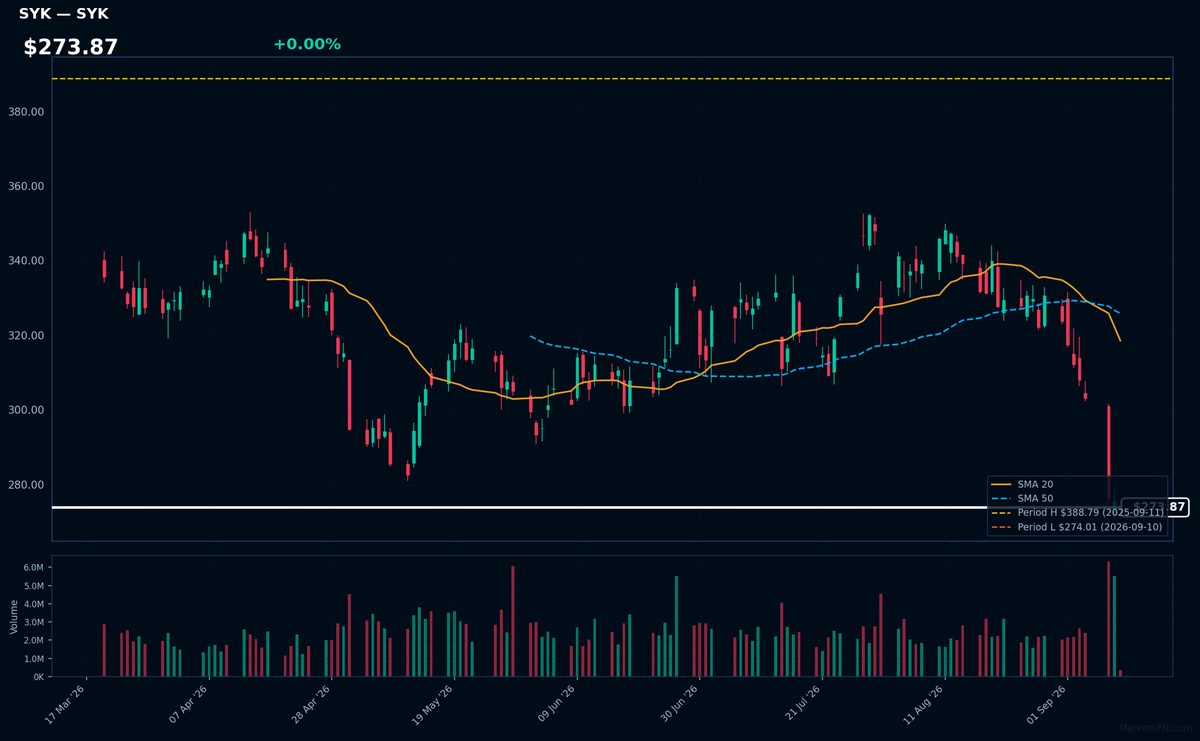
SYK | Stryker Corp | Healthcare | Price Last: $274.01 | % Realized: -28.45% | RSI: 24.0 | % above MA200: -18.7% | Trend: Below MA20, MA50, MA200
Stryker Corp is a medical technology company that designs, manufactures, and markets orthopedic implants, surgical equipment, and neurotechnology products. Investors care about its innovation in surgical robotics and market share in orthopedics.
Stryker Corp's technicals indicate a warning sign with RSI(14) at 24.0, suggesting oversold conditions, and a bearish MA alignment (price < MA20 < MA50 < MA200), indicating a sustained downtrend, with the stock at 0.0% above its 52-Week low.
Related headlines
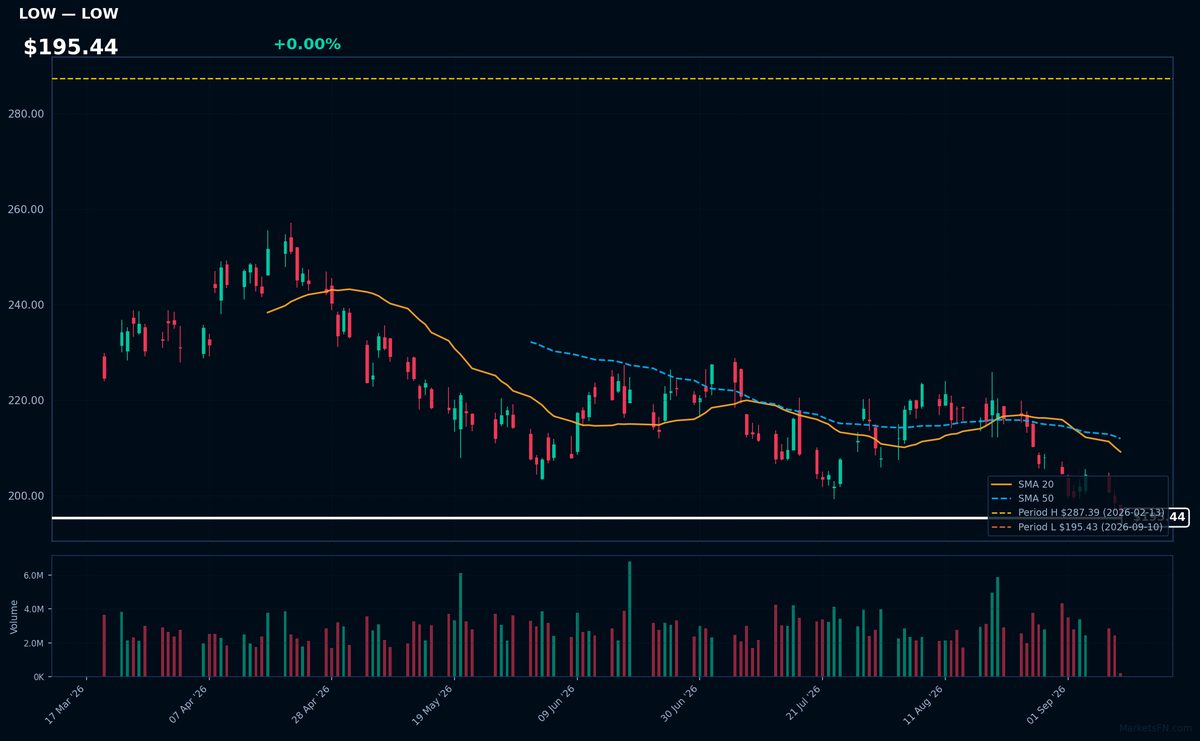
LOW | Lowe's Cos., Inc | Consumer Cyclical | Price Last: $195.43 | % Realized: -26.68% | RSI: 32.4 | % above MA200: -17.1% | Trend: Below MA20, MA50, MA200
Lowe's Cos., Inc is a home improvement retailer selling products for construction, renovation, and maintenance. Investors care about its performance as it reflects housing market trends and consumer spending habits.
Lowe's is testing major support with a price 0.0% above its 52-Week low. The RSI(14) is 32.4, indicating oversold conditions. Bearish MA alignment (price < MA20 < MA50 < MA200) suggests a sustained downtrend, potentially a warning sign.
Related headlines
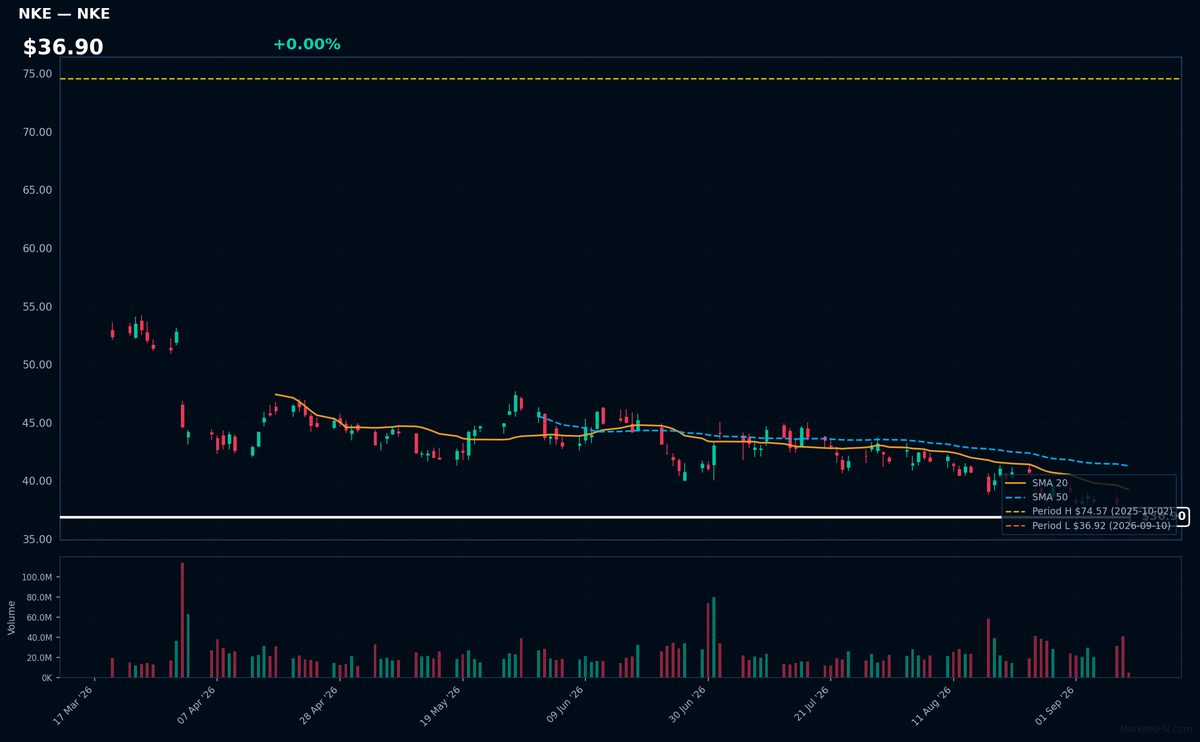
NKE | Nike, Inc | Consumer Cyclical | Price Last: $36.92 | % Realized: -50.28% | RSI: 33.8 | % above MA200: -27.7% | Trend: Below MA20, MA50, MA200
Nike, Inc designs and sells athletic footwear, apparel, and equipment. Investors should care about its brand strength, product innovation, and global distribution network, which drive revenue growth and profitability.
Nike's technical situation is bearish, with RSI(14) at 33.8, indicating oversold conditions, and a sustained downtrend as price ($36.90) remains below MA20, MA50, and MA200, with the stock testing its 52-Week low.
Related headlines
- Nike memo reassures executives it remains in S&P 500
- NKE Stock Is Down Over 40% This Year Morgan Stanley Says The Pain May Not Be Over Yet
- Nike loses its spot in the S&P 100 after an 18-year streak as shares crater nearly 80% from their peak
- Shifting Consumer Preferences Continue to Impact NKE and LULU
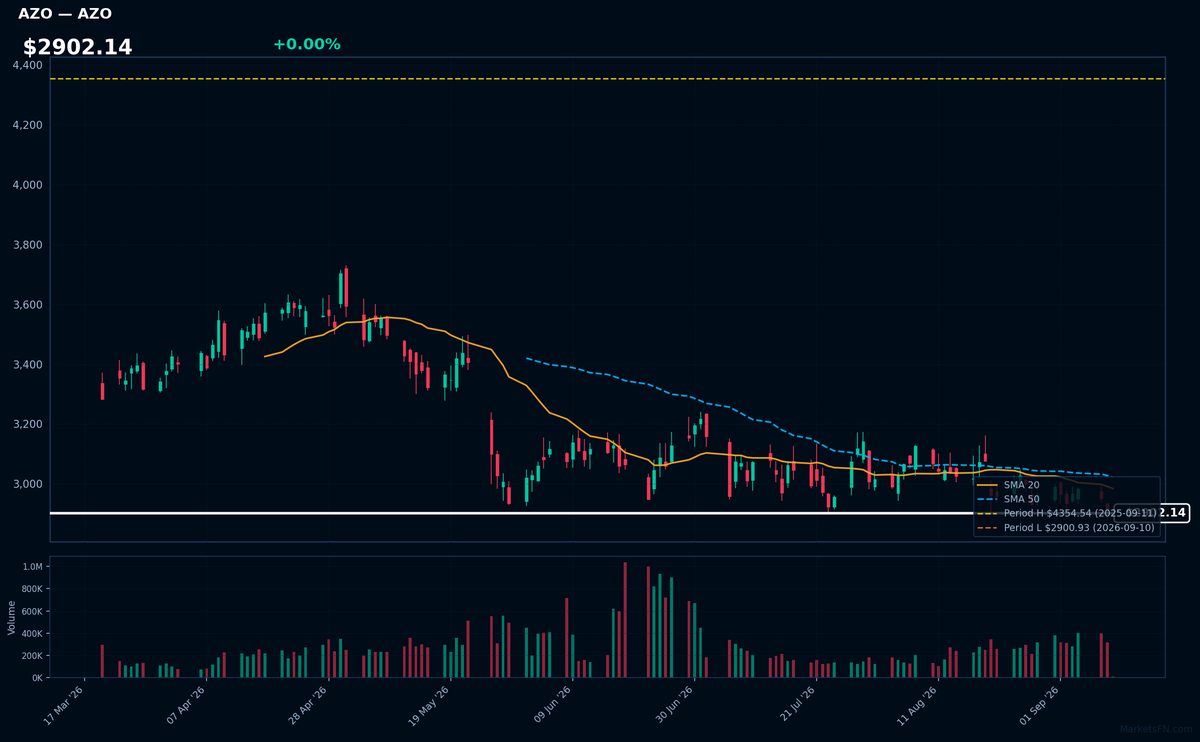
AZO | Autozone Inc | Consumer Cyclical | Price Last: $2900.93 | % Realized: -31.79% | RSI: 39.9 | % above MA200: -13.9% | Trend: Below MA20, MA50, MA200
Autozone Inc (AZO) is an auto parts retailer offering a wide range of products including batteries, brakes, and replacement parts. Investors should care because its performance reflects consumer spending on vehicle maintenance and repair, indicating overall automotive industry health.
AZO's technicals indicate a sustained downtrend with price ($2902.14) below MA20, MA50, and MA200. The RSI(14) at 39.9 suggests bearish momentum. Testing major support at its 52-Week low, a -31.8% 52-Week return reinforces the negative trend, potentially warning of further decline.
Related headlines
Market Commentary
The S&P 500 stocks listed are currently trading near their 52-week extremes, with some at highs and others at lows. Stocks like PSX, EA, HUM, and ADM are at their 52-week highs, while TJX, SYK, LOW, NKE, and AZO are at their 52-week lows. This indicates significant price movements, potentially driven by fundamental factors or market sentiment.
The stocks near 52-week highs are primarily from the energy and consumer staples sectors, with Phillips 66 and Marathon Petroleum Corp indicating strength in energy. In contrast, the stocks near 52-week lows are from consumer discretionary and industrials, with TJX, LOW, and SYK representing retail and healthcare equipment. This sector rotation may be driven by macroeconomic themes such as energy price movements and consumer spending patterns.
Key levels to watch include the current prices of these stocks, as they are at critical support or resistance levels. Potential catalysts for further price movements could include earnings reports, industry trends, and broader macroeconomic shifts. Investors should monitor these stocks closely for signs of breakout or reversal.
Methodology: All 503 S&P 500 constituents screened. 52-week high = highest daily close over the past 252 trading days (approx. 1 year). 52-week low = lowest daily close over the same period. Distance = (current price / extreme − 1) × 100. Technical indicators computed on up to 1 year of daily OHLCV data.
Disclaimer: For informational purposes only. Not investment advice. Past performance is not indicative of future results.


