S&P 500 52-Week Highs & Lows Radar: Revvity (RVTY), Home Depot, (HD) and more
MarketsFN Team

S&P 500 52-Week Highs & Lows Radar: Revvity (RVTY), Home Depot, (HD) and more
Screening all 503 S&P 500 constituents for stocks nearest to their 52-week high and their 52-week low. Data as of September 29, 2026. % Realized = 52-week total return.
Legend: RSI > 70 = overbought · RSI < 30 = oversold · Green % Realized = positive 52W return · Red = negative.
📈 Nearest to 52-Week High
Sectors represented: Healthcare (4), Communication Services (1)
| Ticker | Company | Sector | Price Last | % Realized | 52-Week High Date | RSI | % above MA200 | Trend |
|---|---|---|---|---|---|---|---|---|
| RVTY | Revvity Inc | Healthcare | $151.14 | +79.50% | 2026-09-29 | 73.7 | +43.3% | Above MA20, MA50, MA200 |
| MRNA | Moderna Inc | Healthcare | $200.22 | +690.45% | 2026-09-29 | 75.6 | +203.5% | Above MA20, MA50, MA200 |
| ABBV | Abbvie Inc | Healthcare | $266.20 | +19.29% | 2026-09-28 | 61.1 | +15.2% | Above MA20, MA50, MA200 |
| VTRS | Viatris Inc | Healthcare | $18.25 | +89.66% | 2026-09-28 | 72.5 | +19.8% | Above MA20, MA50, MA200 |
| WBD | Warner Bros. Discovery Inc | Communication Services | $30.85 | +63.60% | 2026-09-28 | 74.8 | +11.6% | Above MA20, MA50, MA200 |
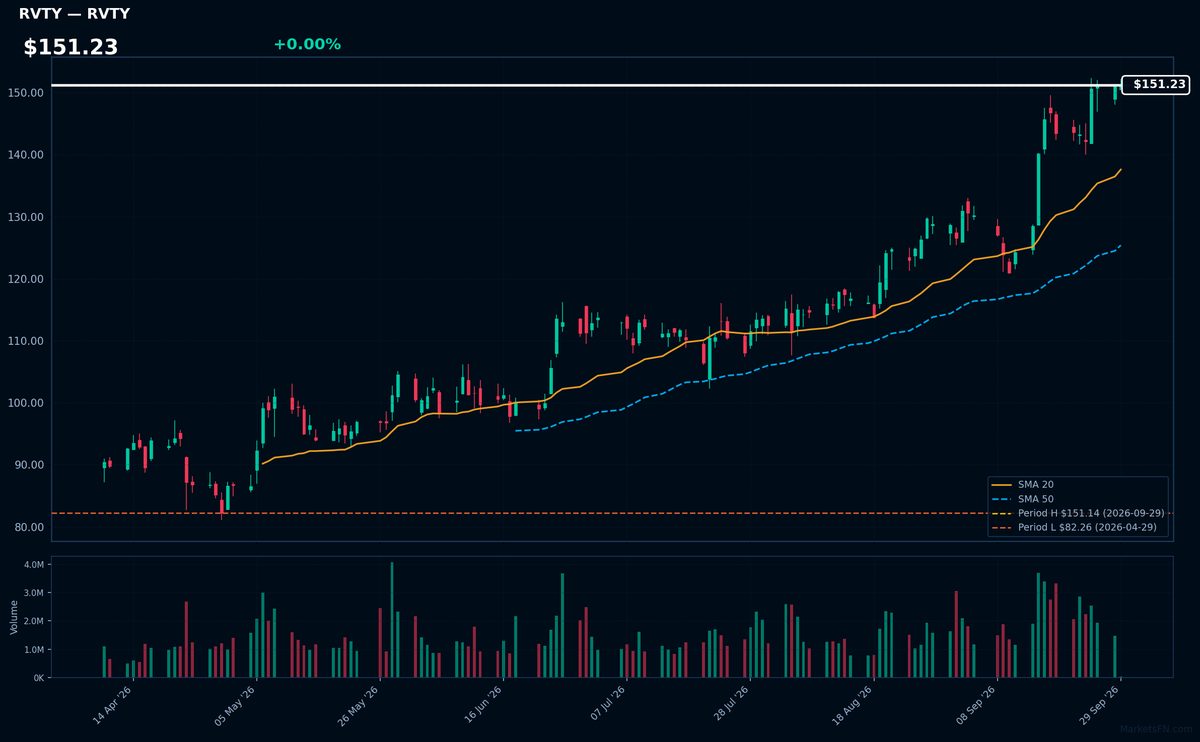
RVTY | Revvity Inc | Healthcare | Price Last: $151.14 | % Realized: +79.50% | RSI: 73.7 | % above MA200: +43.3% | Trend: Above MA20, MA50, MA200
Revvity Inc provides scientific instruments and services for life sciences, diagnostics, and applied markets, enabling discovery and analysis in various fields; investors should care as its tools are crucial for advancing research and development in pharmaceuticals, academia, and healthcare.
Revvity Inc is in a sustained uptrend with price > MA20 > MA50 > MA200, RSI(14) at 73.7, near its 52-Week high. This indicates strong momentum, potentially overbought given the high RSI, with the stock 0.0% below its 52-Week high, suggesting a potential breakout level.
Related headlines
- Revvity Inc. stock outperforms competitors on strong trading day
- Revvity Launches IVDR-Certified Solution for Early Detection of Type 1 Diabetes
- Revvity Inc. stock outperforms competitors on strong trading day
- Revvity to Acquire Human Cell Design to Advance Human-Relevant Cell Models for Metabolic Disease Drug Discovery
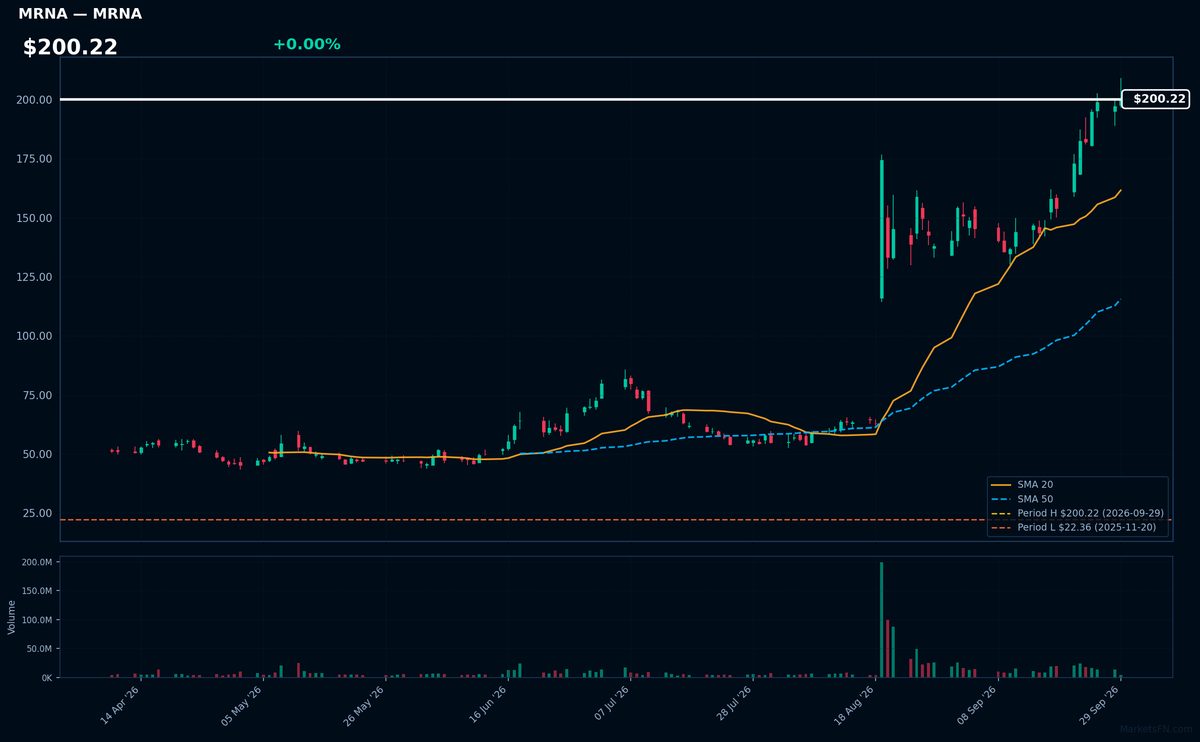
MRNA | Moderna Inc | Healthcare | Price Last: $200.22 | % Realized: +690.45% | RSI: 75.6 | % above MA200: +203.5% | Trend: Above MA20, MA50, MA200
Moderna Inc (MRNA) is a biotechnology company that develops and commercializes mRNA-based therapeutics and vaccines. Investors should care due to its innovative pipeline and potential for significant growth driven by its COVID-19 vaccine and other developmental assets.
MRNA is in a sustained uptrend with a bullish MA alignment: price ($200.22) > MA20 > MA50 > MA200. The RSI(14) is 75.6, indicating strong momentum, and is 0.0% below its 52-Week high, suggesting a potential breakout.
Related headlines
- MRNA Stock Eyes Best Year Ever: Analyst Calls Chinas AI Drug Lead Baseless As Moderna Awaits Cancer Data
- Why Did AMD, HPE, MRNA Stocks Surge To 52-Week Highs Last Week?
- MRNA, PGEN Stocks Hit Multi-Year Highs Whats Driving The Momentum Today?
- Moderna Stock Jumped 7% Thursday. The Real Test Comes at ESMO on October 24.
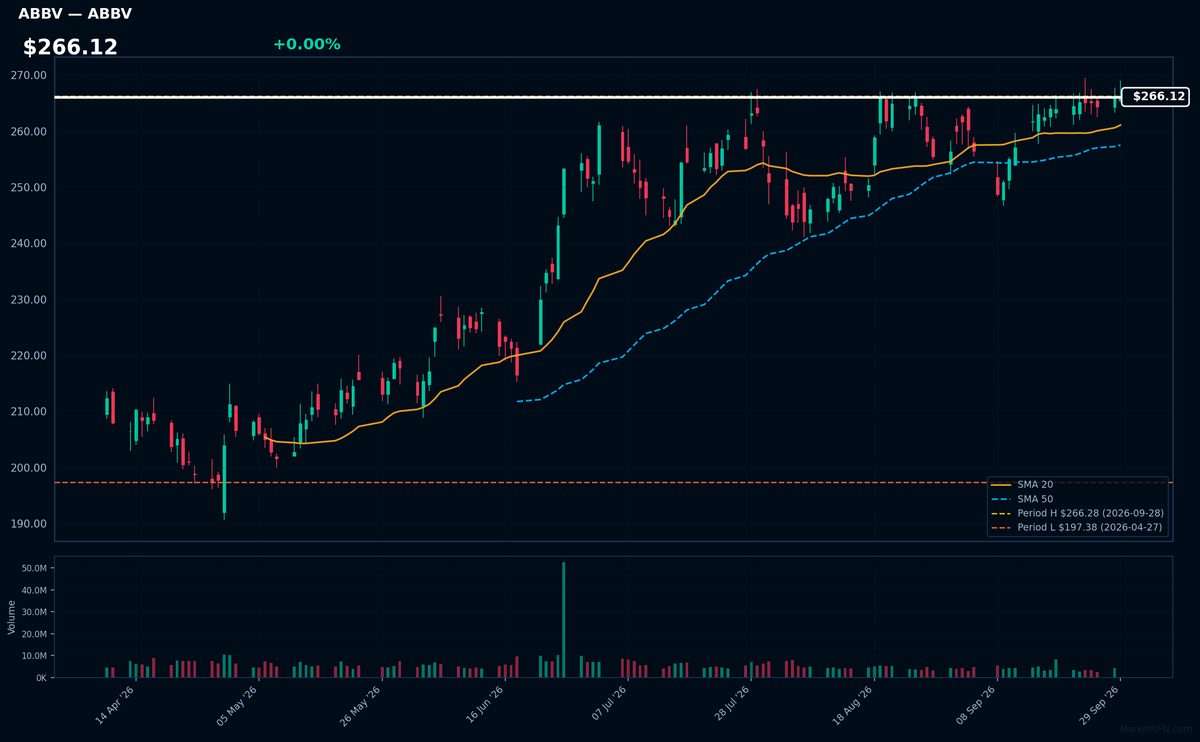
ABBV | Abbvie Inc | Healthcare | Price Last: $266.20 | % Realized: +19.29% | RSI: 61.1 | % above MA200: +15.2% | Trend: Above MA20, MA50, MA200
Abbvie Inc is a biopharmaceutical company that develops and markets therapies for chronic diseases like rheumatoid arthritis and hepatitis C. Investors care about its pipeline and sales of key products like Humira, a top-selling arthritis treatment.
Abbvie Inc is in a sustained uptrend with price ($266.12) above MA20 > MA50 > MA200. RSI(14) is 61.1, near its 52-Week high with 0.0% downside, indicating strong momentum. The 52-Week return is 19.3%, further supporting the bullish trend.
Related headlines
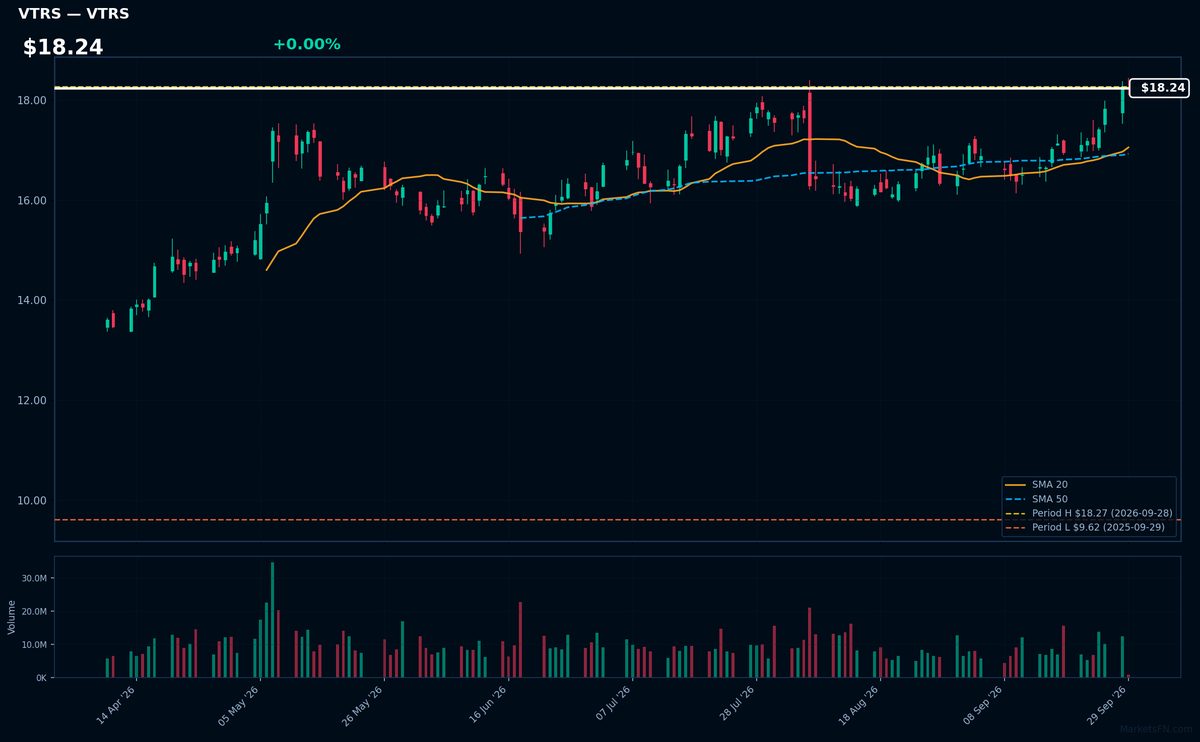
VTRS | Viatris Inc | Healthcare | Price Last: $18.25 | % Realized: +89.66% | RSI: 72.5 | % above MA200: +19.8% | Trend: Above MA20, MA50, MA200
Viatris Inc is a global healthcare company formed by the merger of Mylan and Upjohn, operating in the pharmaceuticals sector. Investors should care due to its diversified portfolio of generic and brand-name drugs, potentially offering stable cash flows.
Viatris Inc's RSI(14) is 72.5, nearing overbought territory. The MA alignment is bullish with price > MA20 > MA50 > MA200. The stock is 0.1% below its 52-Week high, indicating potential breakout momentum, supported by an 89.7% 52-Week return.
Related headlines
- Viatris sues Novo Nordisk over generic Wegovy patent dispute
- Viatris Announces Approval of WAKIX (Pitolisant) in Japan, a First-in-Class Treatment for Narcolepsy and Excessive Daytime Sleepiness Associated With Obstructive Sleep Apnea Syndrome
- Cavendish reiterates 'buy' rating on Shield Therapeutics after US deal with Viatris
- Viatris Inc (VTRS) (Q2 2026) Earnings Call Highlights: Strong Growth and Raised Guidance Amid ...
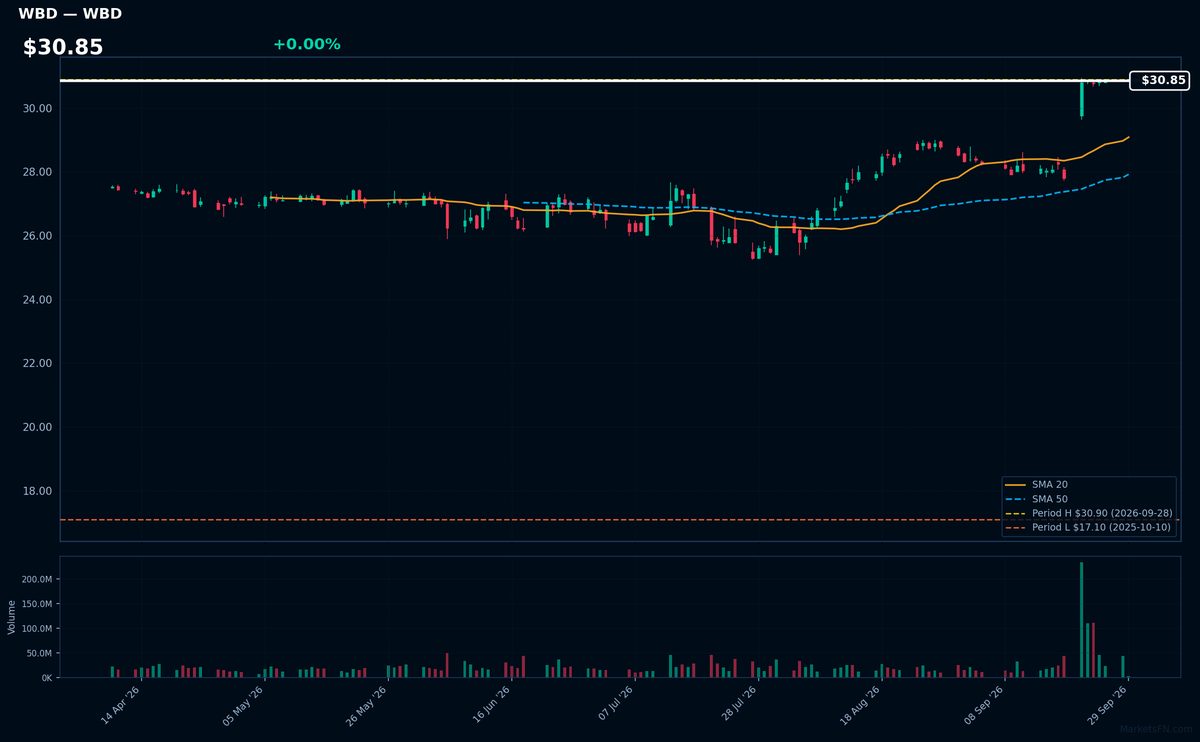
WBD | Warner Bros. Discovery Inc | Communication Services | Price Last: $30.85 | % Realized: +63.60% | RSI: 74.8 | % above MA200: +11.6% | Trend: Above MA20, MA50, MA200
Warner Bros. Discovery Inc is a media conglomerate with a diverse portfolio of entertainment and news assets, including HBO, Warner Bros., and Discovery Channel, making it a significant player in content creation and distribution, which is crucial for investors due to its influence on the global media landscape.
Warner Bros. Discovery Inc is near a potential breakout, with a price of $30.85, just 0.1% below its 52-Week high, and an RSI(14) of 74.8, indicating strong momentum; the MA alignment (price > MA20 > MA50 > MA200) confirms a sustained uptrend, suggesting continued bullishness.
Related headlines
📉 Nearest to 52-Week Low
Sectors represented: Consumer Cyclical (2), Consumer Defensive (1), Communication Services (1), Real Estate (1)
| Ticker | Company | Sector | Price Last | % Realized | 52-Week Low Date | RSI | % above MA200 | Trend |
|---|---|---|---|---|---|---|---|---|
| HD | Home Depot, Inc | Consumer Cyclical | $289.83 | -28.75% | 2026-09-29 | 29.1 | -14.8% | Below MA20, MA50, MA200 |
| PEP | PepsiCo Inc | Consumer Defensive | $127.64 | -8.94% | 2026-09-29 | 27.0 | -13.5% | Below MA20, MA50, MA200 |
| LOW | Lowe's Cos., Inc | Consumer Cyclical | $187.57 | -25.96% | 2026-09-29 | 31.5 | -19.4% | Below MA20, MA50, MA200 |
| CMCSA | Comcast Corp | Communication Services | $21.73 | -26.37% | 2026-09-29 | 26.5 | -18.8% | Below MA20, MA50, MA200 |
| O | Realty Income Corp | Real Estate | $55.32 | -8.64% | 2026-09-29 | 16.5 | -10.6% | Below MA20, MA50, MA200 |
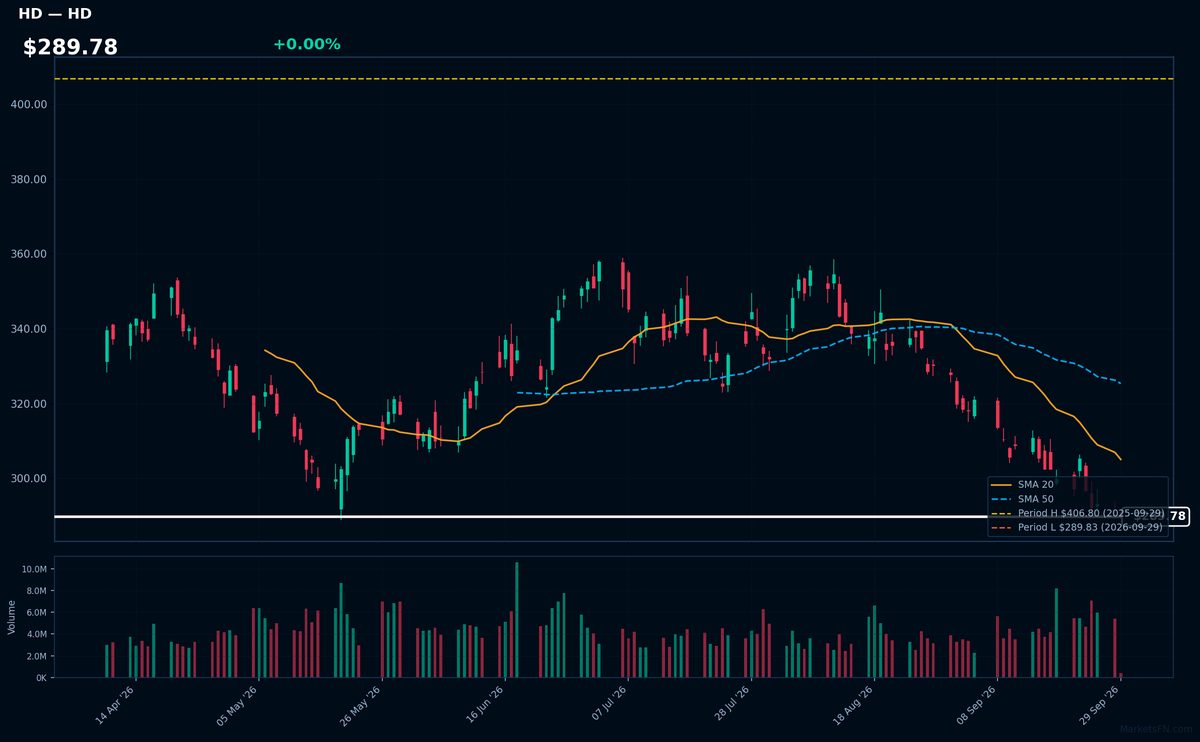
HD | Home Depot, Inc | Consumer Cyclical | Price Last: $289.83 | % Realized: -28.75% | RSI: 29.1 | % above MA200: -14.8% | Trend: Below MA20, MA50, MA200
Home Depot, Inc is a home improvement retailer selling building materials, tools, and gardening supplies. Investors care about its performance as it reflects housing market trends and consumer spending on home renovations.
Home Depot's technicals indicate a warning sign with RSI(14) at 29.1, suggesting oversold conditions, and a bearish MA alignment: price ($289.78) < MA20 < MA50 < MA200, indicating a sustained downtrend, with the stock testing major support at its 52-Week low.
Related headlines
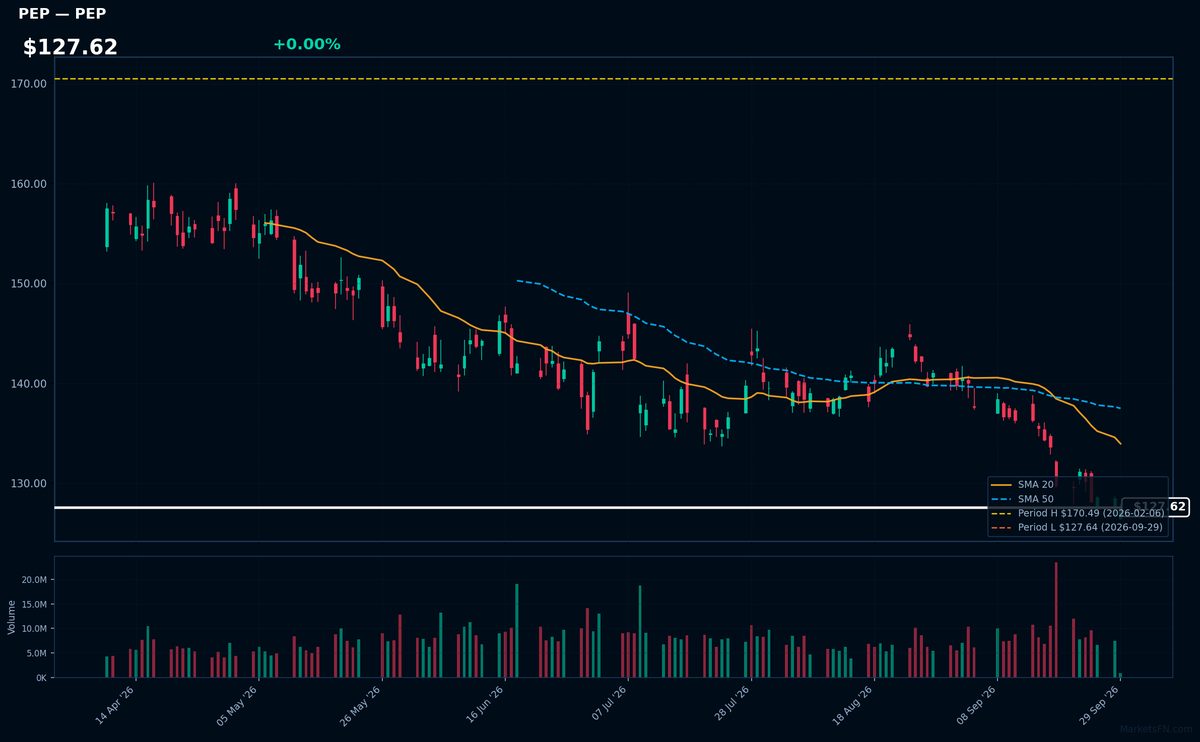
PEP | PepsiCo Inc | Consumer Defensive | Price Last: $127.64 | % Realized: -8.94% | RSI: 27.0 | % above MA200: -13.5% | Trend: Below MA20, MA50, MA200
PepsiCo Inc is a diversified food and beverage company with brands like Pepsi, Lay's, and Gatorade, generating revenue through beverage sales, snack foods, and other categories, making it a significant player in the consumer staples sector.
PepsiCo's current technical situation is bearish, with an RSI(14) of 27.0 indicating oversold conditions, and a sustained downtrend as price ($127.62) remains below MA20, MA50, and MA200, with the stock testing major support at its 52-Week low.
Related headlines
- PEP Stock Gets A Downgrade From JPMorgan Firm Flags Frito-Lay Weakness
- JPMorgan downgrades PepsiCo to Neutral in second cut of the week
- Why PepsiCo just got hit with a downgrade despite the stock trading at a 52-week low
- PepsiCo plans to raise prices on sodas, chips and dip - and that has Wall Street worried
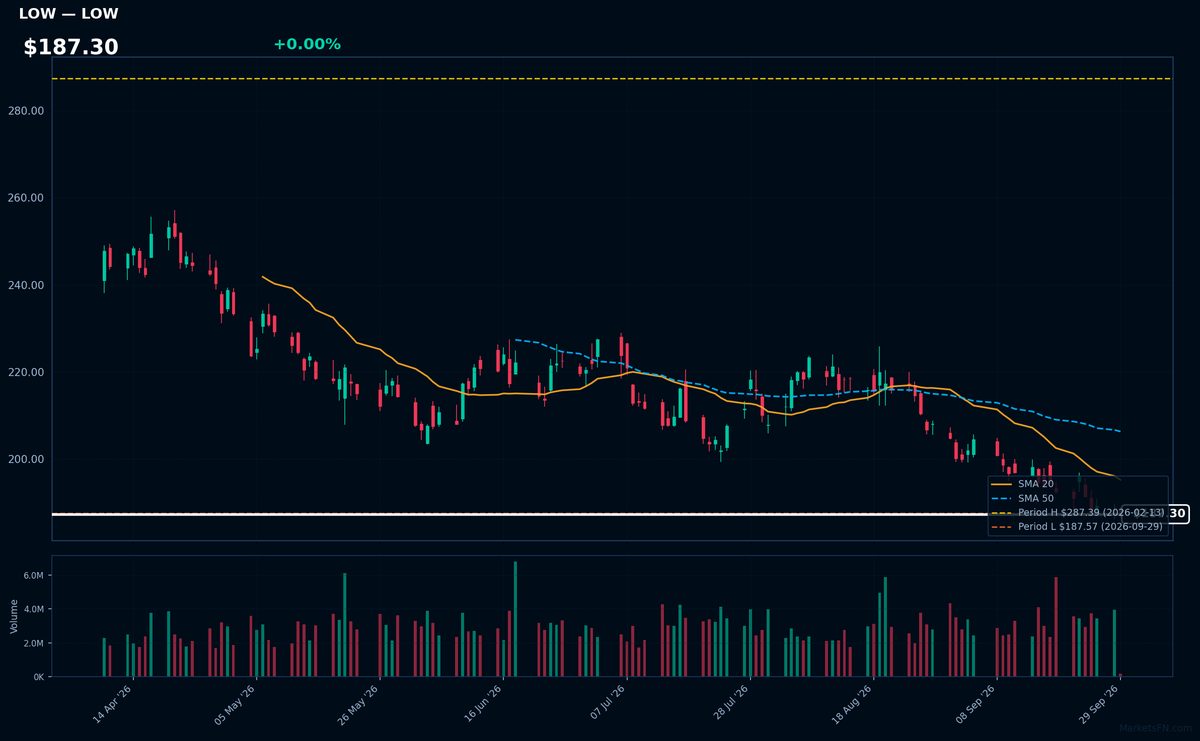
LOW | Lowe's Cos., Inc | Consumer Cyclical | Price Last: $187.57 | % Realized: -25.96% | RSI: 31.5 | % above MA200: -19.4% | Trend: Below MA20, MA50, MA200
Lowe's Cos., Inc is a home improvement retailer selling products for construction, renovation, and maintenance. Investors care due to its exposure to housing market trends and consumer spending on discretionary goods.
Lowe's is testing major support with a price 0.0% above its 52-Week low, RSI(14) at 31.5 indicating oversold conditions, and bearish MA alignment (price < MA20 < MA50 < MA200), suggesting a sustained downtrend and potential warning sign.
Related headlines
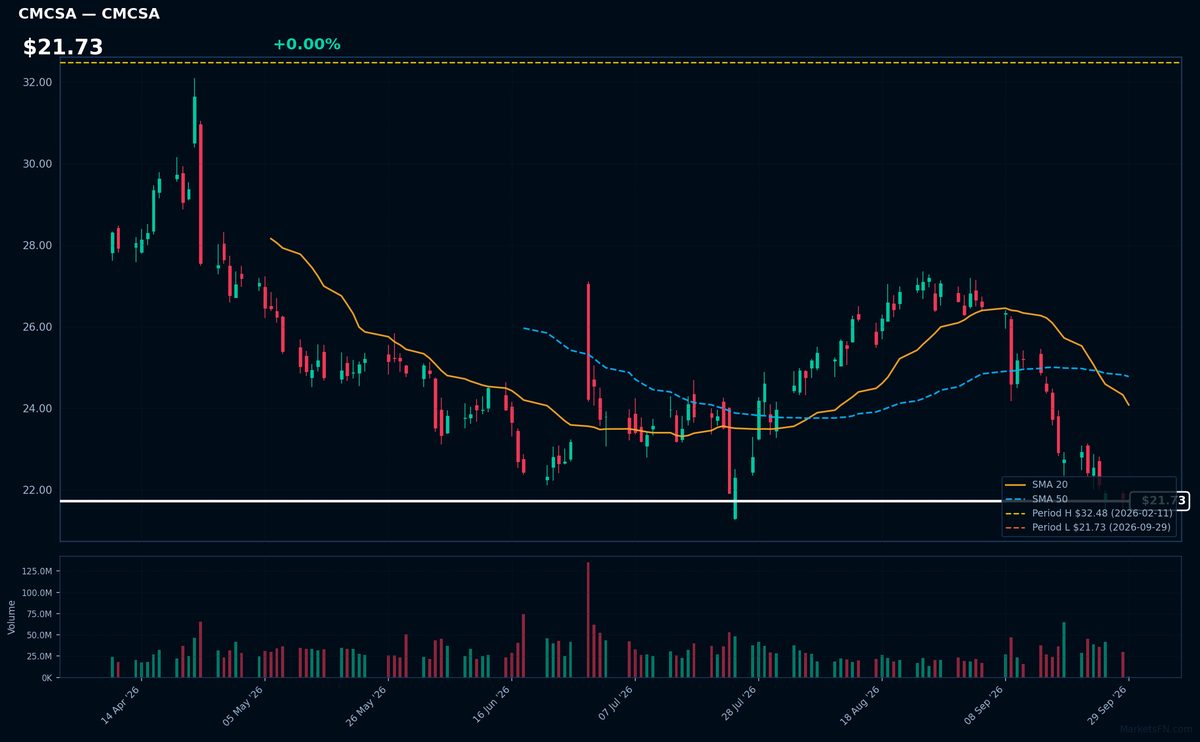
CMCSA | Comcast Corp | Communication Services | Price Last: $21.73 | % Realized: -26.37% | RSI: 26.5 | % above MA200: -18.8% | Trend: Below MA20, MA50, MA200
Comcast Corp is a media and telecommunications conglomerate providing cable television, internet, and phone services, as well as owning NBCUniversal, a major media company with film, television, and theme park assets, making it a significant player in both consumer connectivity and entertainment content.
Comcast Corp's current technical situation is bearish, with an RSI(14) of 26.5 indicating oversold conditions, and a bearish MA alignment (price < MA20 < MA50 < MA200), with the stock at its 52-Week low, suggesting a sustained downtrend and potential further downside.
Related headlines
- Comcast NBCUniversal Announces $2.5 Million in Unrestricted Grants to 80 Nonprofits
- TMUS, CMCSA Stock Price Targets Cut Barclays Warns Of Limited Upside Ahead Of Q3 Earnings
- Comcast and Fastly's New Content Delivery Model Powers Highest Quality Experience for Peacock's Biggest Live Events
- Xfinity and Comcast Business High-Speed Internet Now Available to More Than 2,300 Homes and Businesses in Clay County, Florida
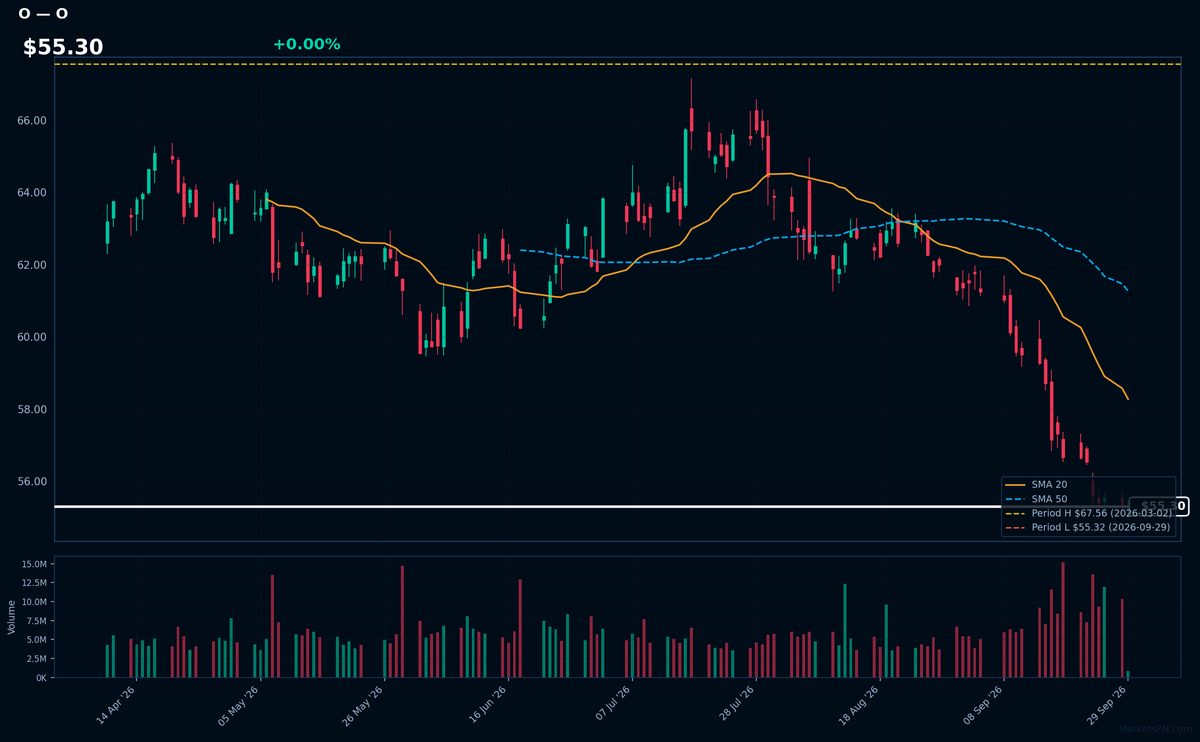
O | Realty Income Corp | Real Estate | Price Last: $55.32 | % Realized: -8.64% | RSI: 16.5 | % above MA200: -10.6% | Trend: Below MA20, MA50, MA200
Realty Income Corp is a real estate investment trust that owns and operates a portfolio of commercial properties, primarily retail spaces, leased to tenants under long-term agreements, providing a steady income stream to investors through monthly dividend payments.
Realty Income Corp's current technical situation is bearish, with an RSI(14) of 16.5 indicating oversold conditions, and a bearish MA alignment (price < MA20 < MA50 < MA200), with the stock at its 52-Week low, suggesting a sustained downtrend and potential further downside.
Related headlines
- Realty Income Stock Sits 18% Below Its 52-Week High After a Scotiabank Downgrade. Heres Where the Stock Could Go
- Realty Income Sells a 49% European Stake to KKR. Heres What It Means for the Dividend
- CoreWeave upgraded, Etsy downgraded: Wall Street's top analyst calls
- Realty Income and KKR Form 528M European JV
Market Commentary
The S&P 500 stocks listed are currently trading near their 52-week extremes, with some at highs and others at lows. Stocks like RVTY, MRNA, and ABBV are at their 52-week highs, while HD, PEP, and LOW are at their 52-week lows. This indicates a significant price movement, potentially driven by fundamental factors or market sentiment.
The stocks near 52-week highs are primarily from the healthcare and consumer staples sectors, with companies like Moderna Inc and Abbvie Inc leading the way. In contrast, the stocks near 52-week lows are from the consumer staples and real estate sectors, including Home Depot and Realty Income Corp. This sector rotation may be driven by macro themes such as changes in consumer behavior, regulatory developments, or economic trends.
Key levels to watch include the 52-week highs and lows for these stocks, as a break above or below these levels could signal further price movement. Potential catalysts include earnings reports, industry trends, and macroeconomic data releases. Investors should monitor these developments to gauge the sustainability of current price levels and identify potential opportunities or risks.
Methodology: All 503 S&P 500 constituents screened. 52-week high = highest daily close over the past 252 trading days (approx. 1 year). 52-week low = lowest daily close over the same period. Distance = (current price / extreme − 1) × 100. Technical indicators computed on up to 1 year of daily OHLCV data.
Disclaimer: For informational purposes only. Not investment advice. Past performance is not indicative of future results.