Solana, Ripple, and Dogecoin Lead Crypto Market Gains Today.
· Crypto · QuoteReporter
Solana, Ripple, and Dogecoin Lead Crypto Market Gains Today.
Crypto Market Report | July 02, 2026
📊 Crypto Market Overview
The cryptocurrency market is displaying a mixed sentiment as of today, with most major assets trading in positive territory. Bitcoin, the largest cryptocurrency by market capitalization, is trading at $60,258.6289, representing a modest gain of 0.42% over the past 24 hours. The Relative Strength Index (RSI) for Bitcoin stands at 39.0, indicating a neutral to slightly oversold condition, while the Moving Average Convergence Divergence (MACD) is negative at -2152.5533, suggesting a bearish trend.
Other major cryptocurrencies, such as Ethereum and Solana, are also trading in the green, with gains of 0.45% and 0.80%, respectively. Ethereum's RSI is 38.1, similar to Bitcoin's, indicating a neutral to slightly oversold condition, while Solana's RSI is significantly higher at 66.6, suggesting a relatively overbought condition. Ripple (XRP) is up 0.76% and has an RSI of 28.1, indicating an oversold condition.
The broader macro context remains relevant, with discussions around inflation and monetary policy continuing to influence the market. Recent news has highlighted the growing intersection of traditional finance and cryptocurrency, with developments such as Robinhood's partnership with dYdX Labs to launch a new decentralized exchange (DEX) and Tradeweb's execution of a real-time tokenized US Treasury transaction on the Canton Network.
Notable technical signals include Dogecoin's RSI of 13.9, indicating a deeply oversold condition, and Ripple's MACD of -0.0468, suggesting a potential for a bullish crossover. Overall, the market is characterized by a mix of positive and negative signals, with some assets indicating oversold conditions and others showing relative strength. The current market dynamics are influenced by a combination of macroeconomic factors and cryptocurrency-specific developments.
📰 Crypto News
- Robinhood links with dYdX Labs to launch new DEX Arcus
- Here’s what happened in crypto today
- France to strengthen response as crypto wrench attacks hit 77
- Analyst warns BTC could drop further after worst June since 2022
- Venice AI becomes unicorn after $65M Series A as AI privacy concerns grow
- Trumps’ American Bitcoin sinks 8.4% ahead of reverse stock split to stay listed
- Bitcoin tops $60K amid Fed inflation talks: Is bull trap or $65K next?
- Robinhood rolls out public blockchain, plans crypto trading for UK residents
- Tradeweb executes real-time tokenized US Treasury transaction on Canton Network
- XRP edges higher as whale activity rises while retail traders stay cautious
- Bitcoin's long-term holders have returned to accumulation
- FBI Director Kash Patel caught sleeping on required disclosure of six-figure MSTR investment: Report
- Ether, solana, dogecoin in the green after Warsh comments push bitcoin above $60,000
- Ethereum Institutional launch draws support from across the Ethereum ecosystem
- Robinhood Launches 'AI-Native' Ethereum Layer-2 Network, Tokenized Stock Trading
🔍 Technical Analysis
Bitcoin (BTC) — +0.42%
$60,258.63 52W: $57,747.77 — $116,273.31
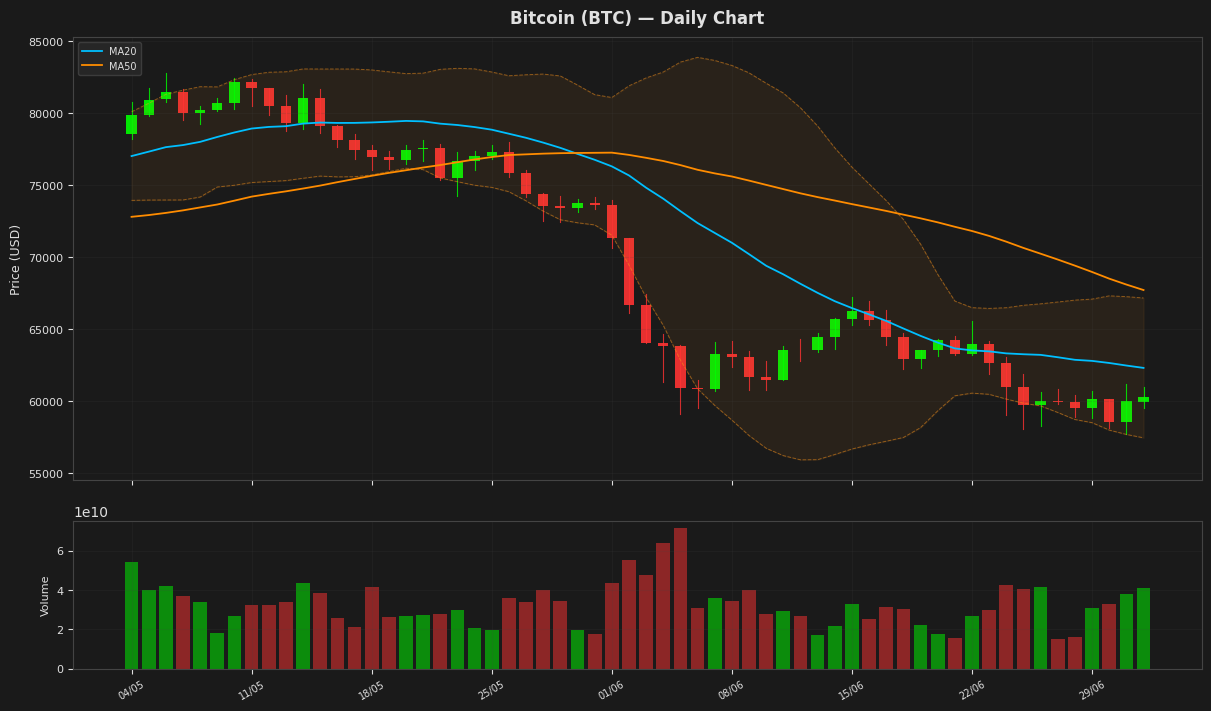
Bitcoin's price is currently at $60,258.63, showing a slight increase of 0.42% for the day, and is positioned below both its 20-day and 50-day moving averages, indicating a potential downtrend. The RSI is at 38.97, suggesting the asset is nearing oversold territory. The MACD is below its signal line, further indicating bearish momentum. The price is also near the lower end of the Bollinger Bands, with the lower band at $57,456.99.
Ethereum (ETH) — +0.45%
$1,616.22 52W: $1,506.51 — $4,250.67
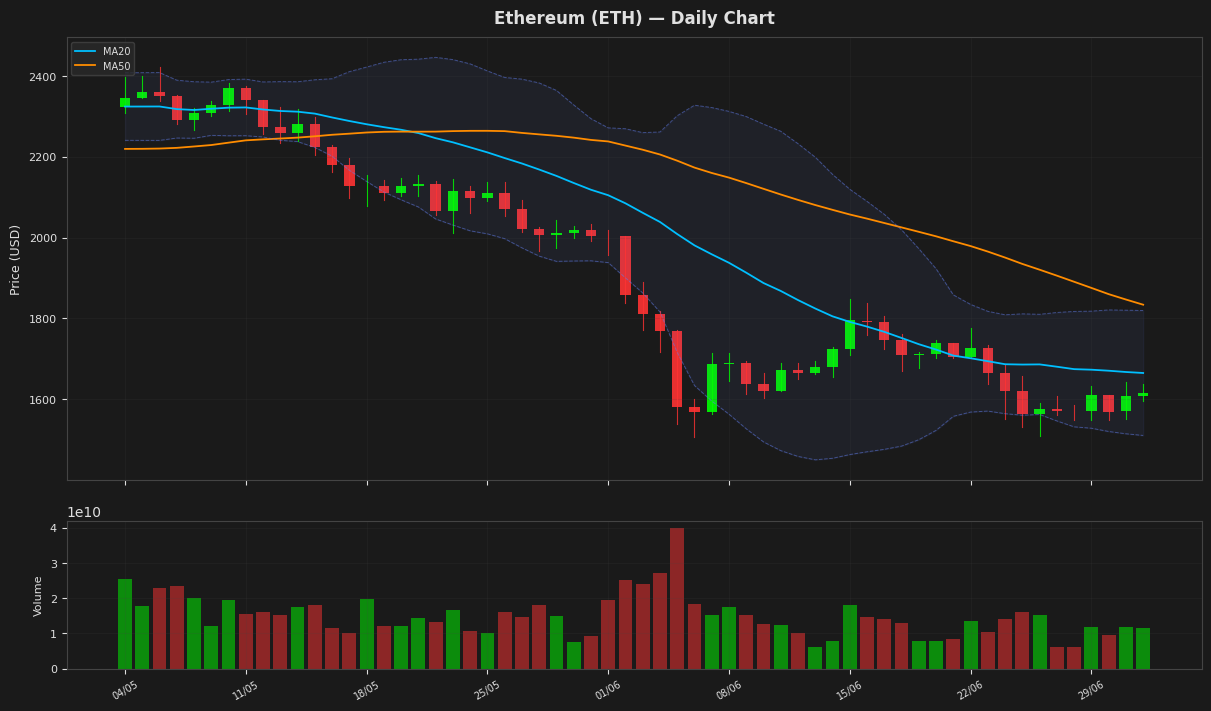
Ethereum's price is currently at $1,616, near the lower end of its recent trading range, with the RSI indicating oversold conditions. The MACD is below its signal line, suggesting a bearish trend, but the MACD's proximity to the signal line indicates a potential for a reversal. The price is also close to the lower Bollinger Band, which is at $1,510, a level that may provide support. The ATR suggests that volatility remains relatively high.
Ripple (XRP) — +0.76%
$1.0601 52W: $1.0098 — $2.6934
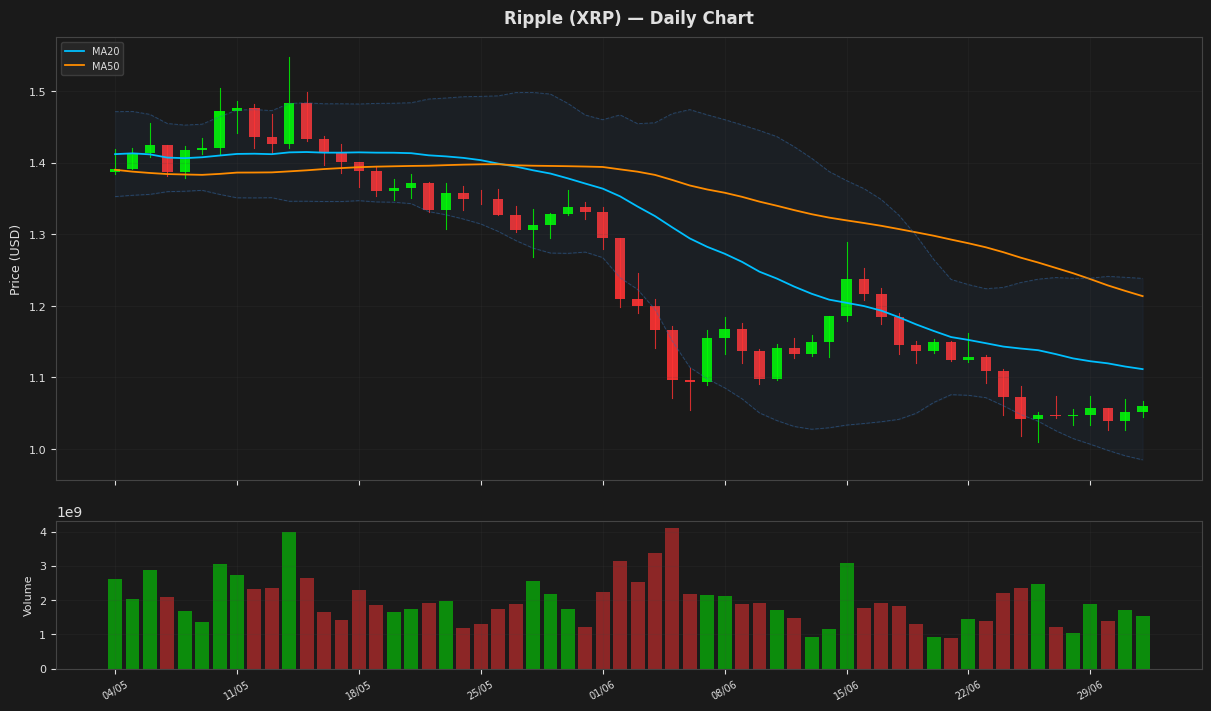
Ripple's price is currently at $1.060100, showing a slight increase of 0.76% for the day, and is positioned near the lower Bollinger Band at $0.98477, indicating potential oversold conditions. The RSI(14) value of 28.129757 further supports this, suggesting the asset may be undervalued. The MACD is slightly below its signal line, indicating a potential bearish trend. The price is still above its 52-week low of $1.009753.
Solana (SOL) — +0.80%
$78.0000 52W: $60.4147 — $205.0200
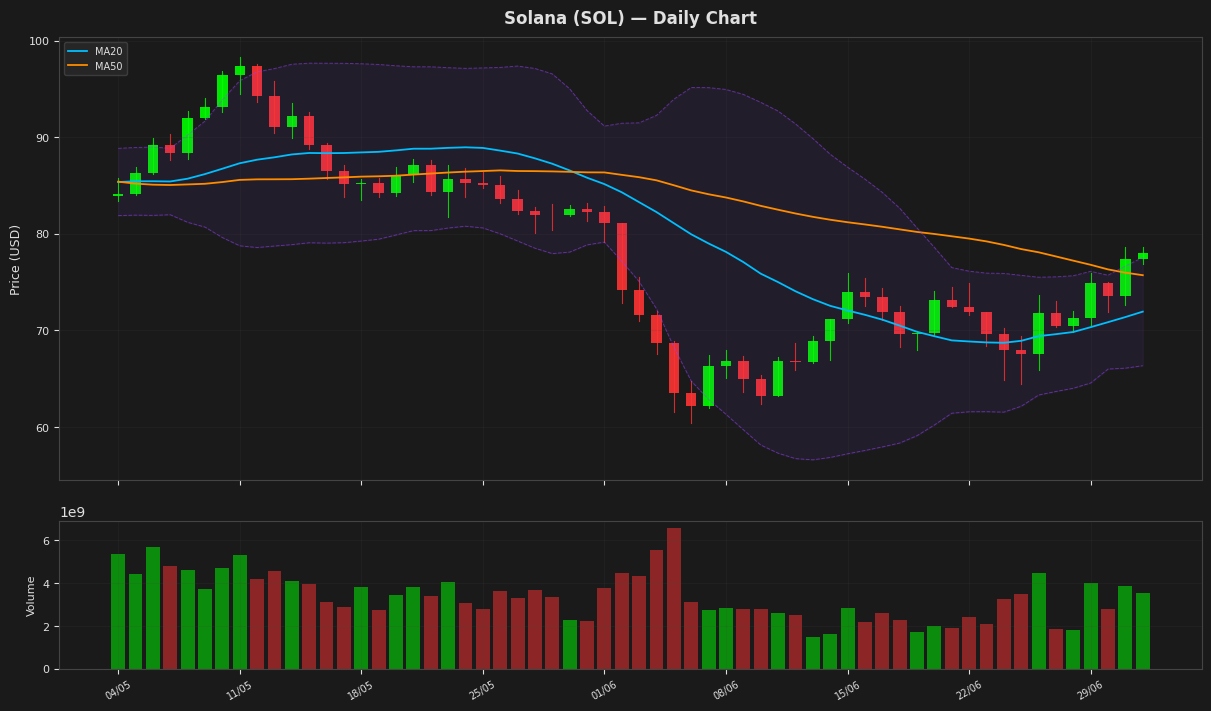
Solana's price is currently trading at $78, above its 20-day and 50-day moving averages of $71.94 and $75.71, respectively, indicating a positive trend. The RSI is at 66.57, suggesting the asset is nearing overbought territory but not yet there. The MACD is positive and above its signal line, confirming the bullish momentum. The Bollinger Bands indicate that the price is near the upper band, suggesting potential resistance at this level.
BNB (BNB) — -0.11%
$549.4800 52W: $538.5992 — $1,180.01
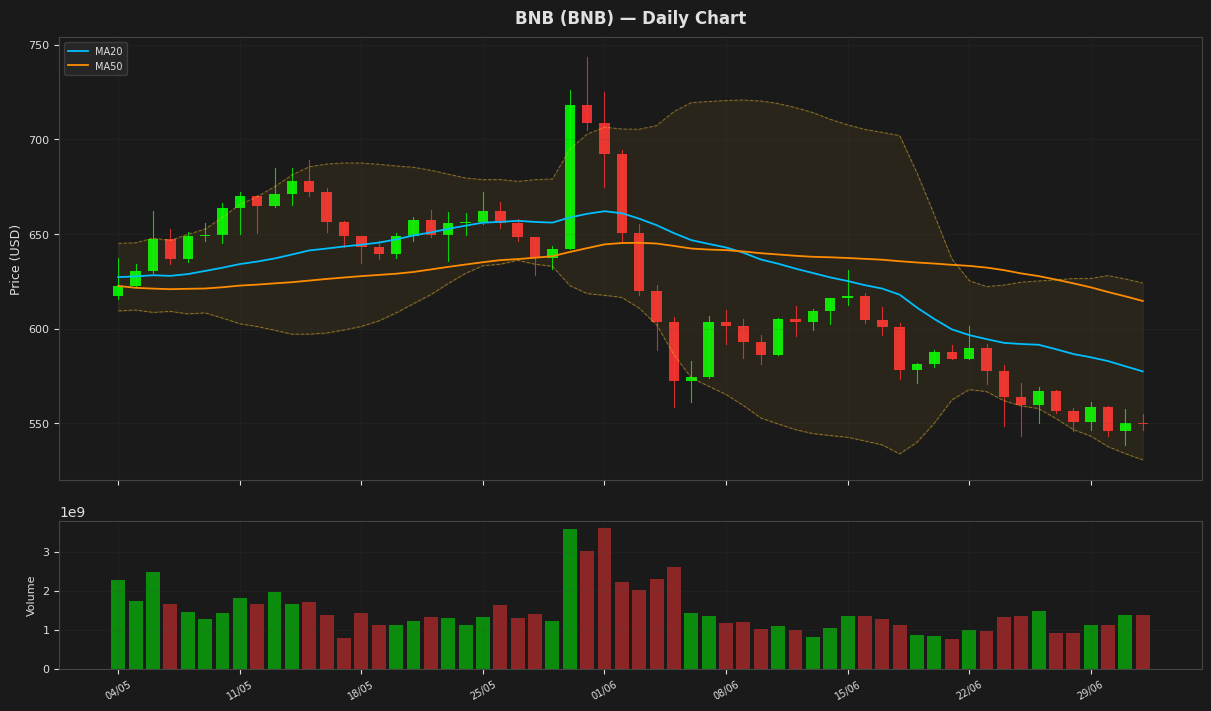
BNB is currently trading at $549.48, near its 52-week low of $538.60, with the RSI indicating oversold conditions at 35.58. The price is also near the lower Bollinger Band at $530.67, suggesting potential support. The MACD is slightly below its signal line, indicating a bearish trend. The ATR suggests moderate volatility.
Tron (TRX) — +0.46%
$0.317173 52W: $0.268138 — $0.376332
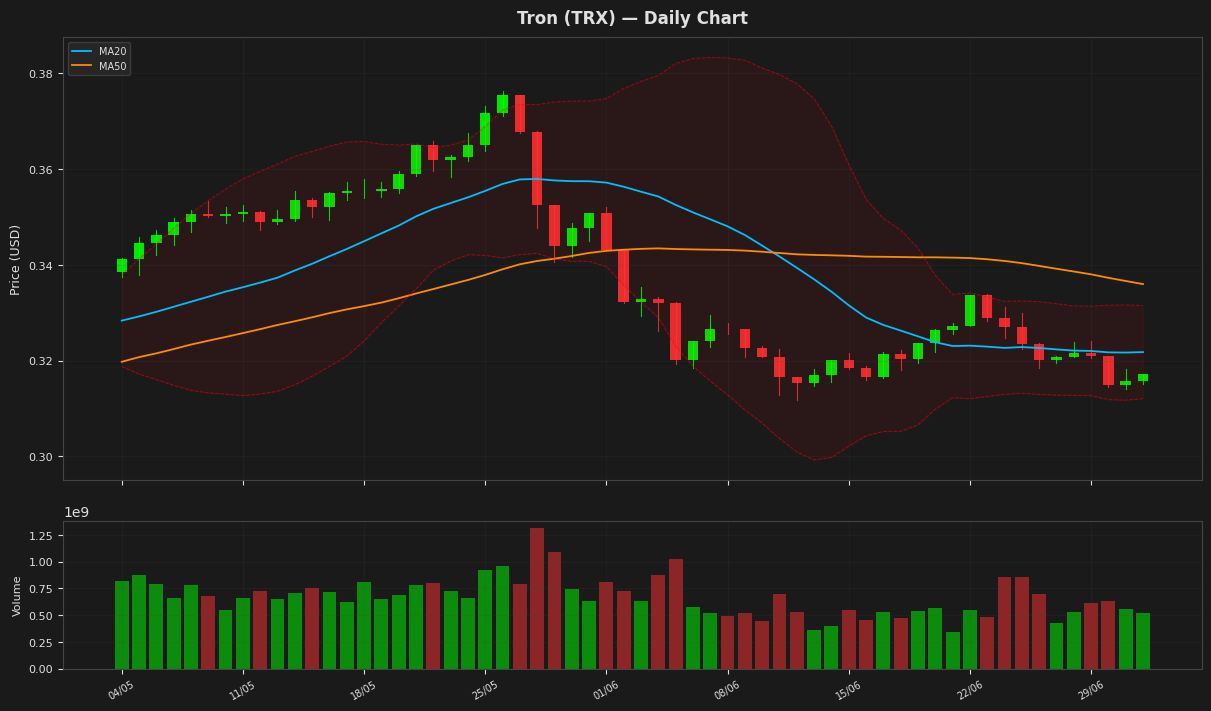
Tron's price is currently at $0.317173, below both its MA20 and MA50, indicating a bearish trend. The RSI is at 45.659287, suggesting the asset is nearing oversold territory. The Bollinger Bands indicate that the price is closer to the lower band, showing potential support at $0.312052. The MACD is slightly below its signal line, indicating a potential sell signal.
Dogecoin (DOGE) — +0.59%
$0.072600 52W: $0.069611 — $0.209315
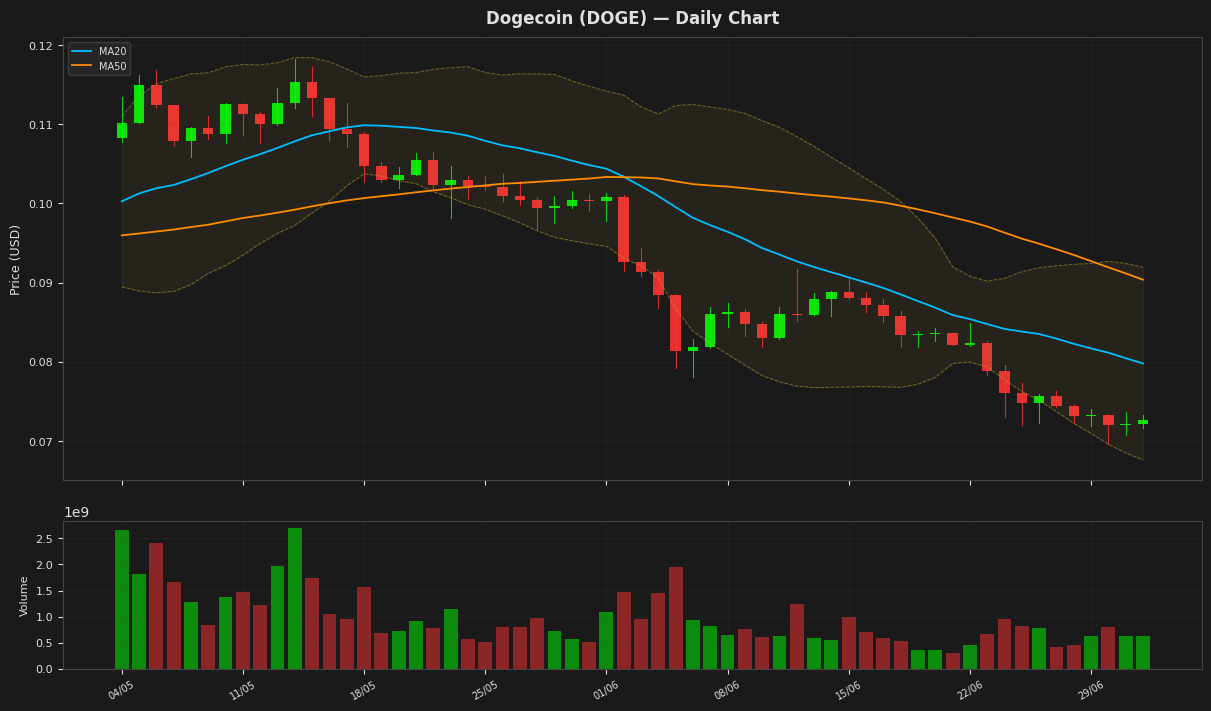
Dogecoin's price is currently at $0.072600, showing a slight increase of 0.59% for the day, and is positioned near the lower Bollinger Band at 0.067621, indicating potential oversold conditions. The RSI(14) value of 13.870923 further supports this, as it is below 20, typically considered oversold territory. The MACD is slightly below its signal line, suggesting a potential bearish trend. The price is also below both MA20 and MA50, indicating a longer-term downtrend.
Disclaimer
The content on MarketsFN.com is provided for educational and informational purposes only. It does not constitute financial advice or investment recommendations. All investments involve risk. Past performance does not guarantee future results.