S&P 500 Bull & Bear Radar — June 01, 2026
· Stocks · QuoteReporter
S&P 500 Bull & Bear Radar — June 01, 2026
A daily technical sweep of 496 S&P 500 constituents ranked by session performance, enriched with RSI, MA20/MA50/MA200 trend signals, Bloomberg-style charts, and recent news.
Index-Wide Breadth
| Constituents tracked | 496 |
| Advancing | 191 (38.5%) |
| Declining | 304 (61.3%) |
| Average daily change | 0.16% |
| Above MA200 | 12 (2.4%) |
Top 10 Gainers
Today's strongest S&P 500 performers. Sector leadership: Technology (7), Consumer Cyclical (1), Healthcare (1), Energy (1).
| Ticker | Company | Sector | Price | Day % | 1W % | 1M % | RSI | vs MA200 | Trend |
|---|---|---|---|---|---|---|---|---|---|
| MGM | MGM Resorts International | Consumer Cyclical | $49.85 | +14.15% | +29.86% | +28.06% | 84.2 | +39.1% | Above MA20, MA50, MA200 |
| NOW | ServiceNow Inc | Technology | $135.21 | +8.72% | +32.57% | +53.31% | 78.2 | -4.3% | Above MA20, MA50 · Below MA200 |
| HUM | Humana Inc | Healthcare | $330.95 | +8.36% | +7.47% | +39.97% | 80.6 | +35.2% | Above MA20, MA50, MA200 |
| CDW | CDW Corp | Technology | $135.27 | +7.83% | +22.06% | -1.20% | 69.0 | -2.4% | Above MA20, MA50 · Below MA200 |
| CRM | Salesforce Inc | Technology | $205.90 | +7.74% | +14.49% | +16.79% | 69.1 | -6.9% | Above MA20, MA50 · Below MA200 |
| DELL | Dell Technologies Inc | Technology | $450.03 | +6.92% | +52.46% | +115.39% | 90.7 | +188.8% | Above MA20, MA50, MA200 |
| INTU | Intuit Inc | Technology | $352.71 | +6.39% | +10.06% | -9.36% | 46.3 | -35.7% | Below MA20, MA50, MA200 |
| WDAY | Workday Inc | Technology | $154.59 | +5.75% | +20.70% | +26.36% | 70.6 | -16.7% | Above MA20, MA50 · Below MA200 |
| IT | Gartner, Inc | Technology | $171.32 | +5.62% | +7.07% | +15.37% | 66.9 | -17.0% | Above MA20, MA50 · Below MA200 |
| DVN | Devon Energy Corp | Energy | $46.97 | +5.59% | -0.53% | -8.57% | 49.6 | +17.4% | Above MA200 · Below MA20, MA50 |
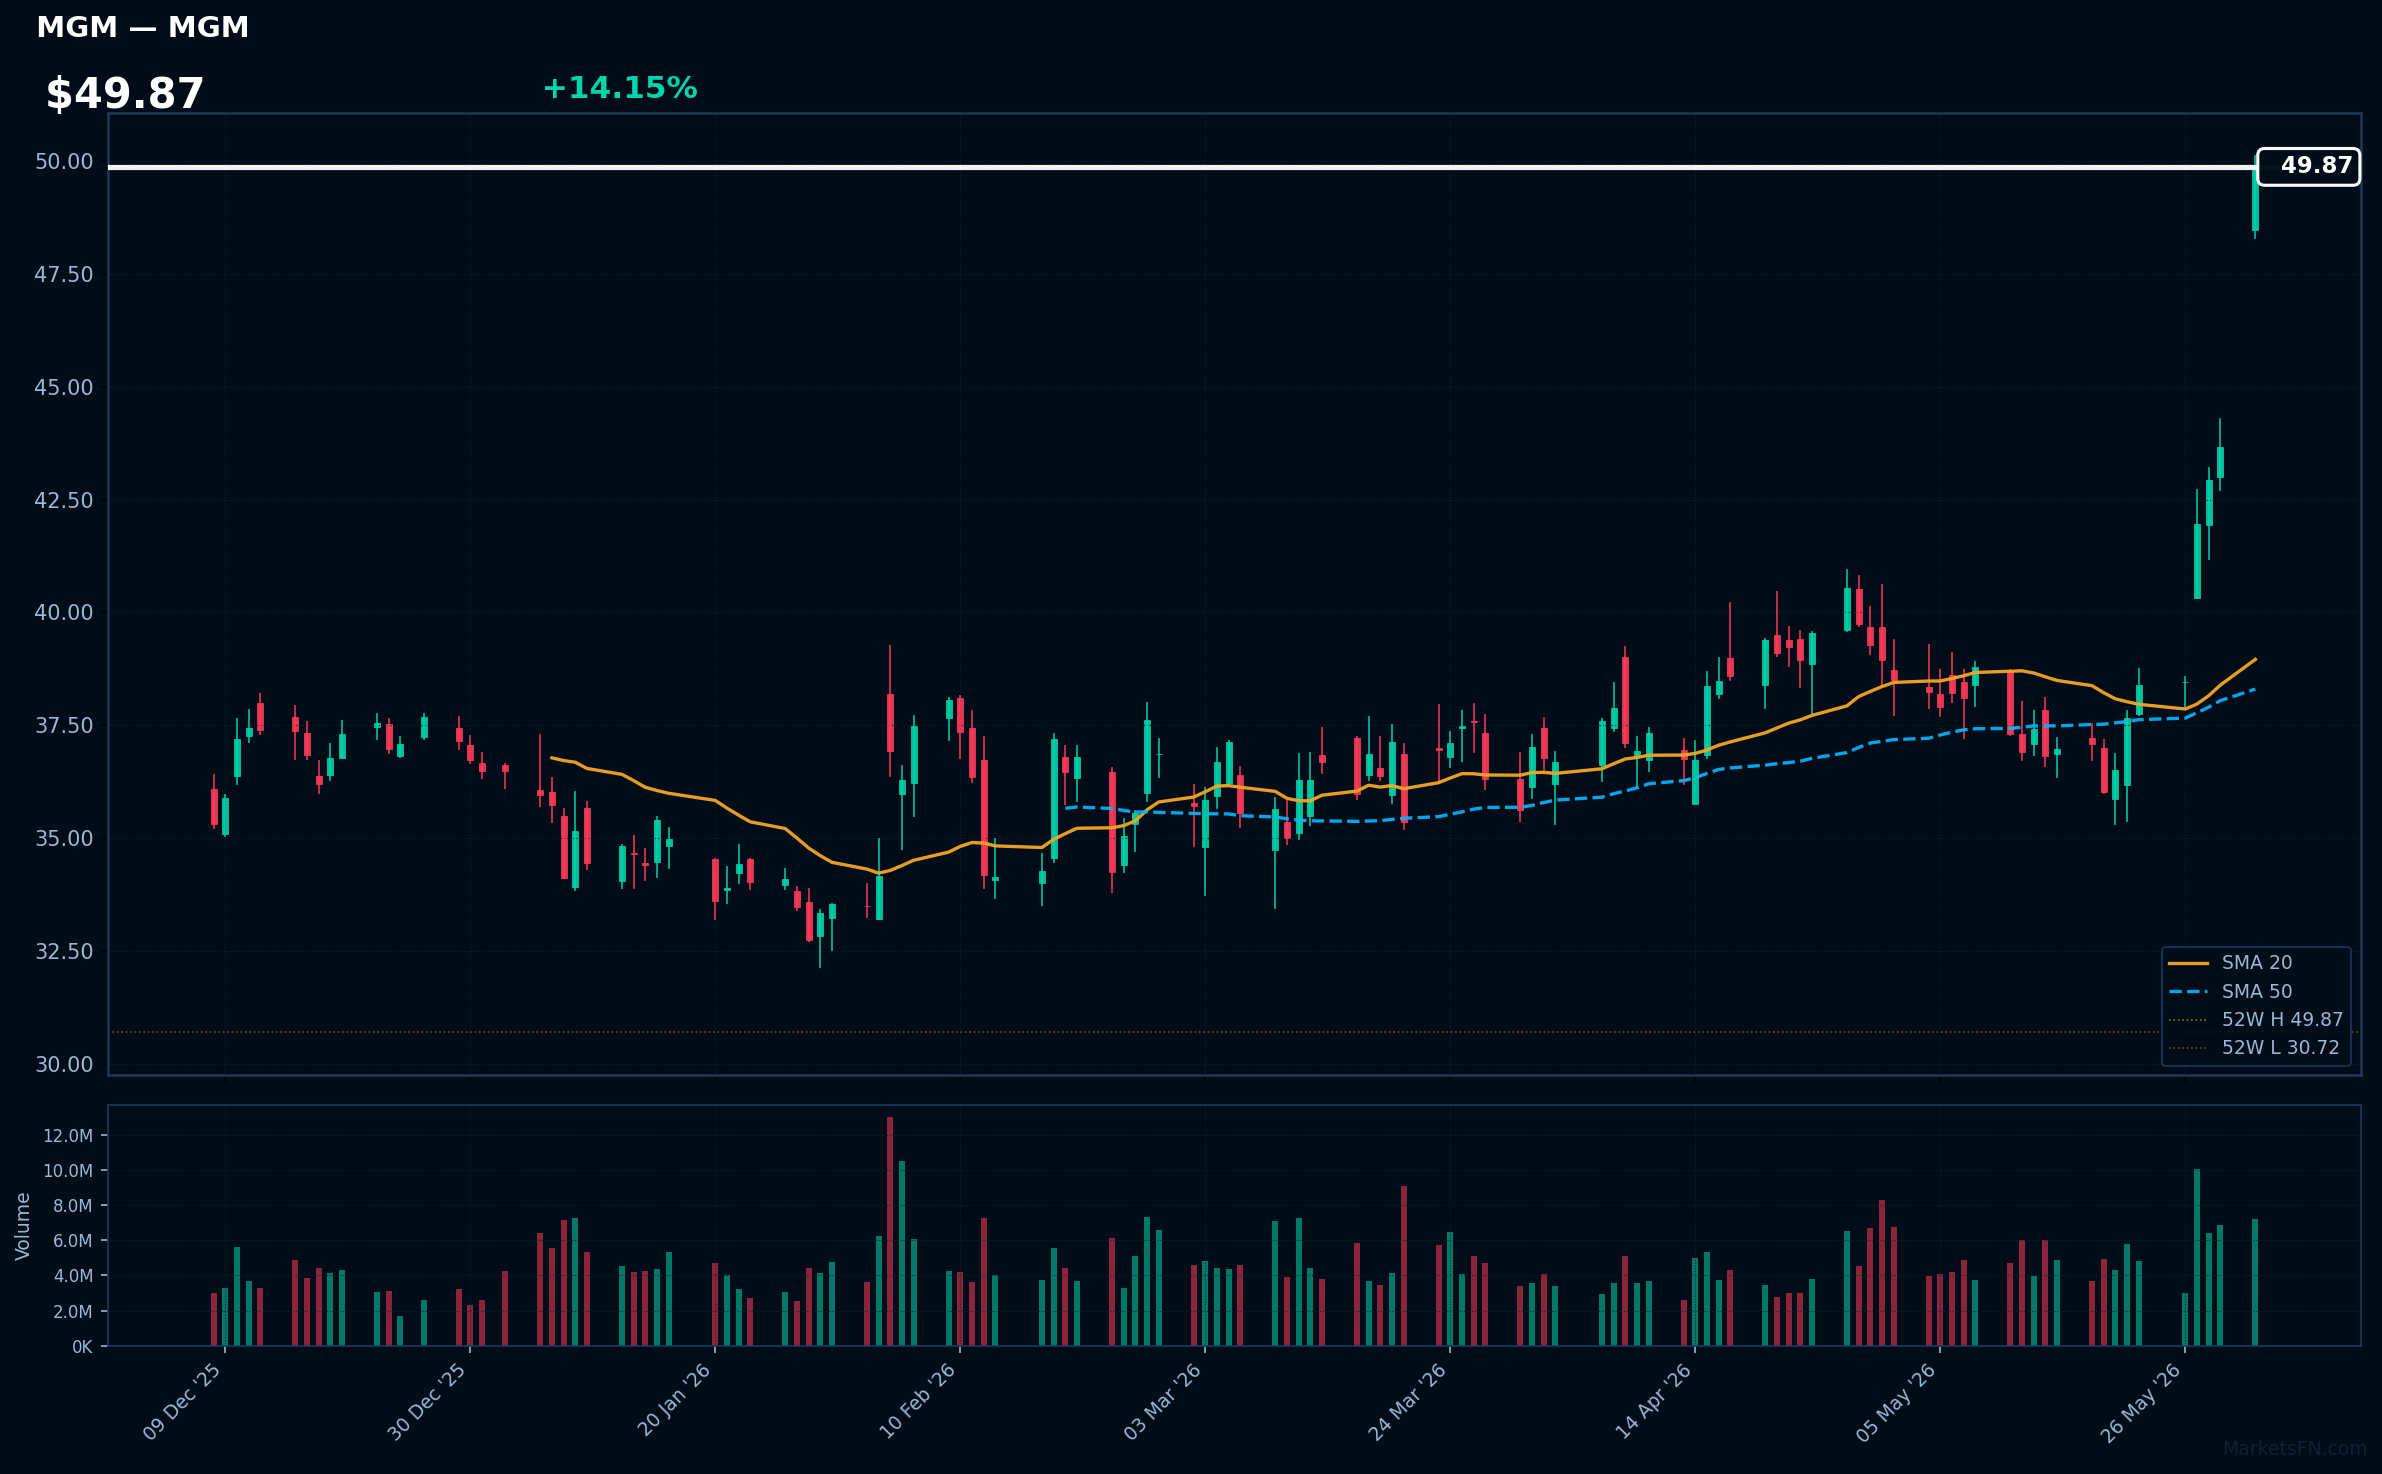
MGM | MGM Resorts International | Consumer Cyclical | Price: $49.85 | Day: +14.15% | 1W: +29.86% | 1M: +28.06% | RSI: 84.2 | vs MA200: +39.1% | Trend: Above MA20, MA50, MA200
Recent headlines (last 12h)
- Stocks to Watch: Nvidia, Qualcomm, Taylor Morrison, MGM
- MGM Stock Jumps on Takeover Offer From People Inc.
- Barry Diller People Inc. bid to take MGM Resorts private
- Why Is MGM Stock Rising Today?
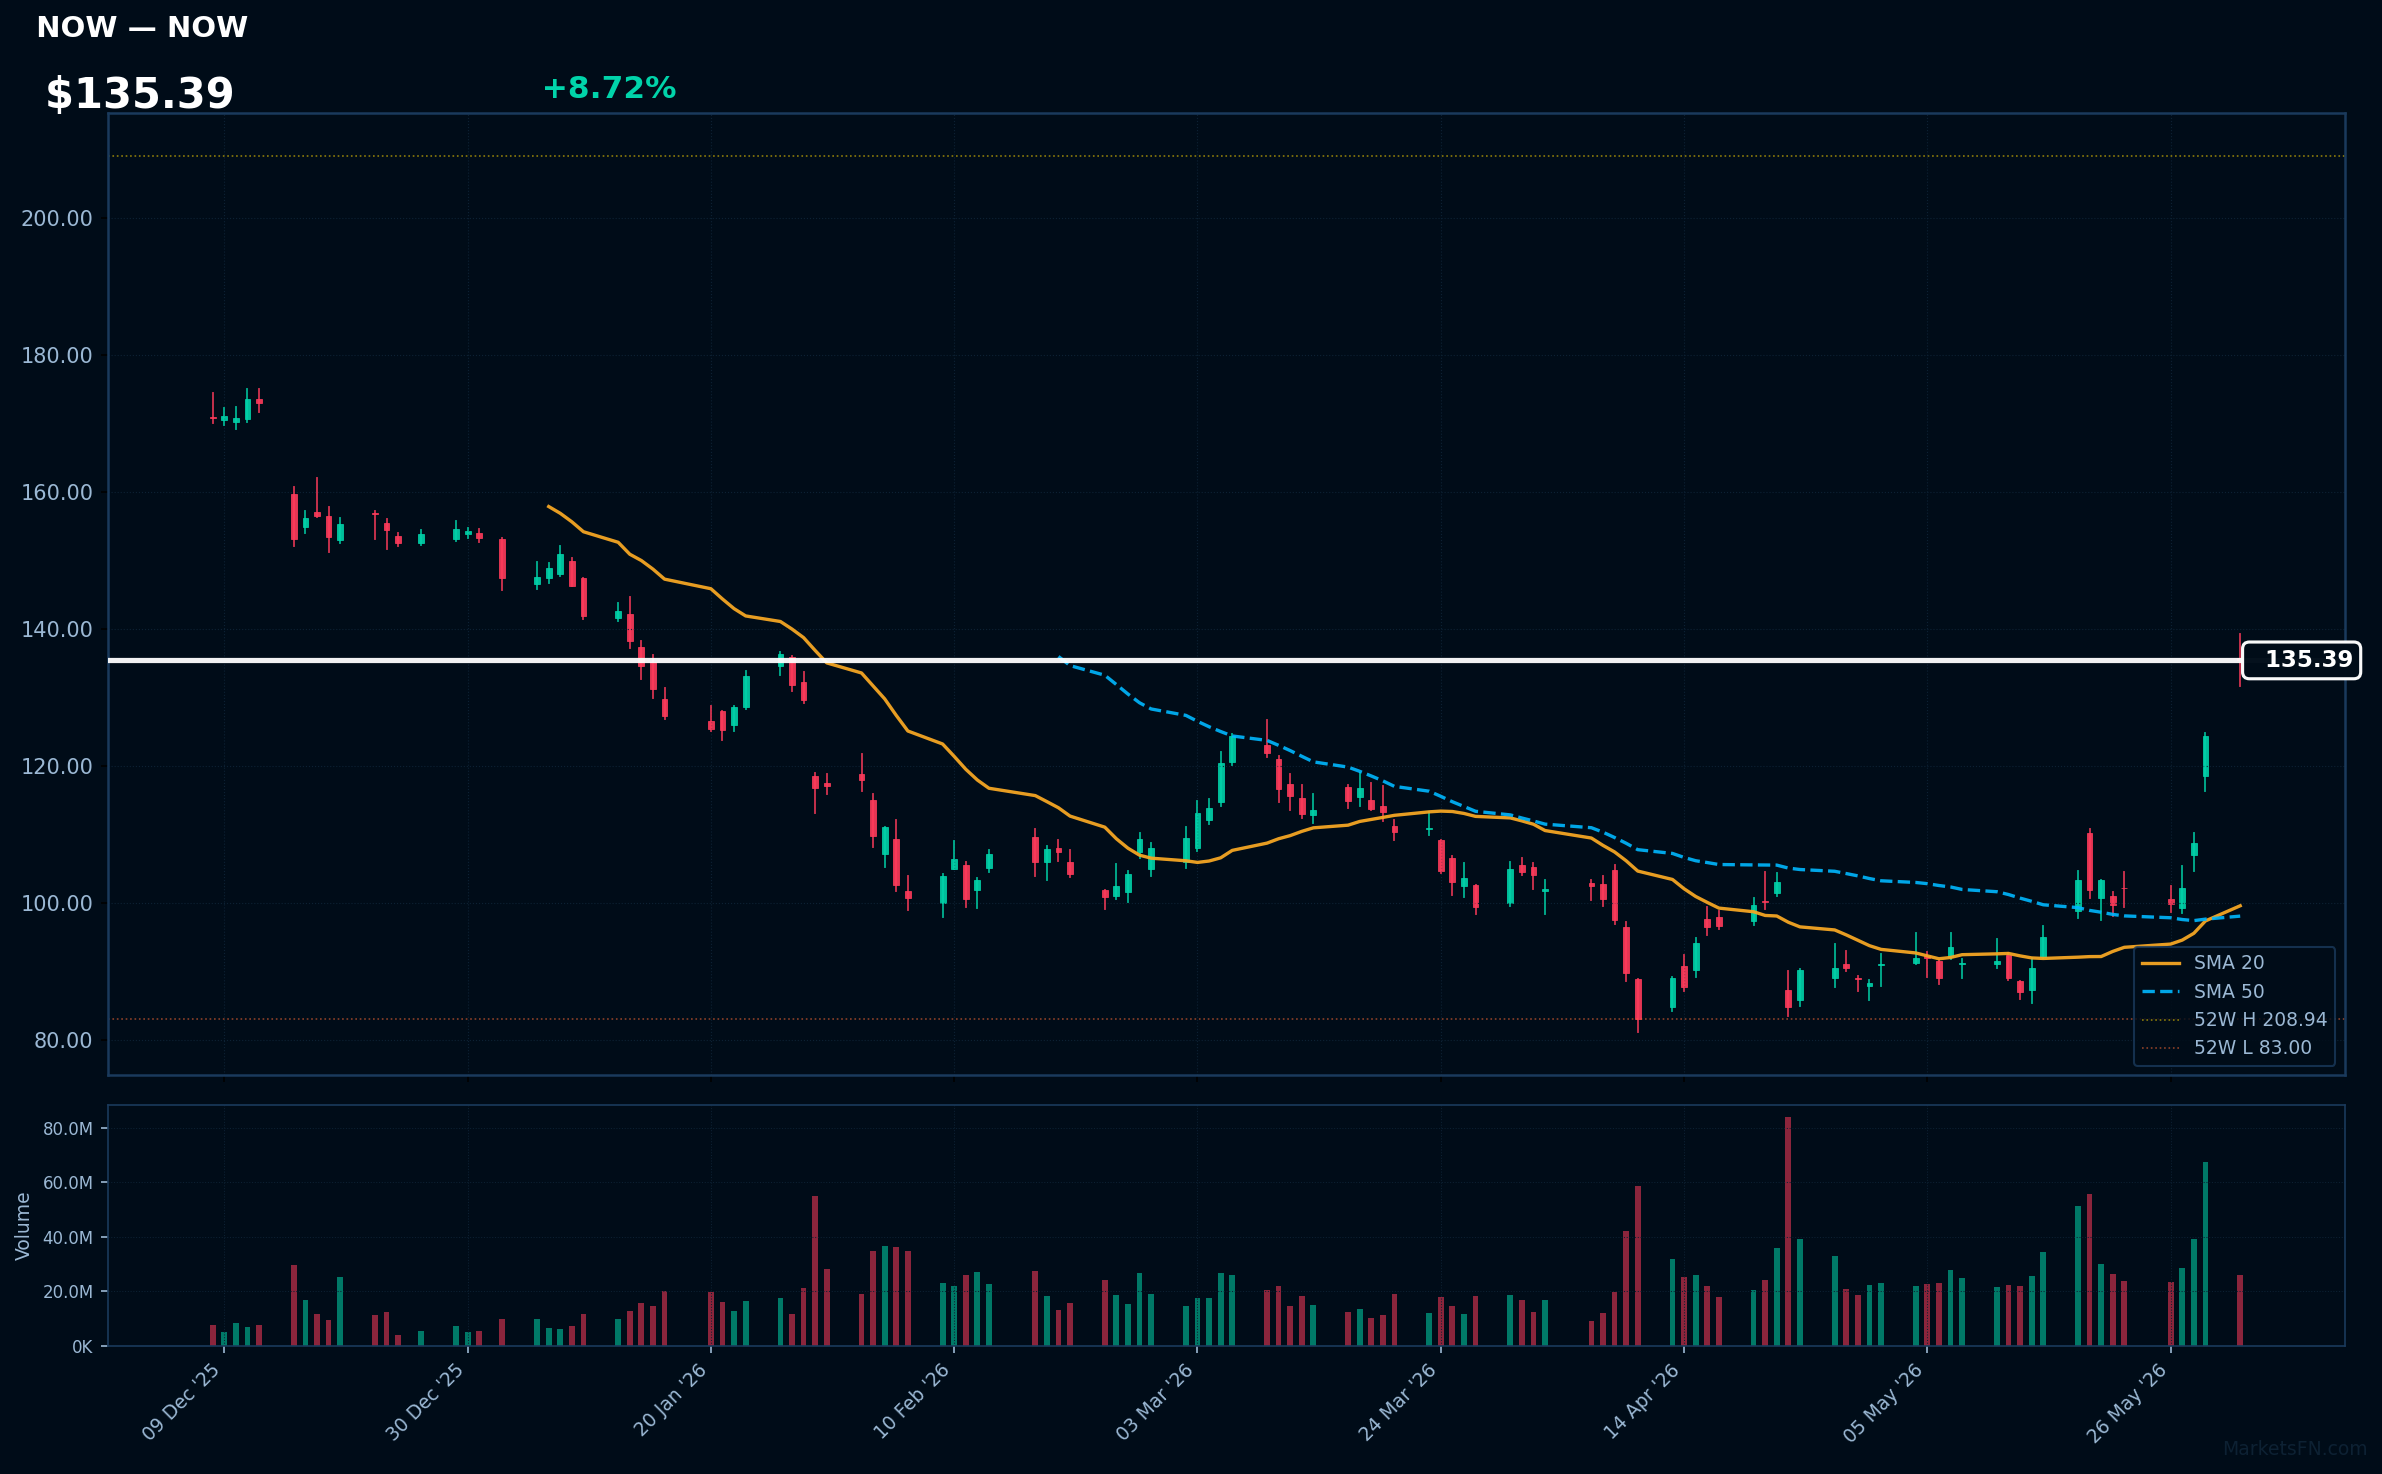
NOW | ServiceNow Inc | Technology | Price: $135.21 | Day: +8.72% | 1W: +32.57% | 1M: +53.31% | RSI: 78.2 | vs MA200: -4.3% | Trend: Above MA20, MA50 · Below MA200
Recent headlines (last 12h)
- ServiceNow Jumps as AI Fears Ease
- ServiceNow, Adobe stocks jump as Nvidia's new AI chip sparks software rally
- Software stocks soar in premarket trading, with comeback run set to continue
- Software stocks surge as Nvidias Huang dismisses AI disruption fears
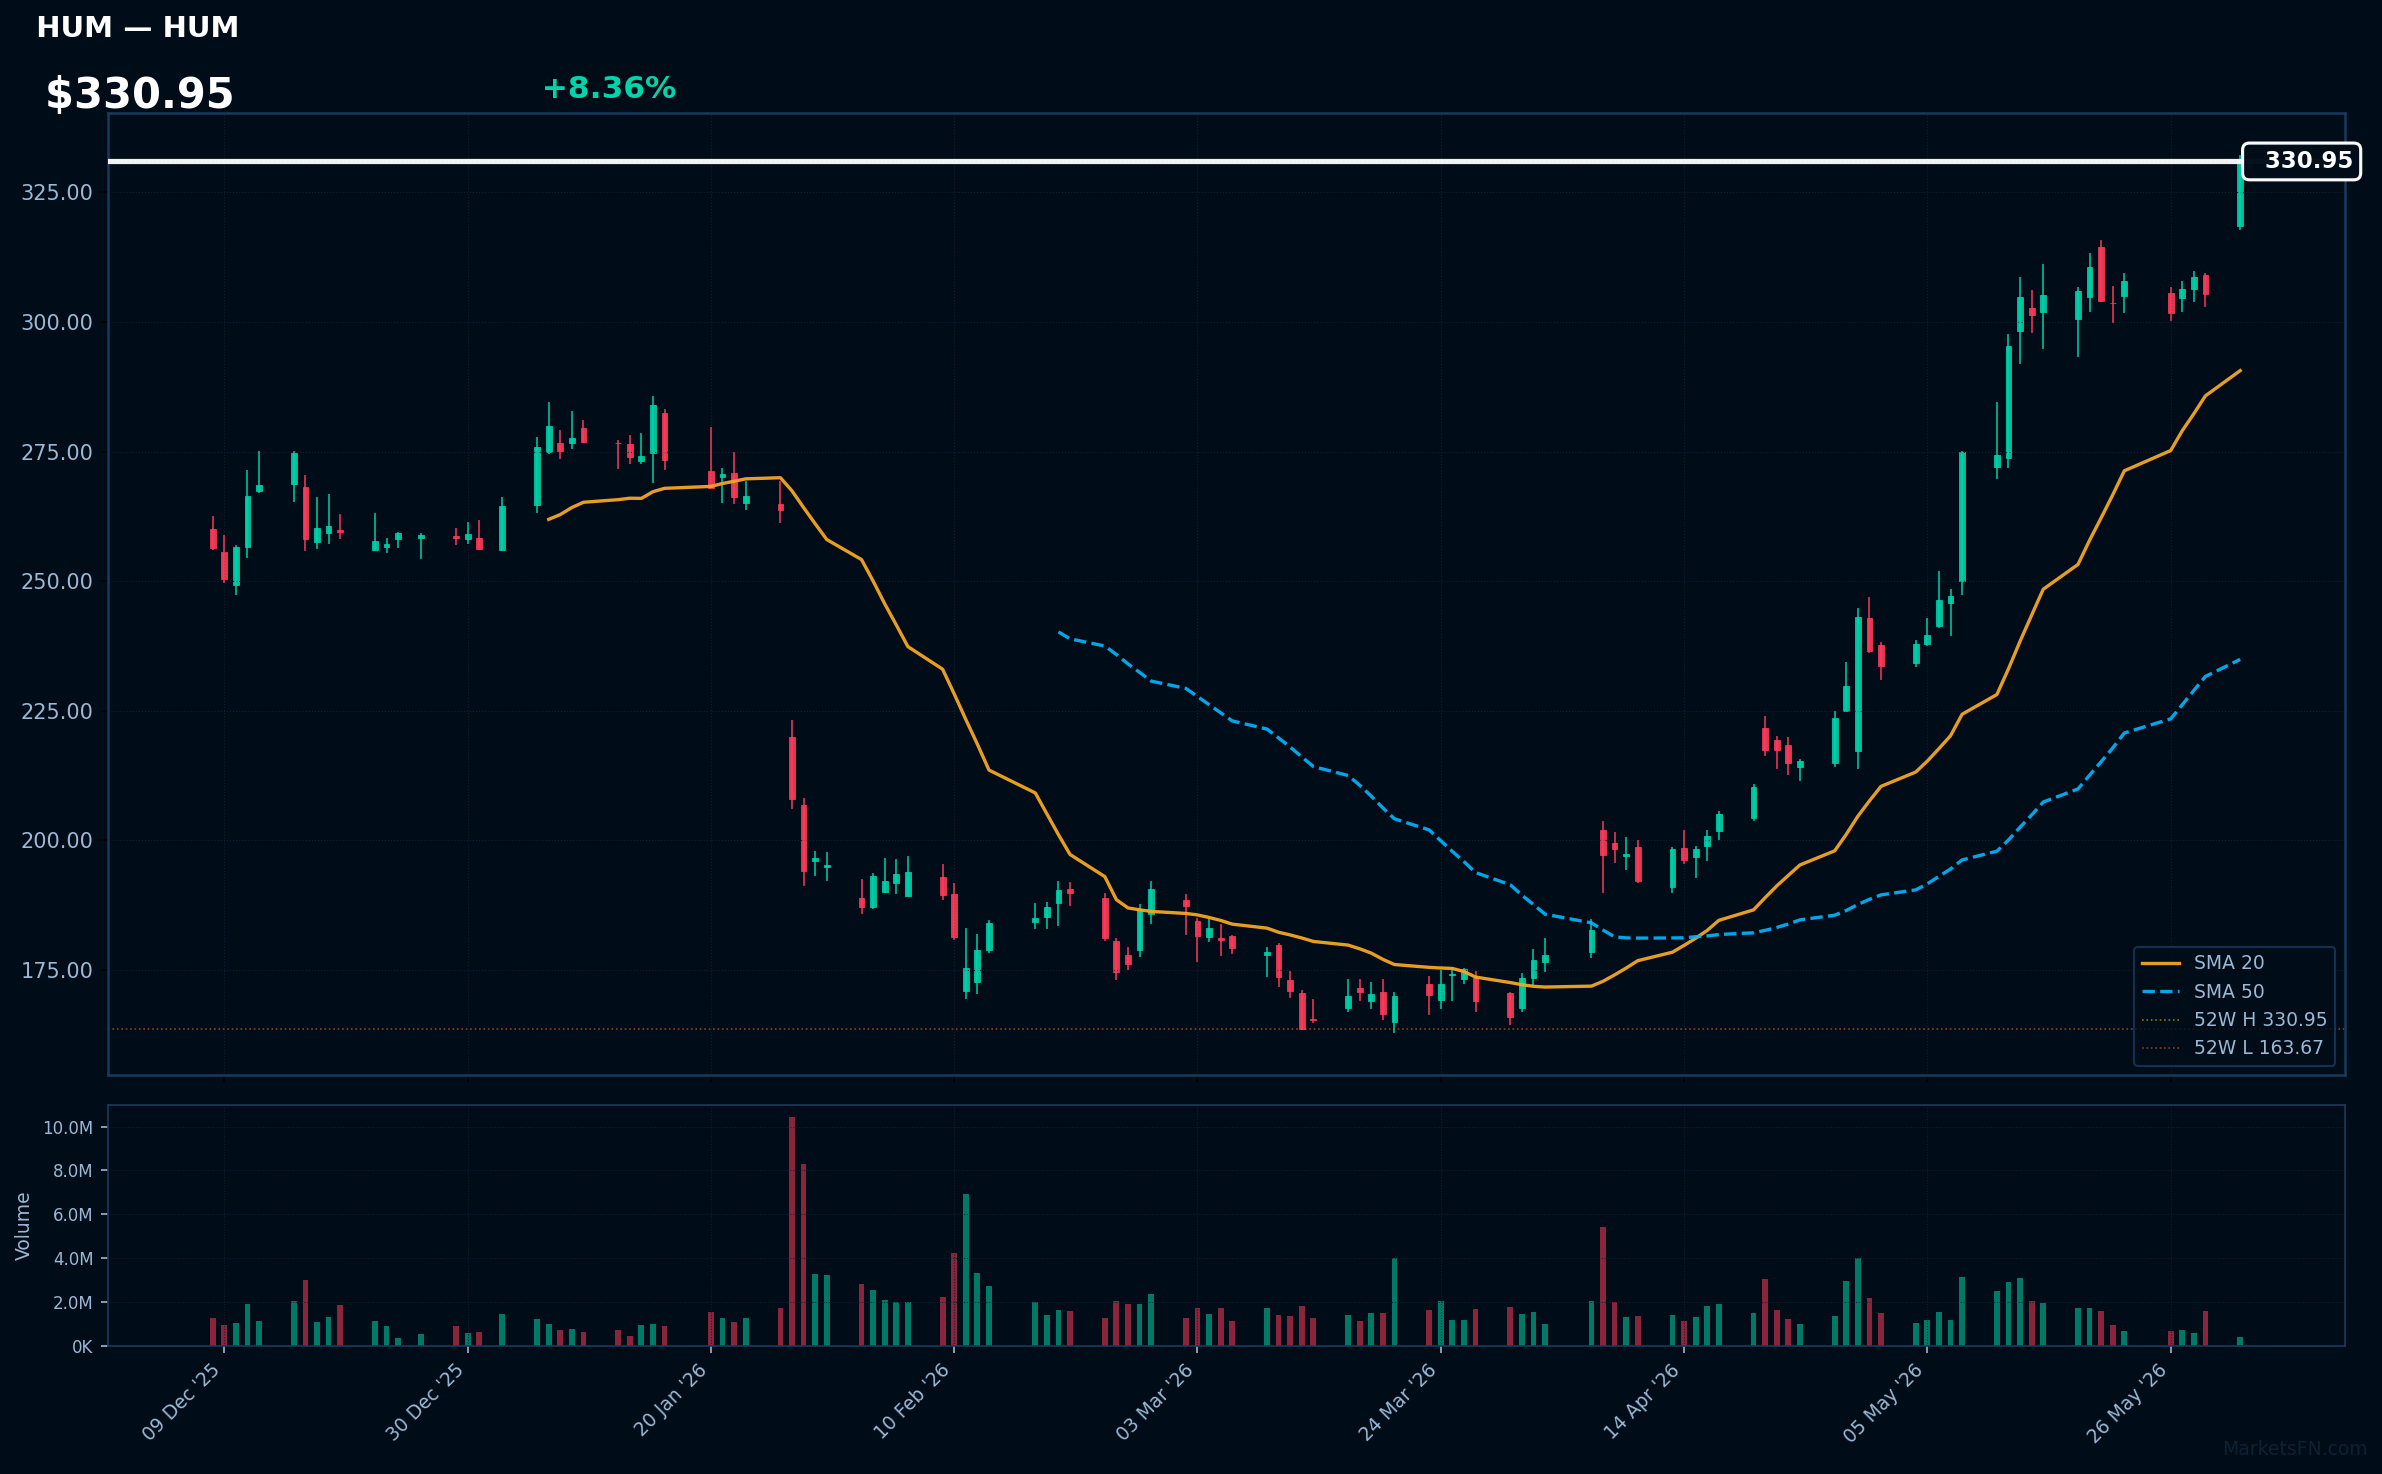
HUM | Humana Inc | Healthcare | Price: $330.95 | Day: +8.36% | 1W: +7.47% | 1M: +39.97% | RSI: 80.6 | vs MA200: +35.2% | Trend: Above MA20, MA50, MA200
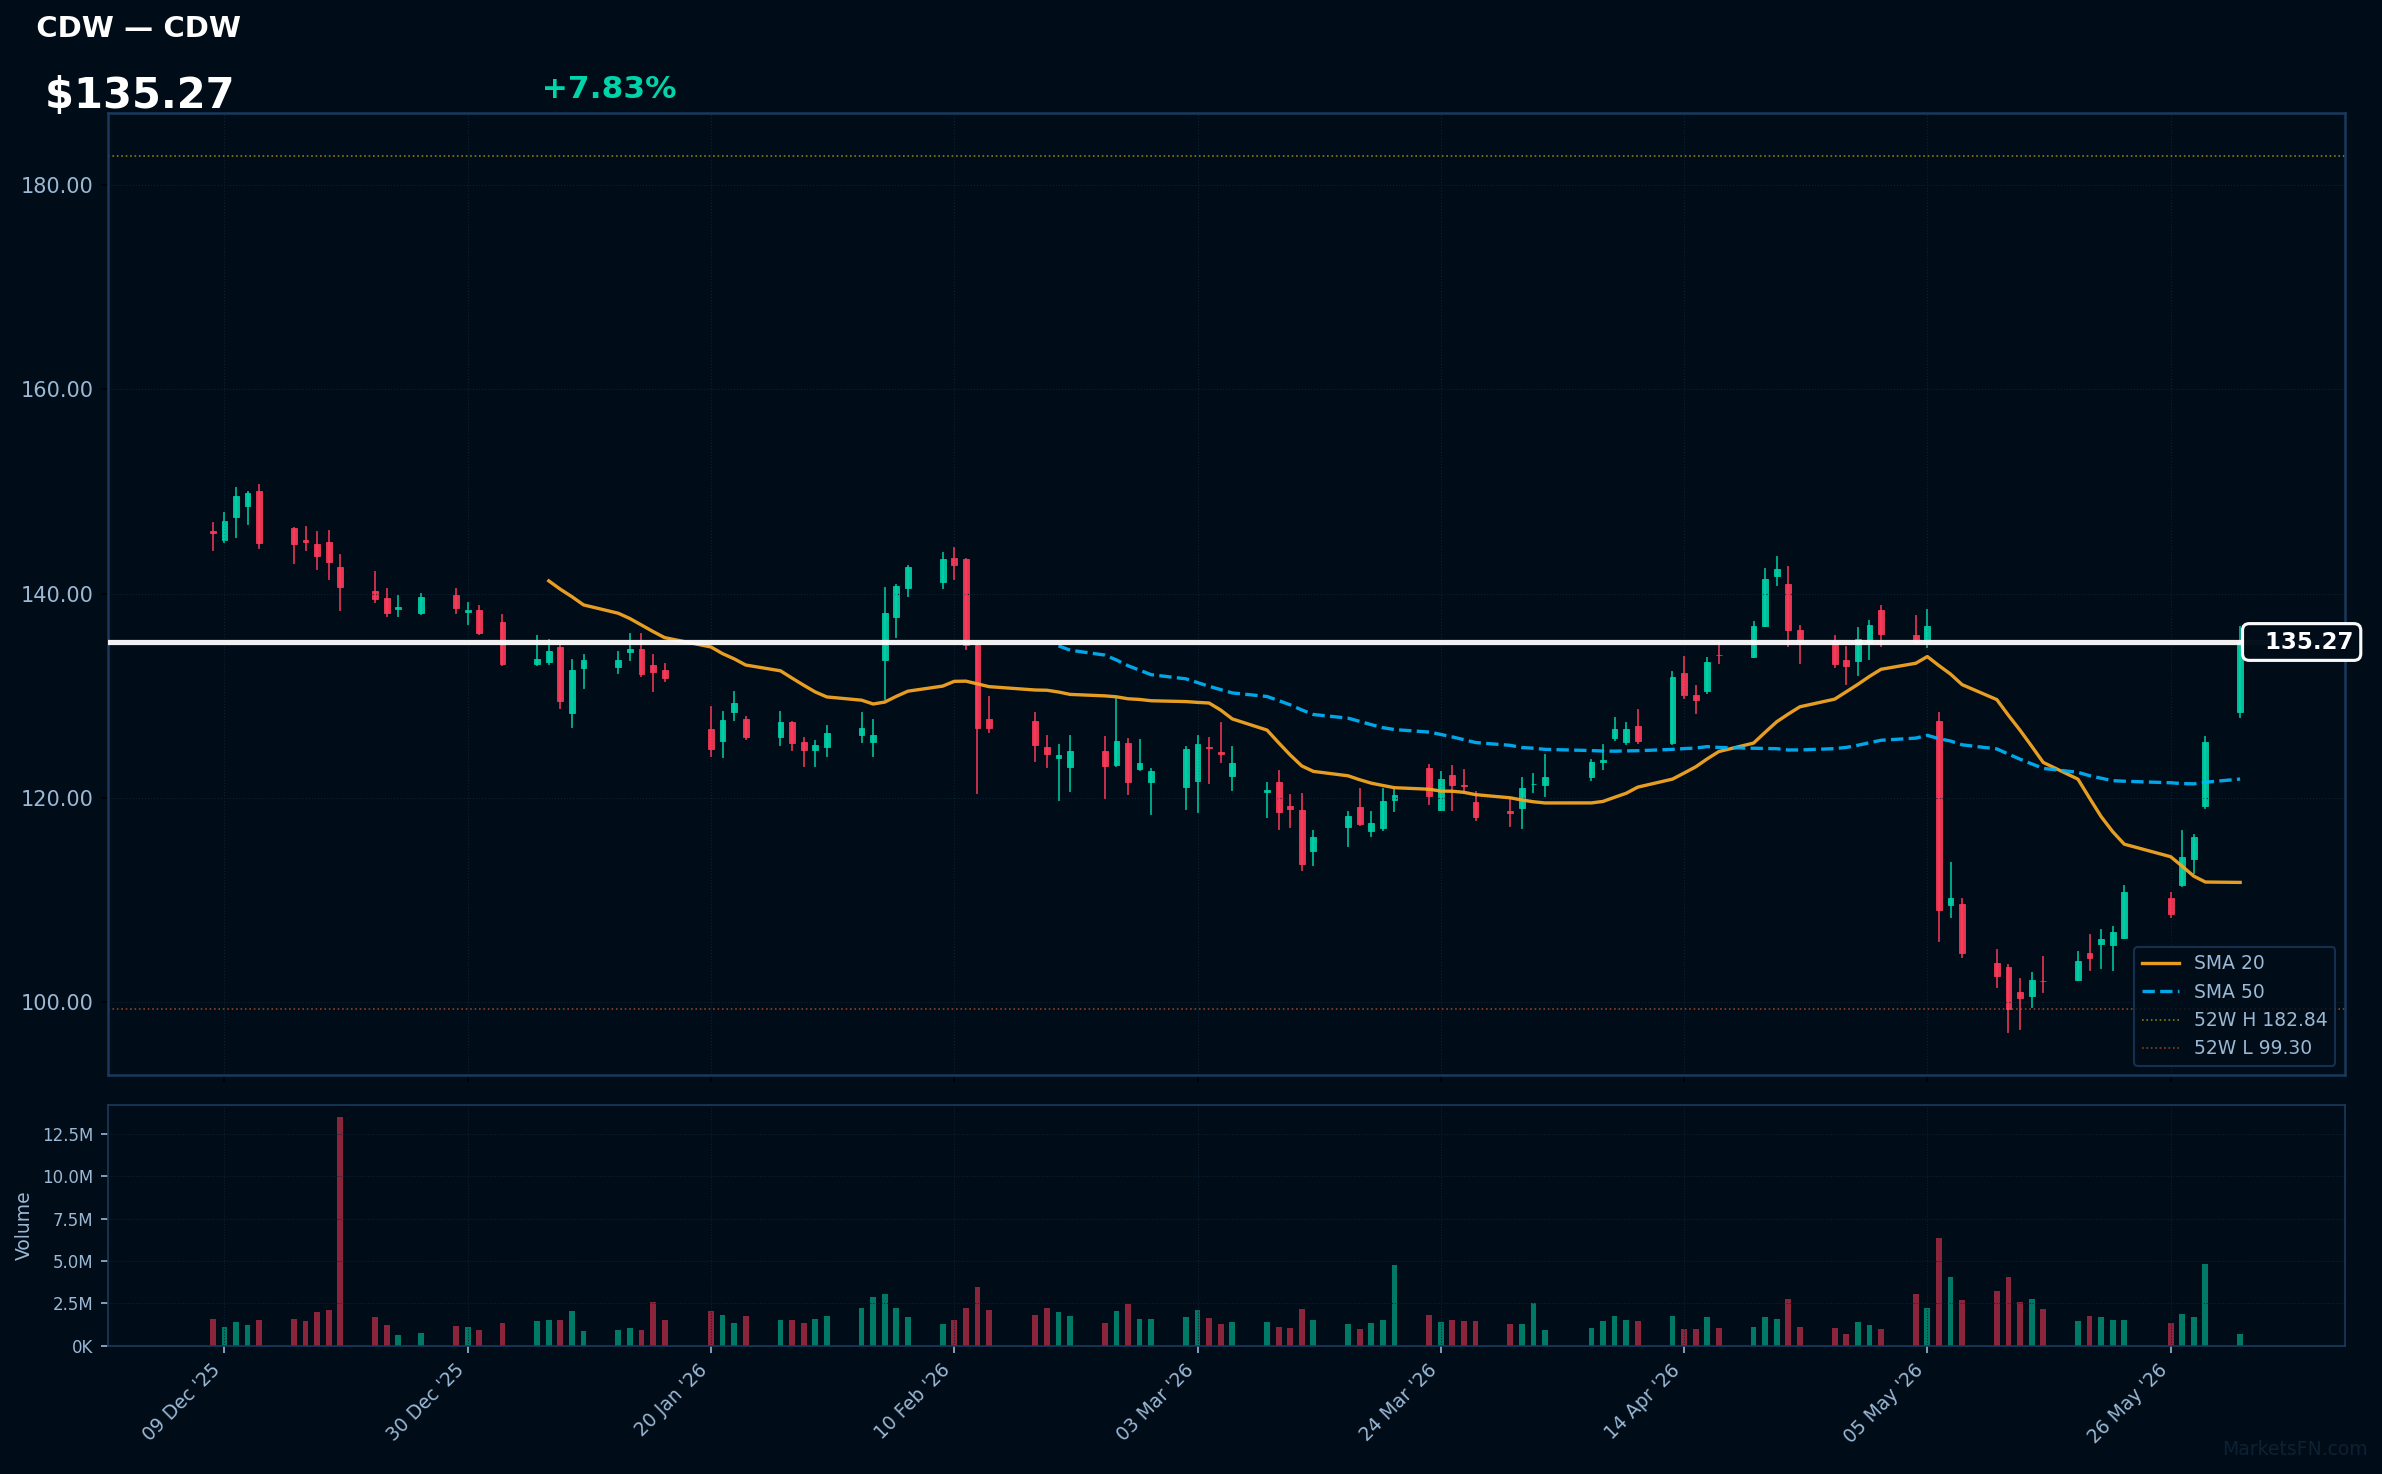
CDW | CDW Corp | Technology | Price: $135.27 | Day: +7.83% | 1W: +22.06% | 1M: -1.20% | RSI: 69.0 | vs MA200: -2.4% | Trend: Above MA20, MA50 · Below MA200
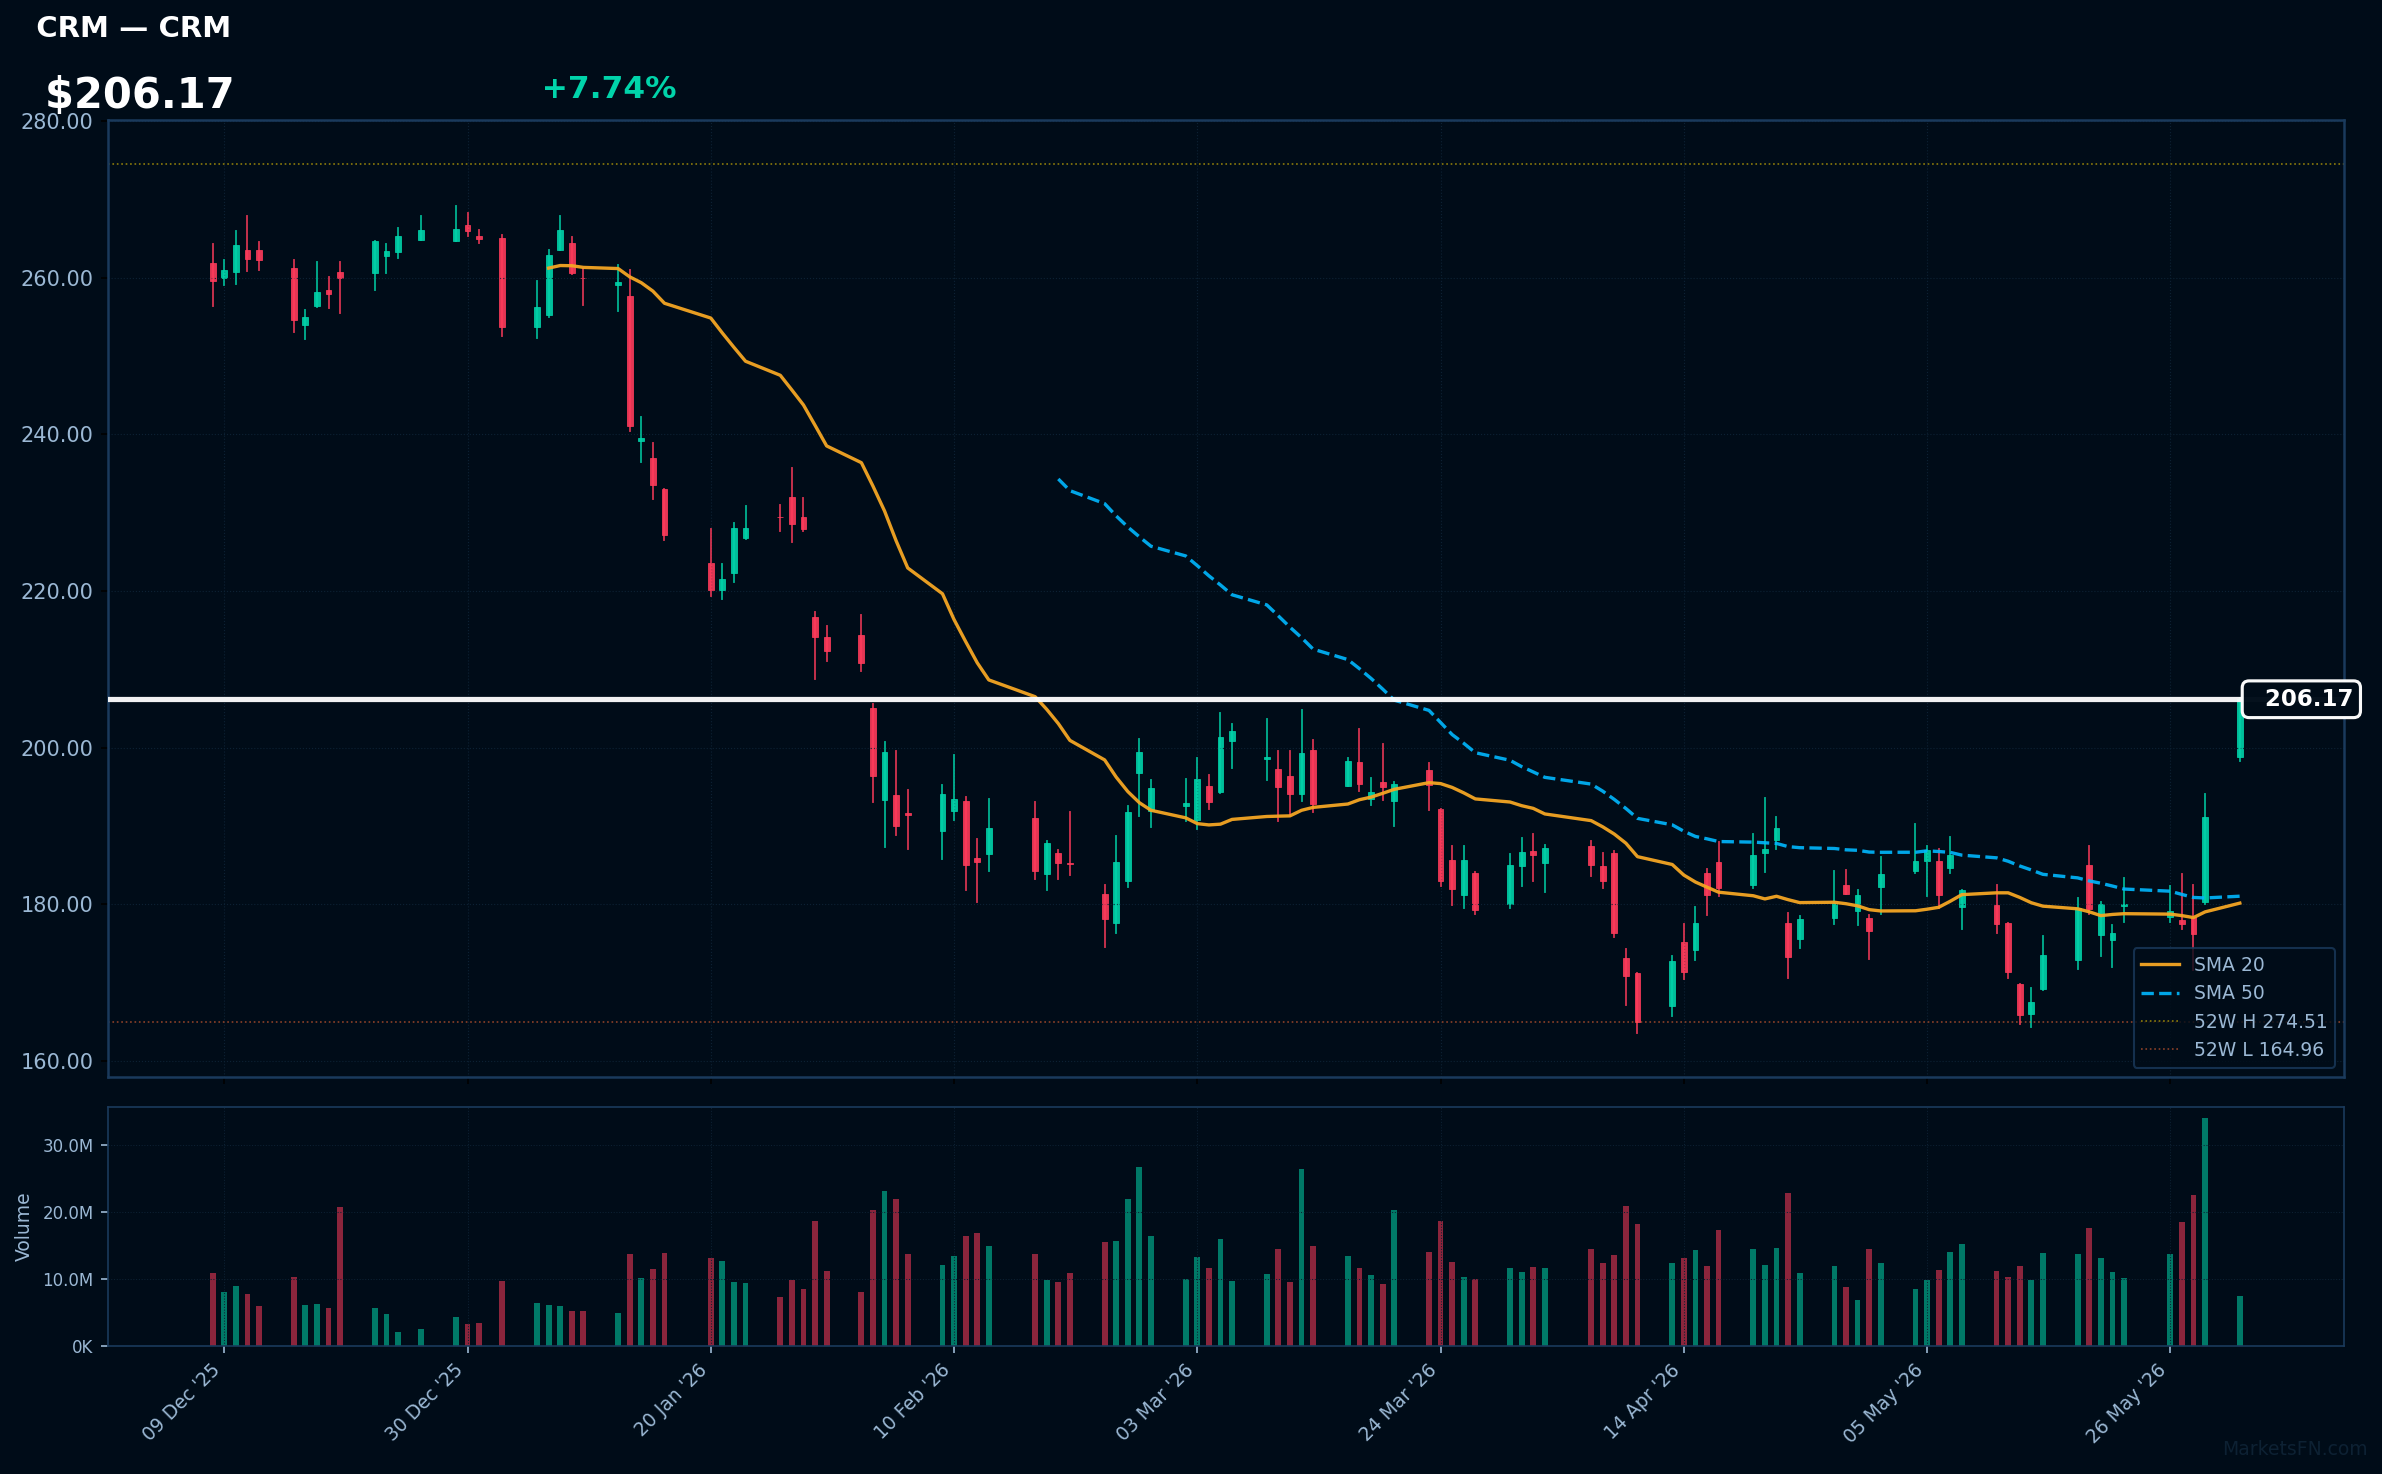
CRM | Salesforce Inc | Technology | Price: $205.90 | Day: +7.74% | 1W: +14.49% | 1M: +16.79% | RSI: 69.1 | vs MA200: -6.9% | Trend: Above MA20, MA50 · Below MA200
Recent headlines (last 12h)
- Software stocks soar in premarket trading, with comeback run set to continue
- Software stocks surge as Nvidias Huang dismisses AI disruption fears
- ServiceNow Stock Soars. The Software Comeback Is On.
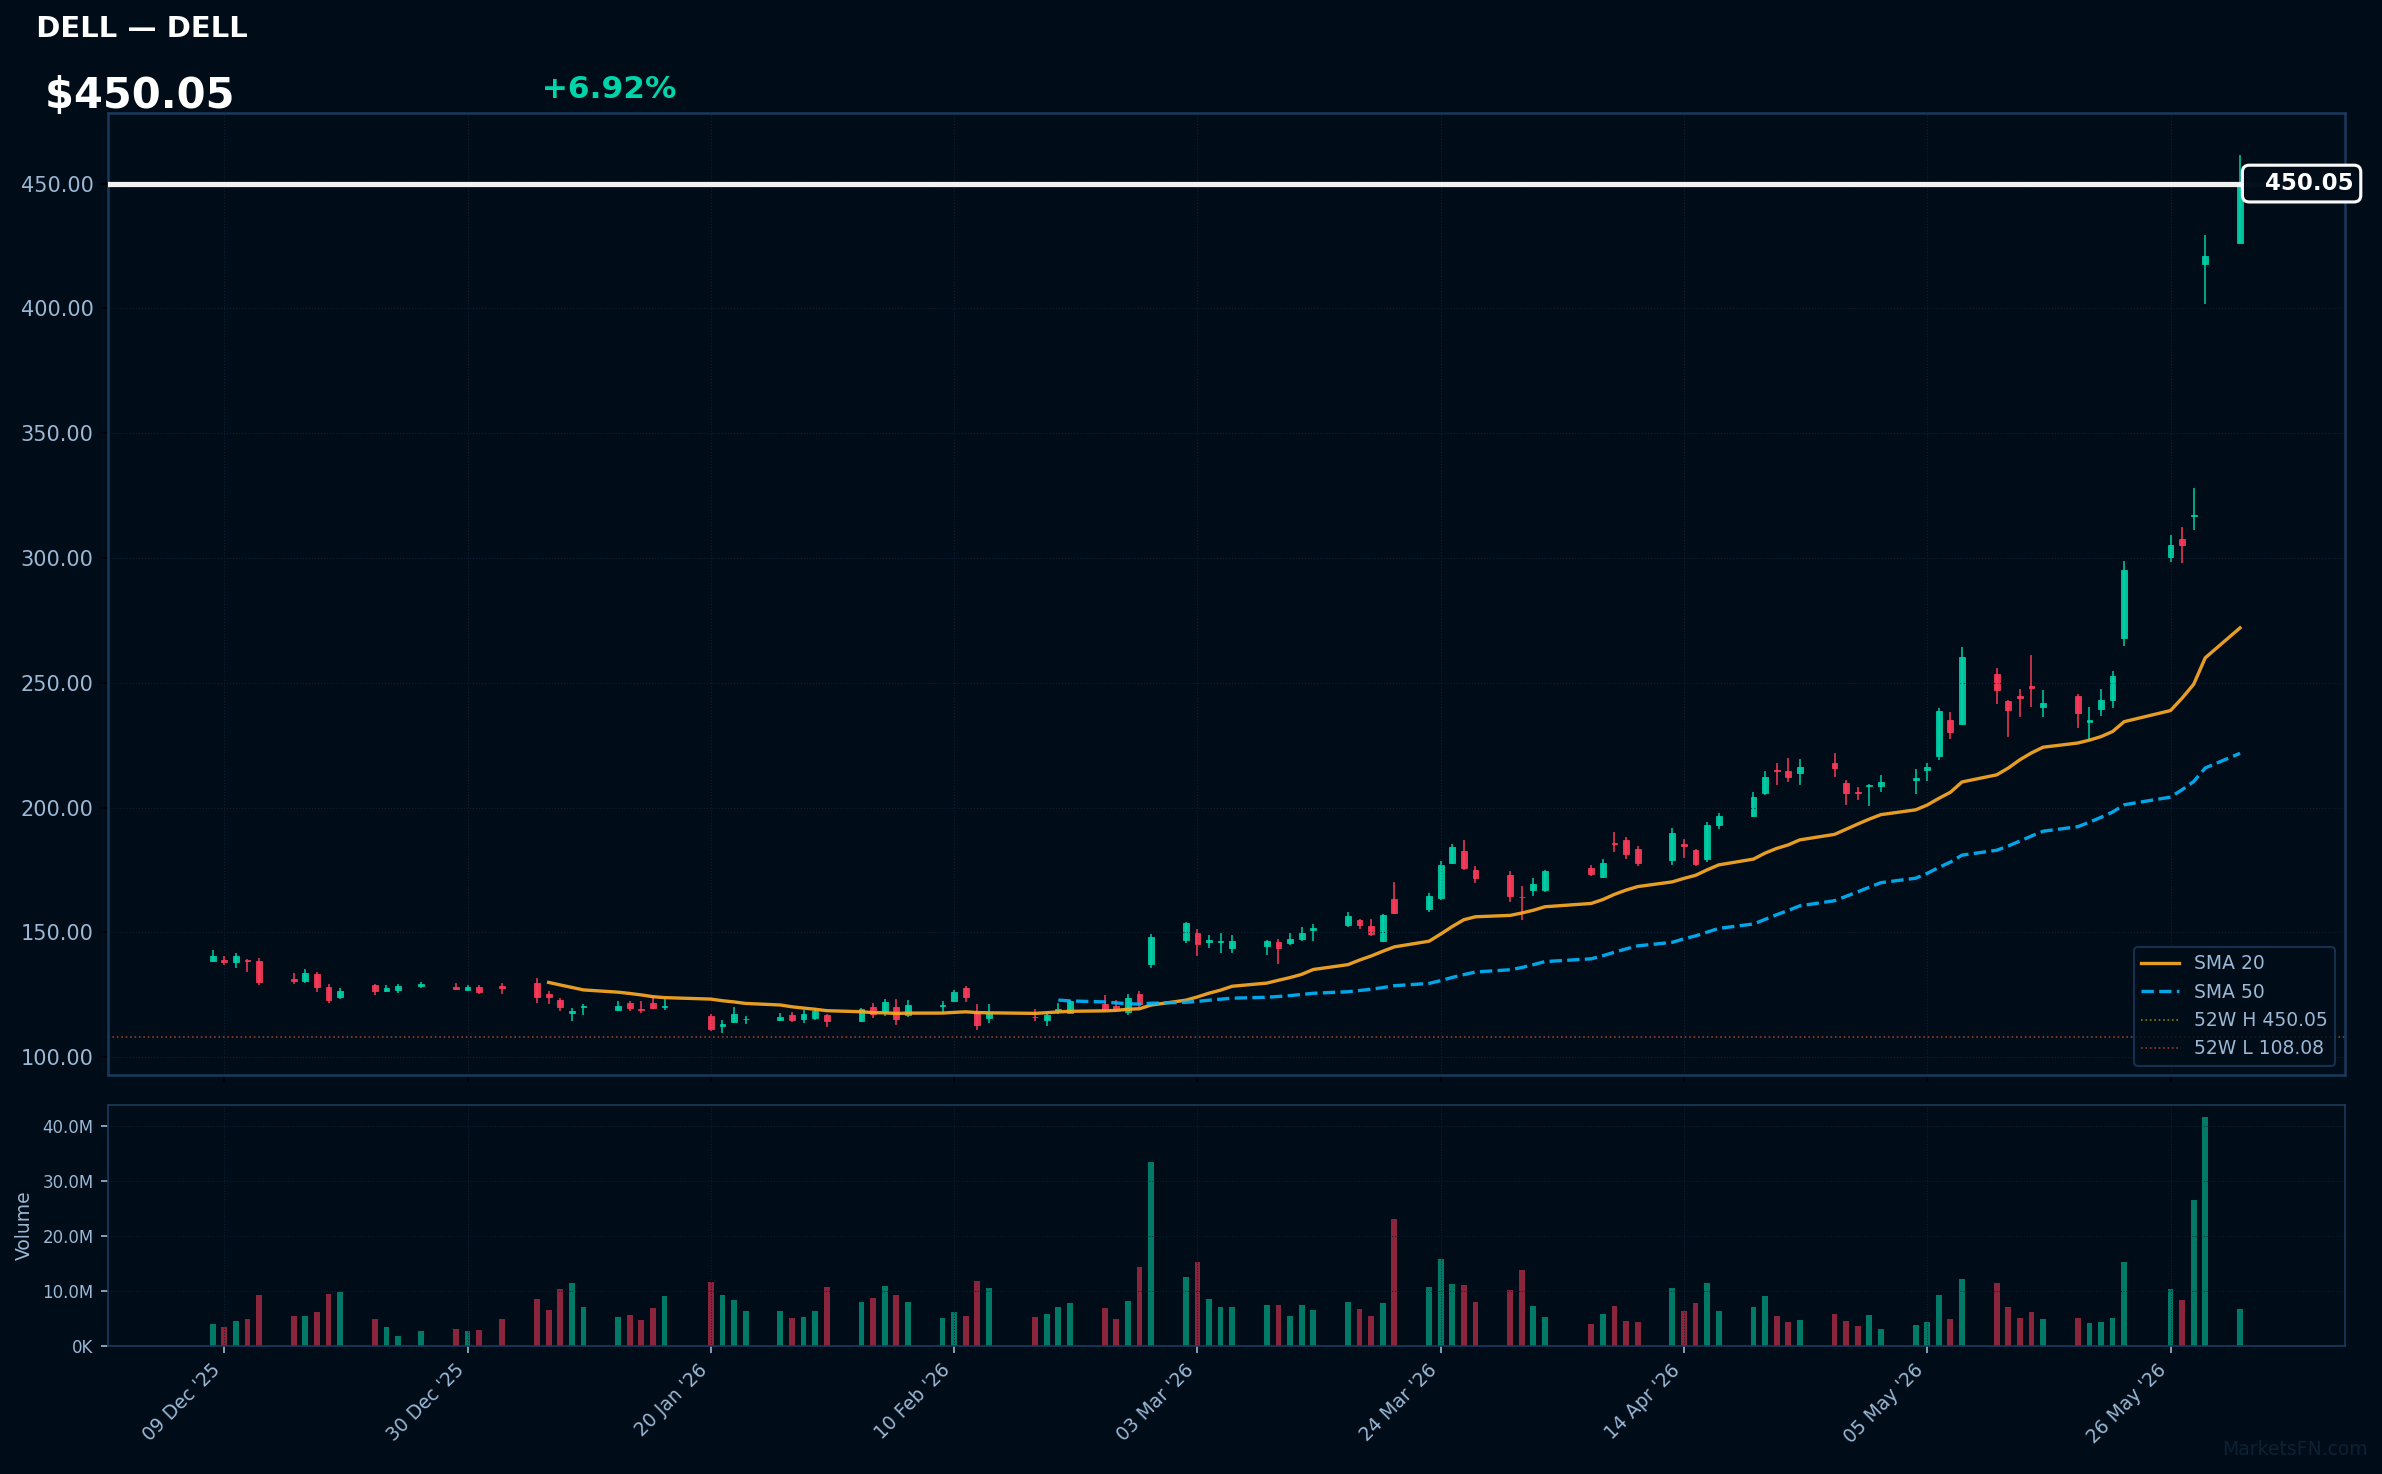
DELL | Dell Technologies Inc | Technology | Price: $450.03 | Day: +6.92% | 1W: +52.46% | 1M: +115.39% | RSI: 90.7 | vs MA200: +188.8% | Trend: Above MA20, MA50, MA200
Recent headlines (last 12h)
- Nvidia Says Anthropic, OpenAI Among Users of New Vera Chip
- Stocks to Watch: Nvidia, Qualcomm, Taylor Morrison, MGM
- Microsoft initiated, Dell upgraded: Wall Street's top analyst calls
- Nvidia Is Taking On Intel and AMD With New AI Chip for Computers
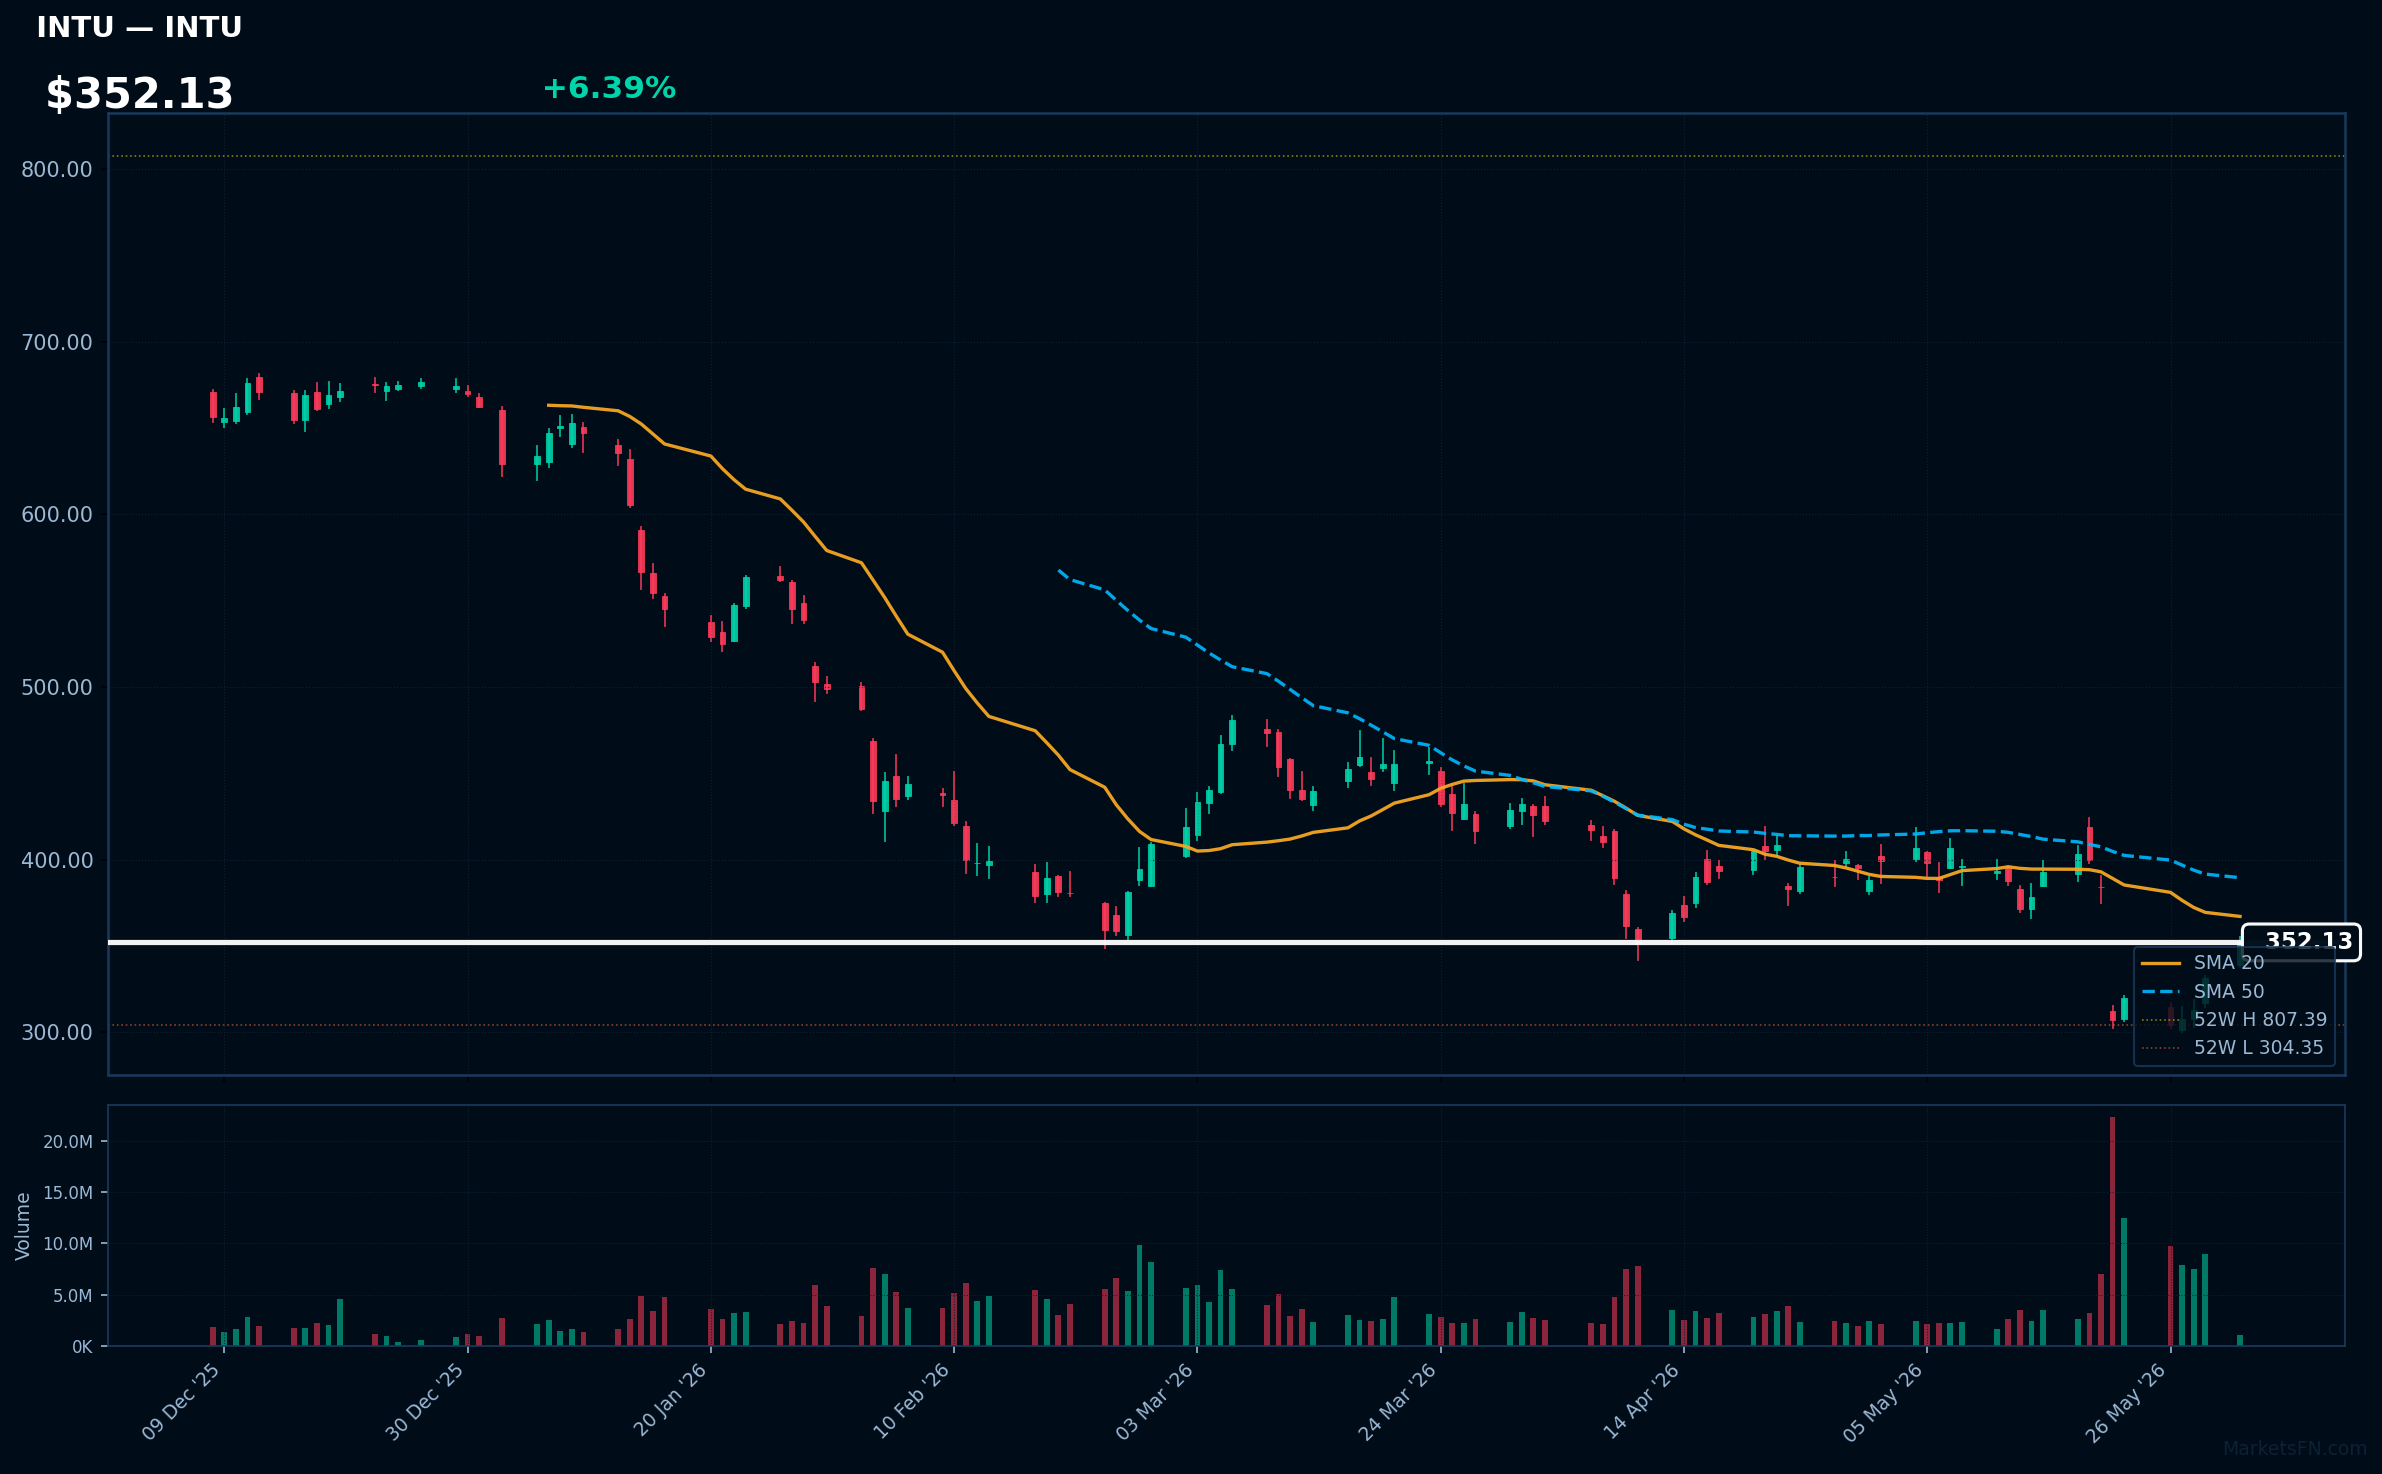
INTU | Intuit Inc | Technology | Price: $352.71 | Day: +6.39% | 1W: +10.06% | 1M: -9.36% | RSI: 46.3 | vs MA200: -35.7% | Trend: Below MA20, MA50, MA200
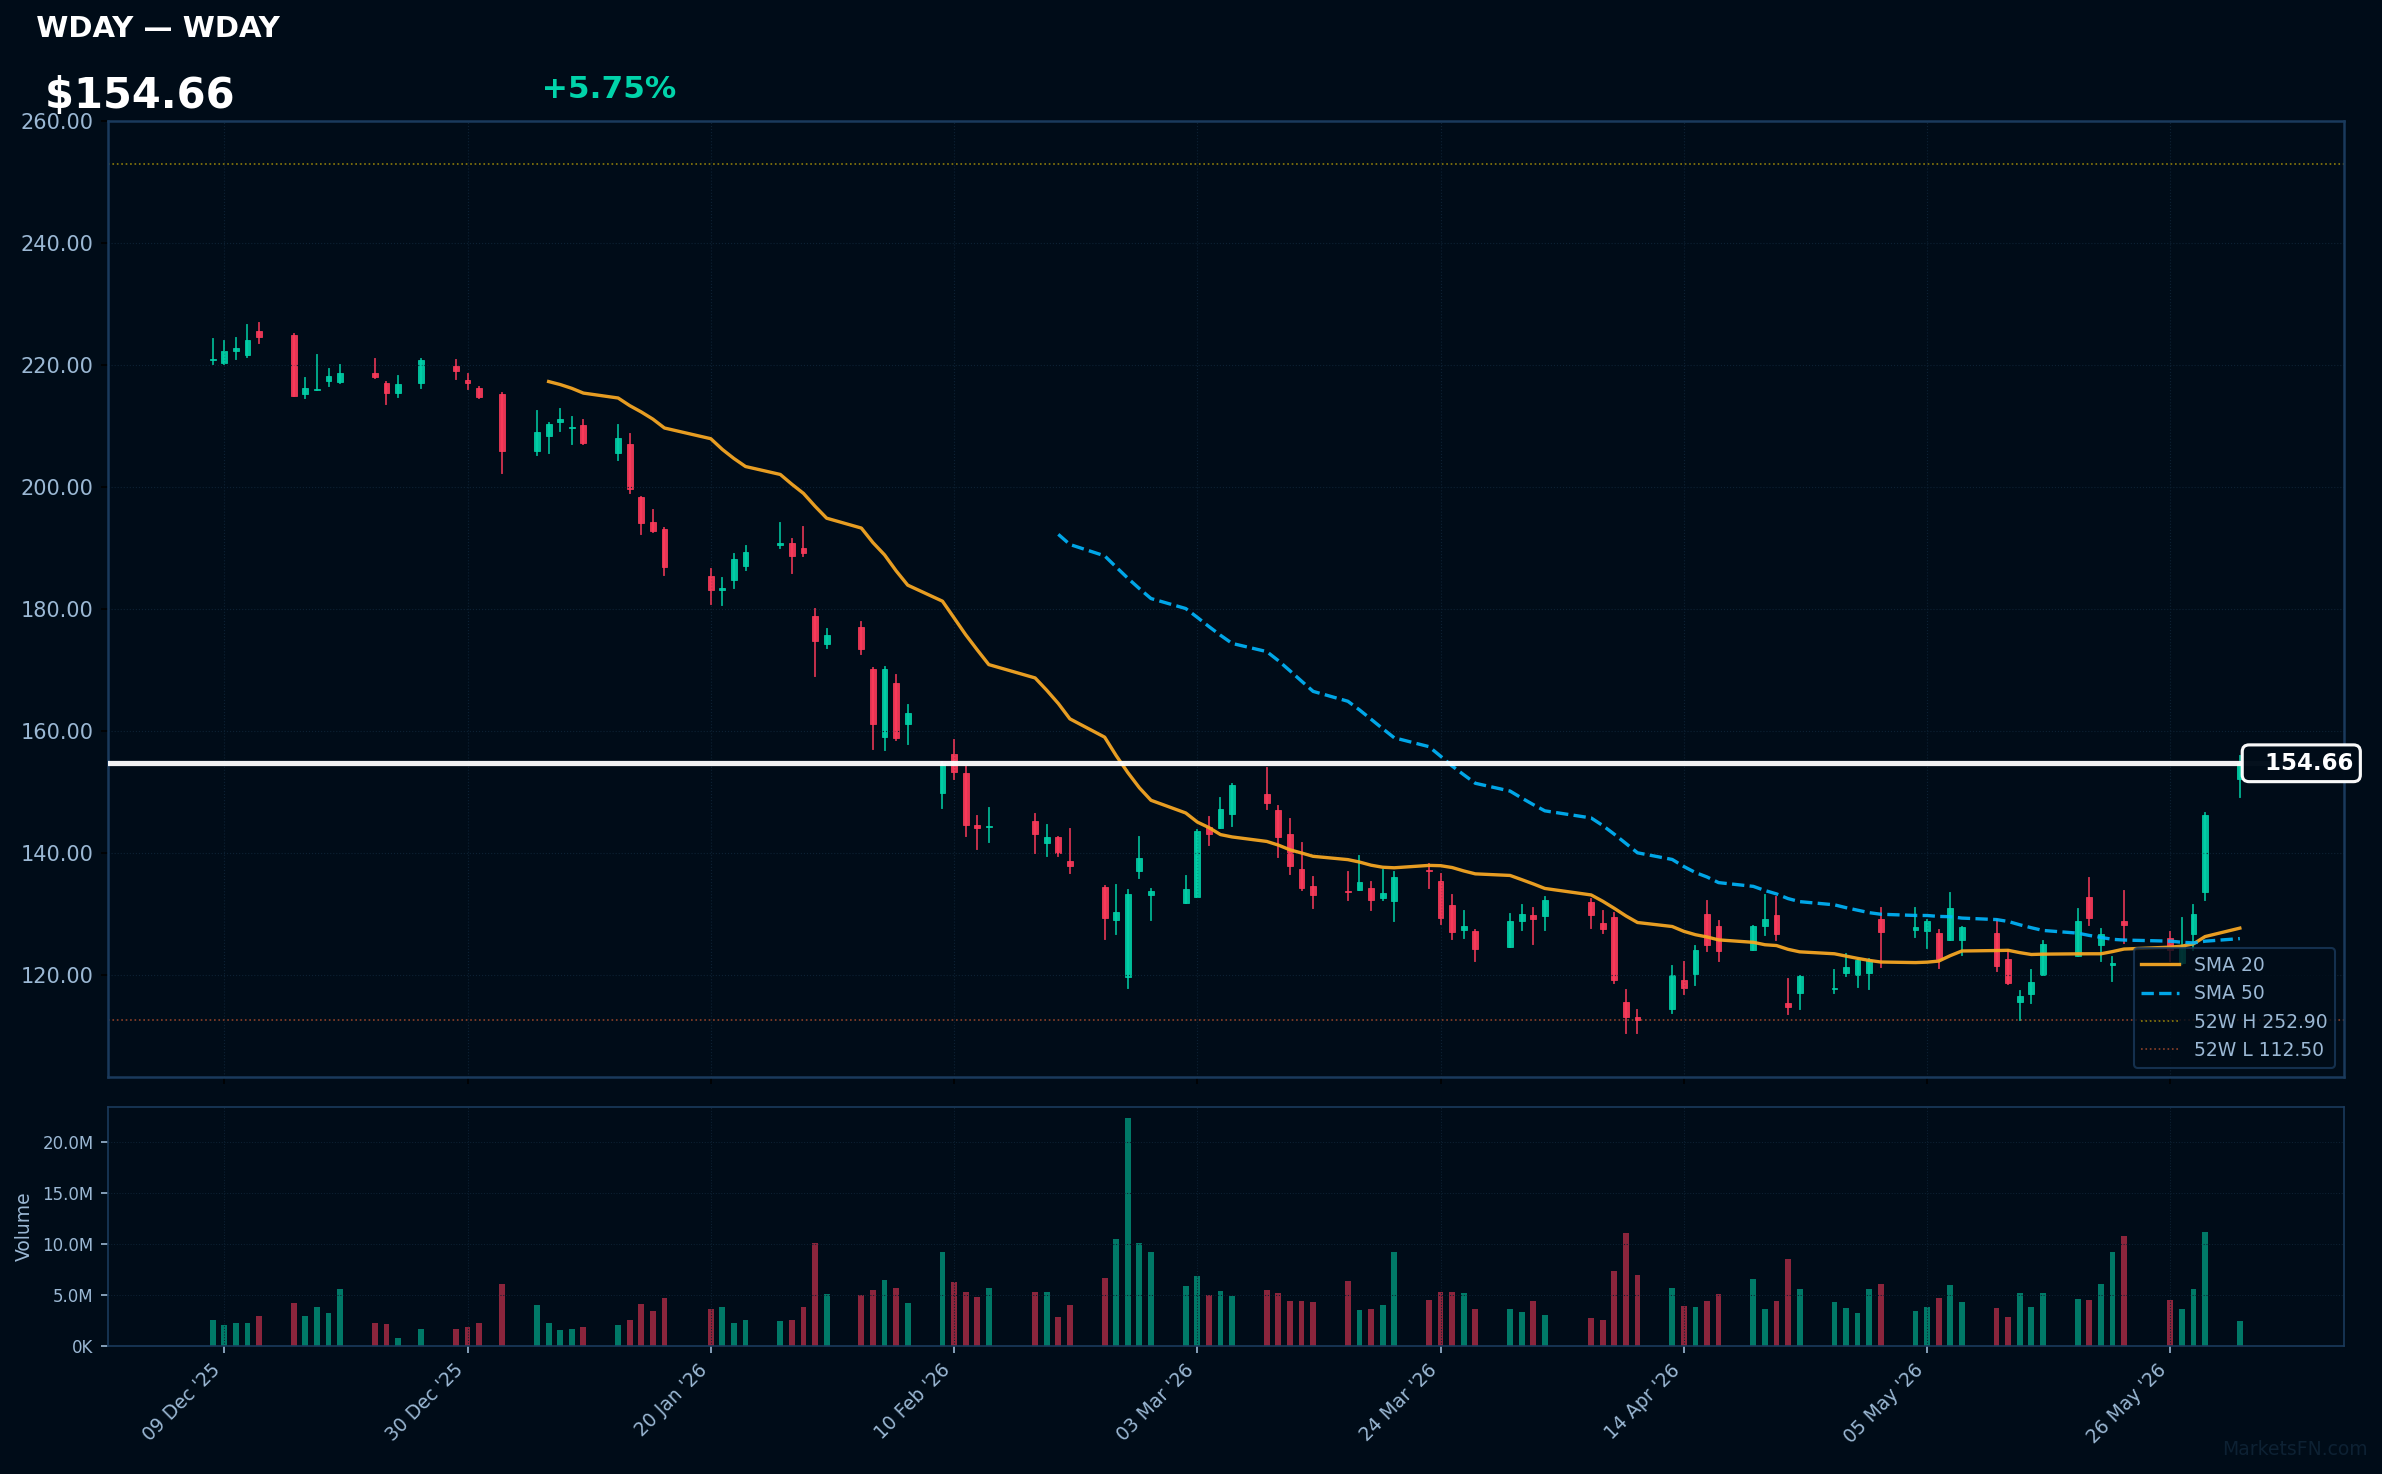
WDAY | Workday Inc | Technology | Price: $154.59 | Day: +5.75% | 1W: +20.70% | 1M: +26.36% | RSI: 70.6 | vs MA200: -16.7% | Trend: Above MA20, MA50 · Below MA200
Recent headlines (last 12h)
- Software stocks surge as Nvidias Huang dismisses AI disruption fears
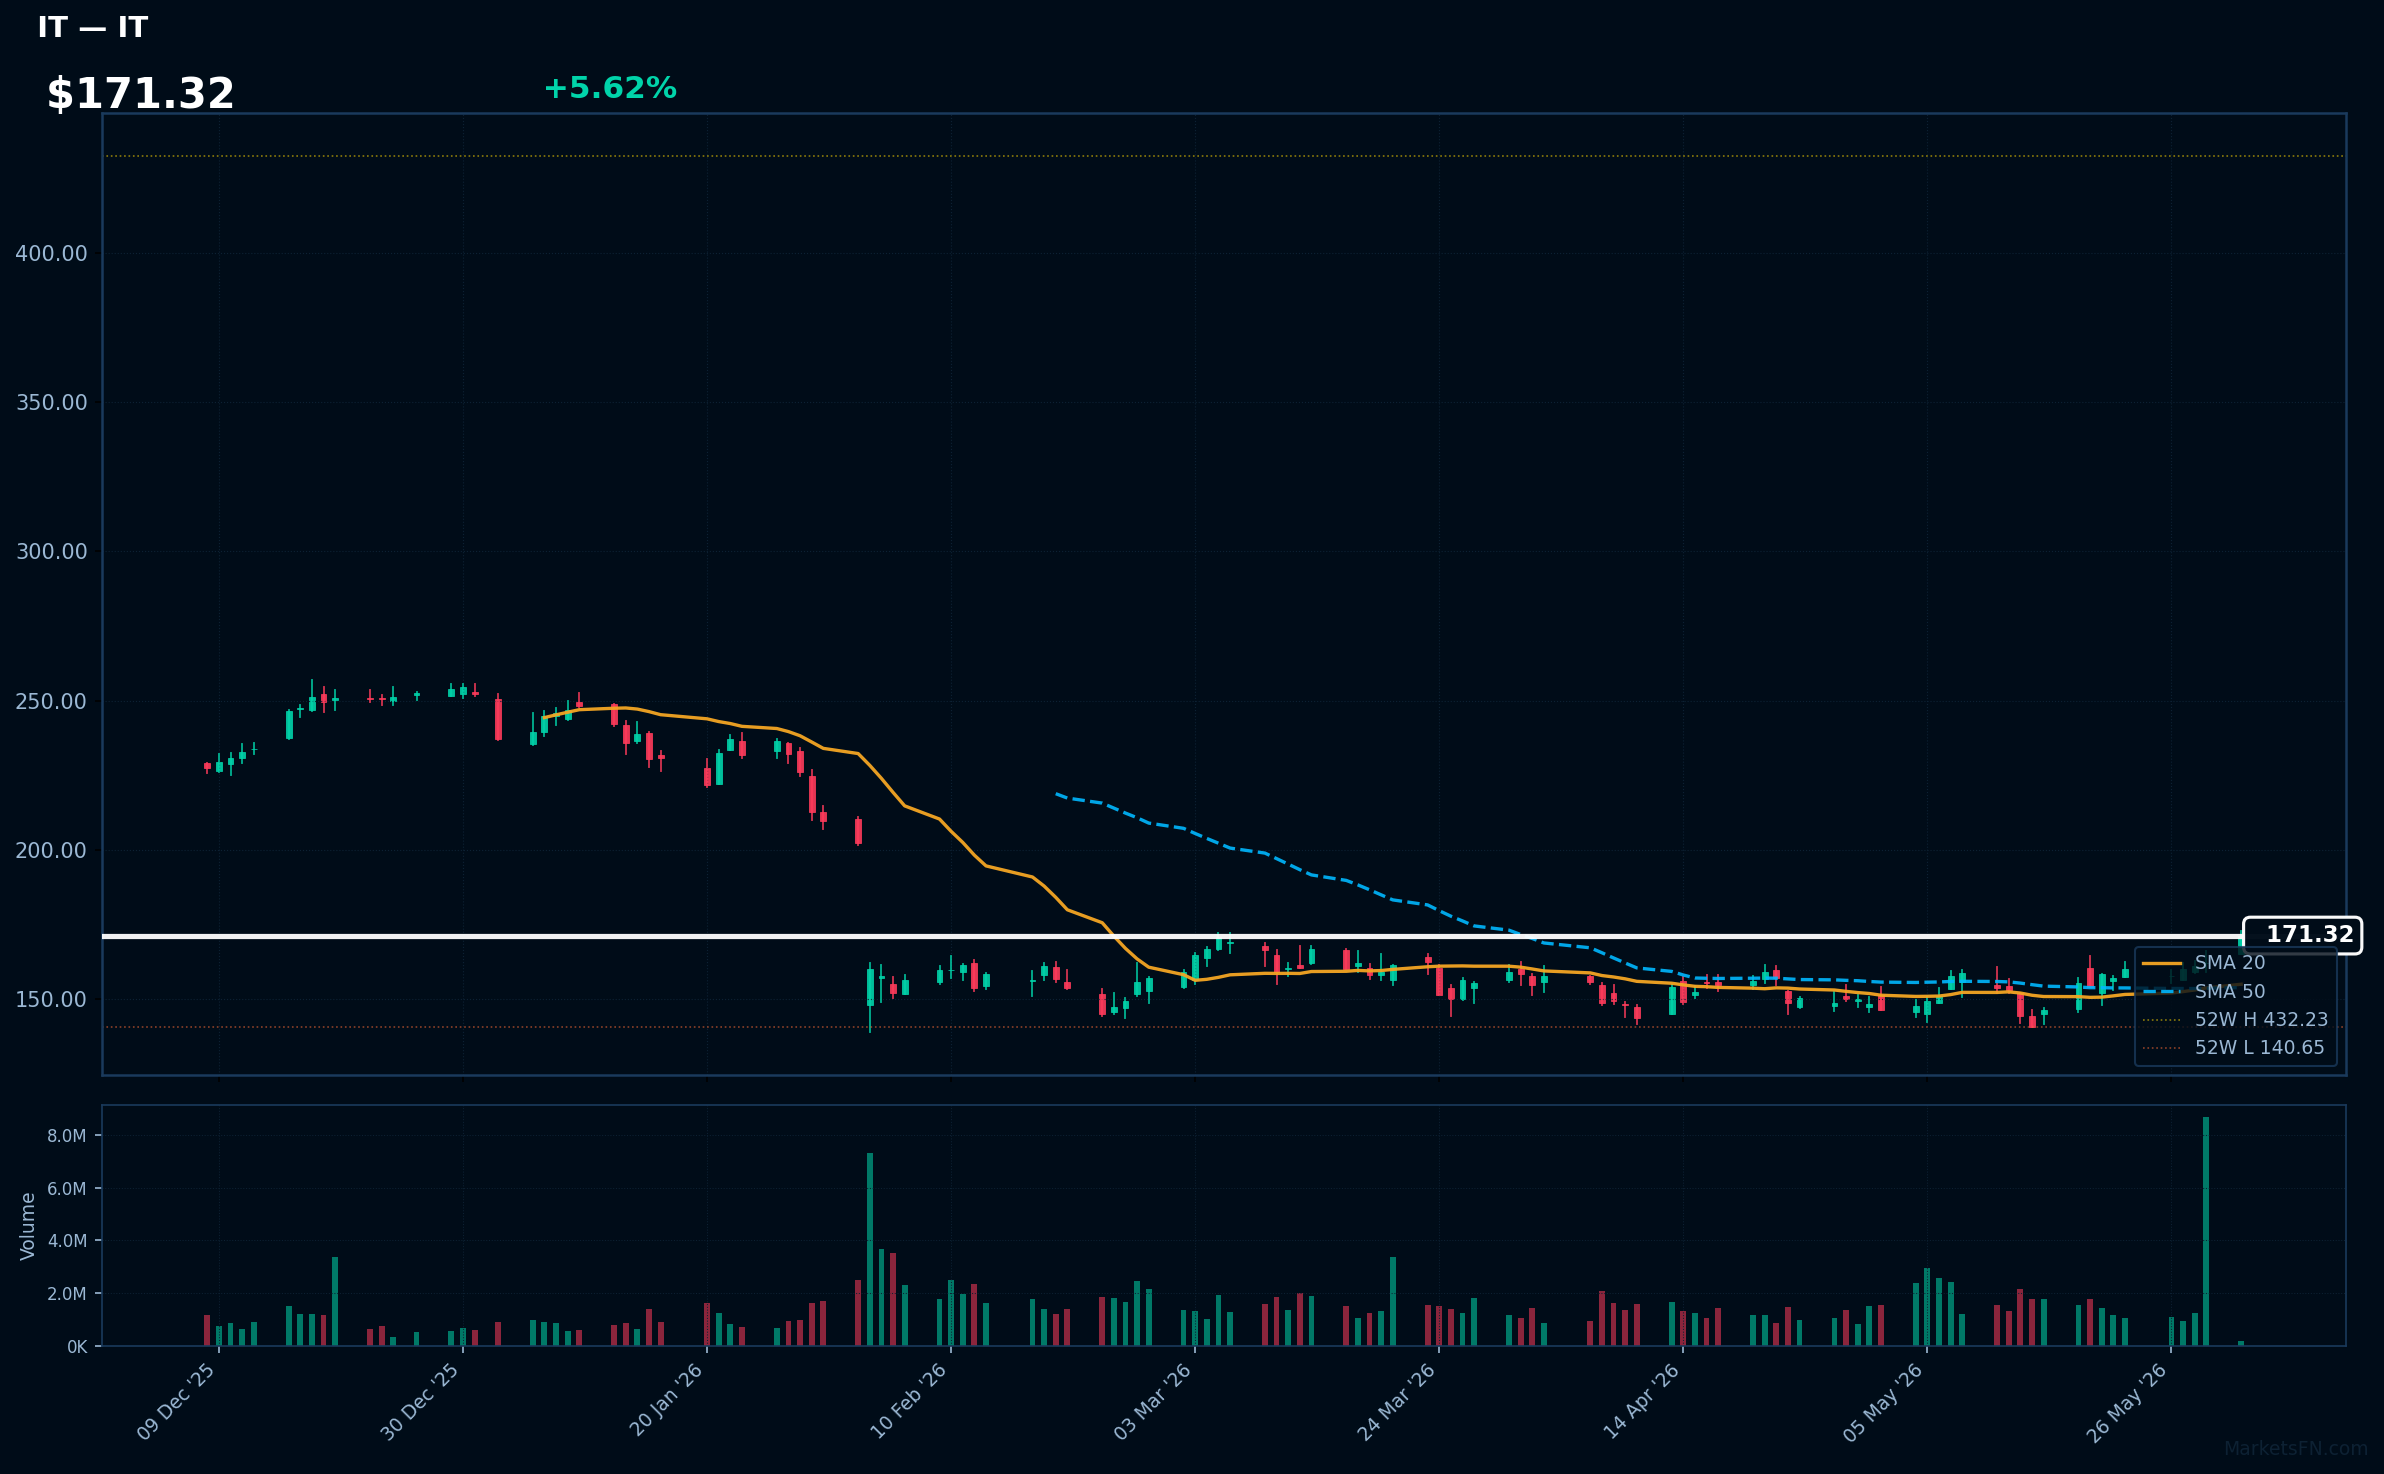
IT | Gartner, Inc | Technology | Price: $171.32 | Day: +5.62% | 1W: +7.07% | 1M: +15.37% | RSI: 66.9 | vs MA200: -17.0% | Trend: Above MA20, MA50 · Below MA200
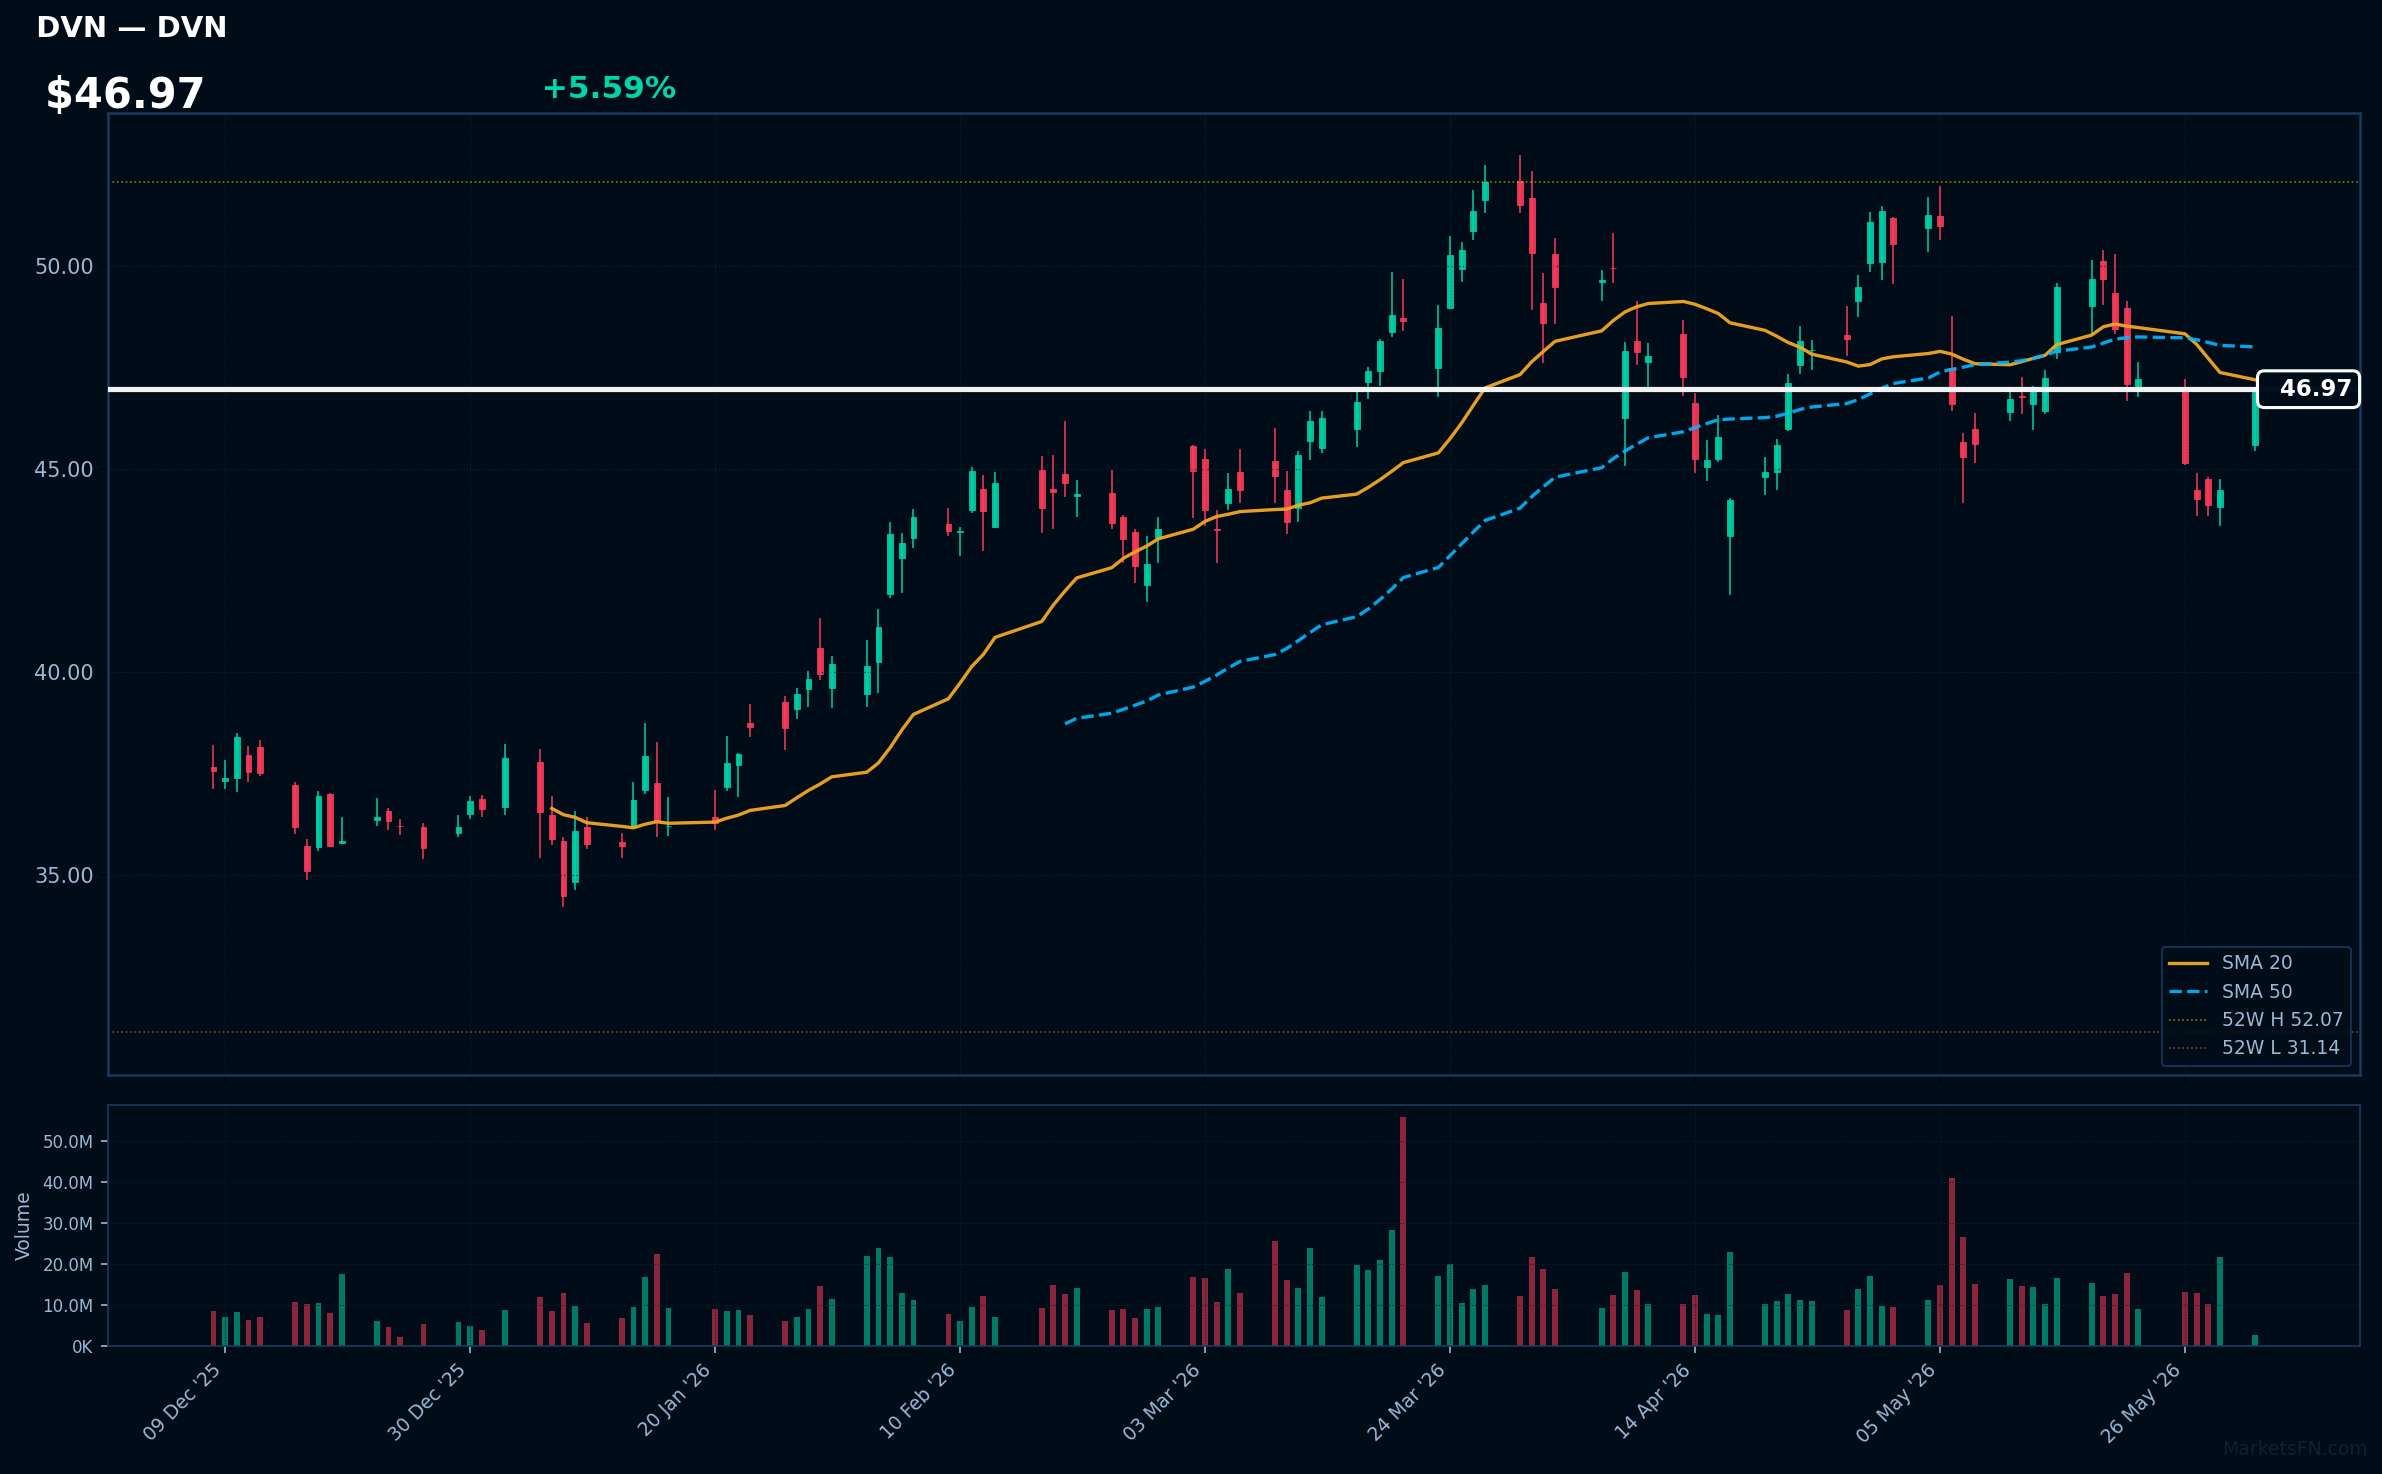
DVN | Devon Energy Corp | Energy | Price: $46.97 | Day: +5.59% | 1W: -0.53% | 1M: -8.57% | RSI: 49.6 | vs MA200: +17.4% | Trend: Above MA200 · Below MA20, MA50
Recent headlines (last 12h)
- Stone Ridge tables $8bn bid for Devon Energys Marcellus assets
Top 10 Losers
Today's weakest S&P 500 performers. Sector drag: Technology (5), Financial (2), Healthcare (1), Utilities (1), Industrials (1).
| Ticker | Company | Sector | Price | Day % | 1W % | 1M % | RSI | vs MA200 | Trend |
|---|---|---|---|---|---|---|---|---|---|
| TXN | Texas Instruments Inc | Technology | $291.50 | -4.64% | -5.91% | +3.51% | 51.4 | +43.0% | Above MA50, MA200 · Below MA20 |
| AMD | Advanced Micro Devices Inc | Technology | $490.71 | -4.92% | +5.02% | +38.51% | 67.3 | +105.2% | Above MA20, MA50, MA200 |
| COIN | Coinbase Global Inc | Financial | $179.27 | -5.16% | -3.04% | -4.47% | 43.8 | -27.6% | Below MA20, MA50, MA200 |
| CBOE | Cboe Global Markets Inc | Financial | $314.05 | -5.85% | -12.00% | +4.79% | 37.0 | +15.4% | Above MA200 · Below MA20, MA50 |
| MRNA | Moderna Inc | Healthcare | $44.38 | -5.95% | -5.38% | -3.44% | 37.2 | +18.1% | Above MA200 · Below MA20, MA50 |
| INTC | Intel Corp | Technology | $107.66 | -6.12% | -10.05% | +14.10% | 52.1 | +117.1% | Above MA50, MA200 · Below MA20 |
| CEG | Constellation Energy Corporation | Utilities | $269.42 | -6.37% | -8.39% | -13.93% | 40.5 | -16.6% | Below MA20, MA50, MA200 |
| ENPH | Enphase Energy Inc | Technology | $63.68 | -6.85% | -0.61% | +93.08% | 67.8 | +68.0% | Above MA20, MA50, MA200 |
| QCOM | Qualcomm, Inc | Technology | $229.74 | -8.48% | -3.58% | +27.87% | 59.7 | +41.1% | Above MA20, MA50, MA200 |
| FDX | Fedex Corp | Industrials | $333.06 | -19.11% | -15.48% | -17.39% | 32.7 | +8.2% | Above MA200 · Below MA20, MA50 |
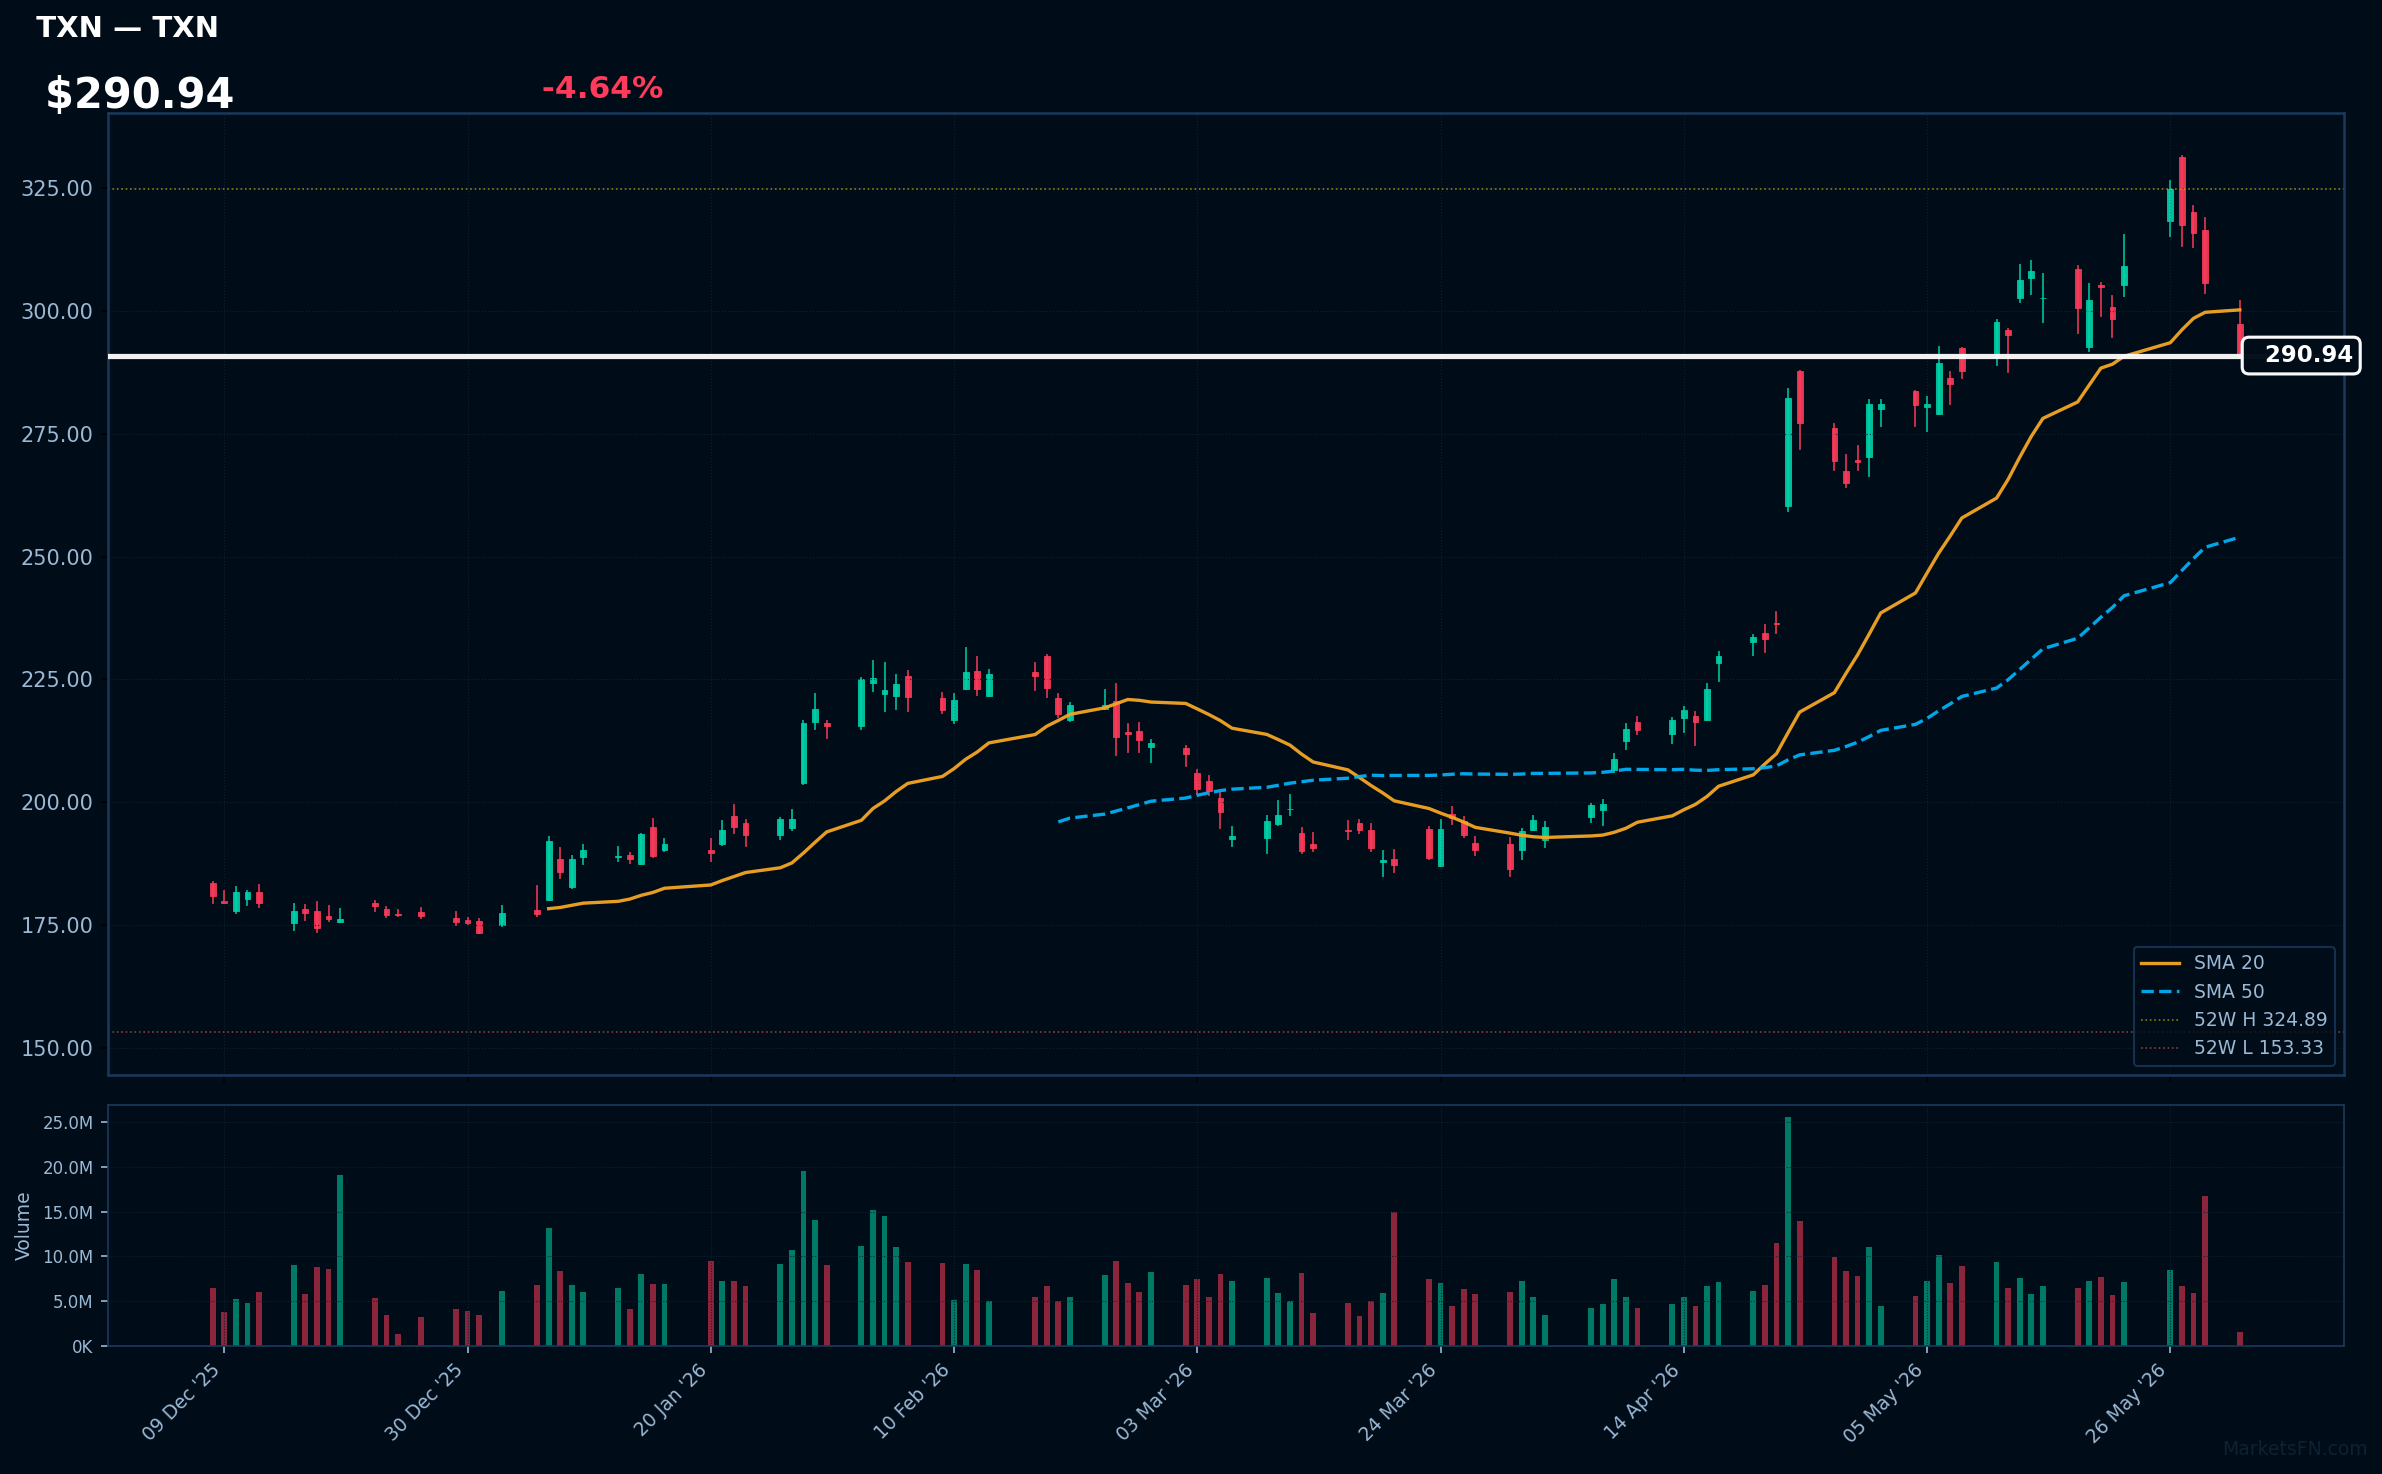
TXN | Texas Instruments Inc | Technology | Price: $291.50 | Day: -4.64% | 1W: -5.91% | 1M: +3.51% | RSI: 51.4 | vs MA200: +43.0% | Trend: Above MA50, MA200 · Below MA20
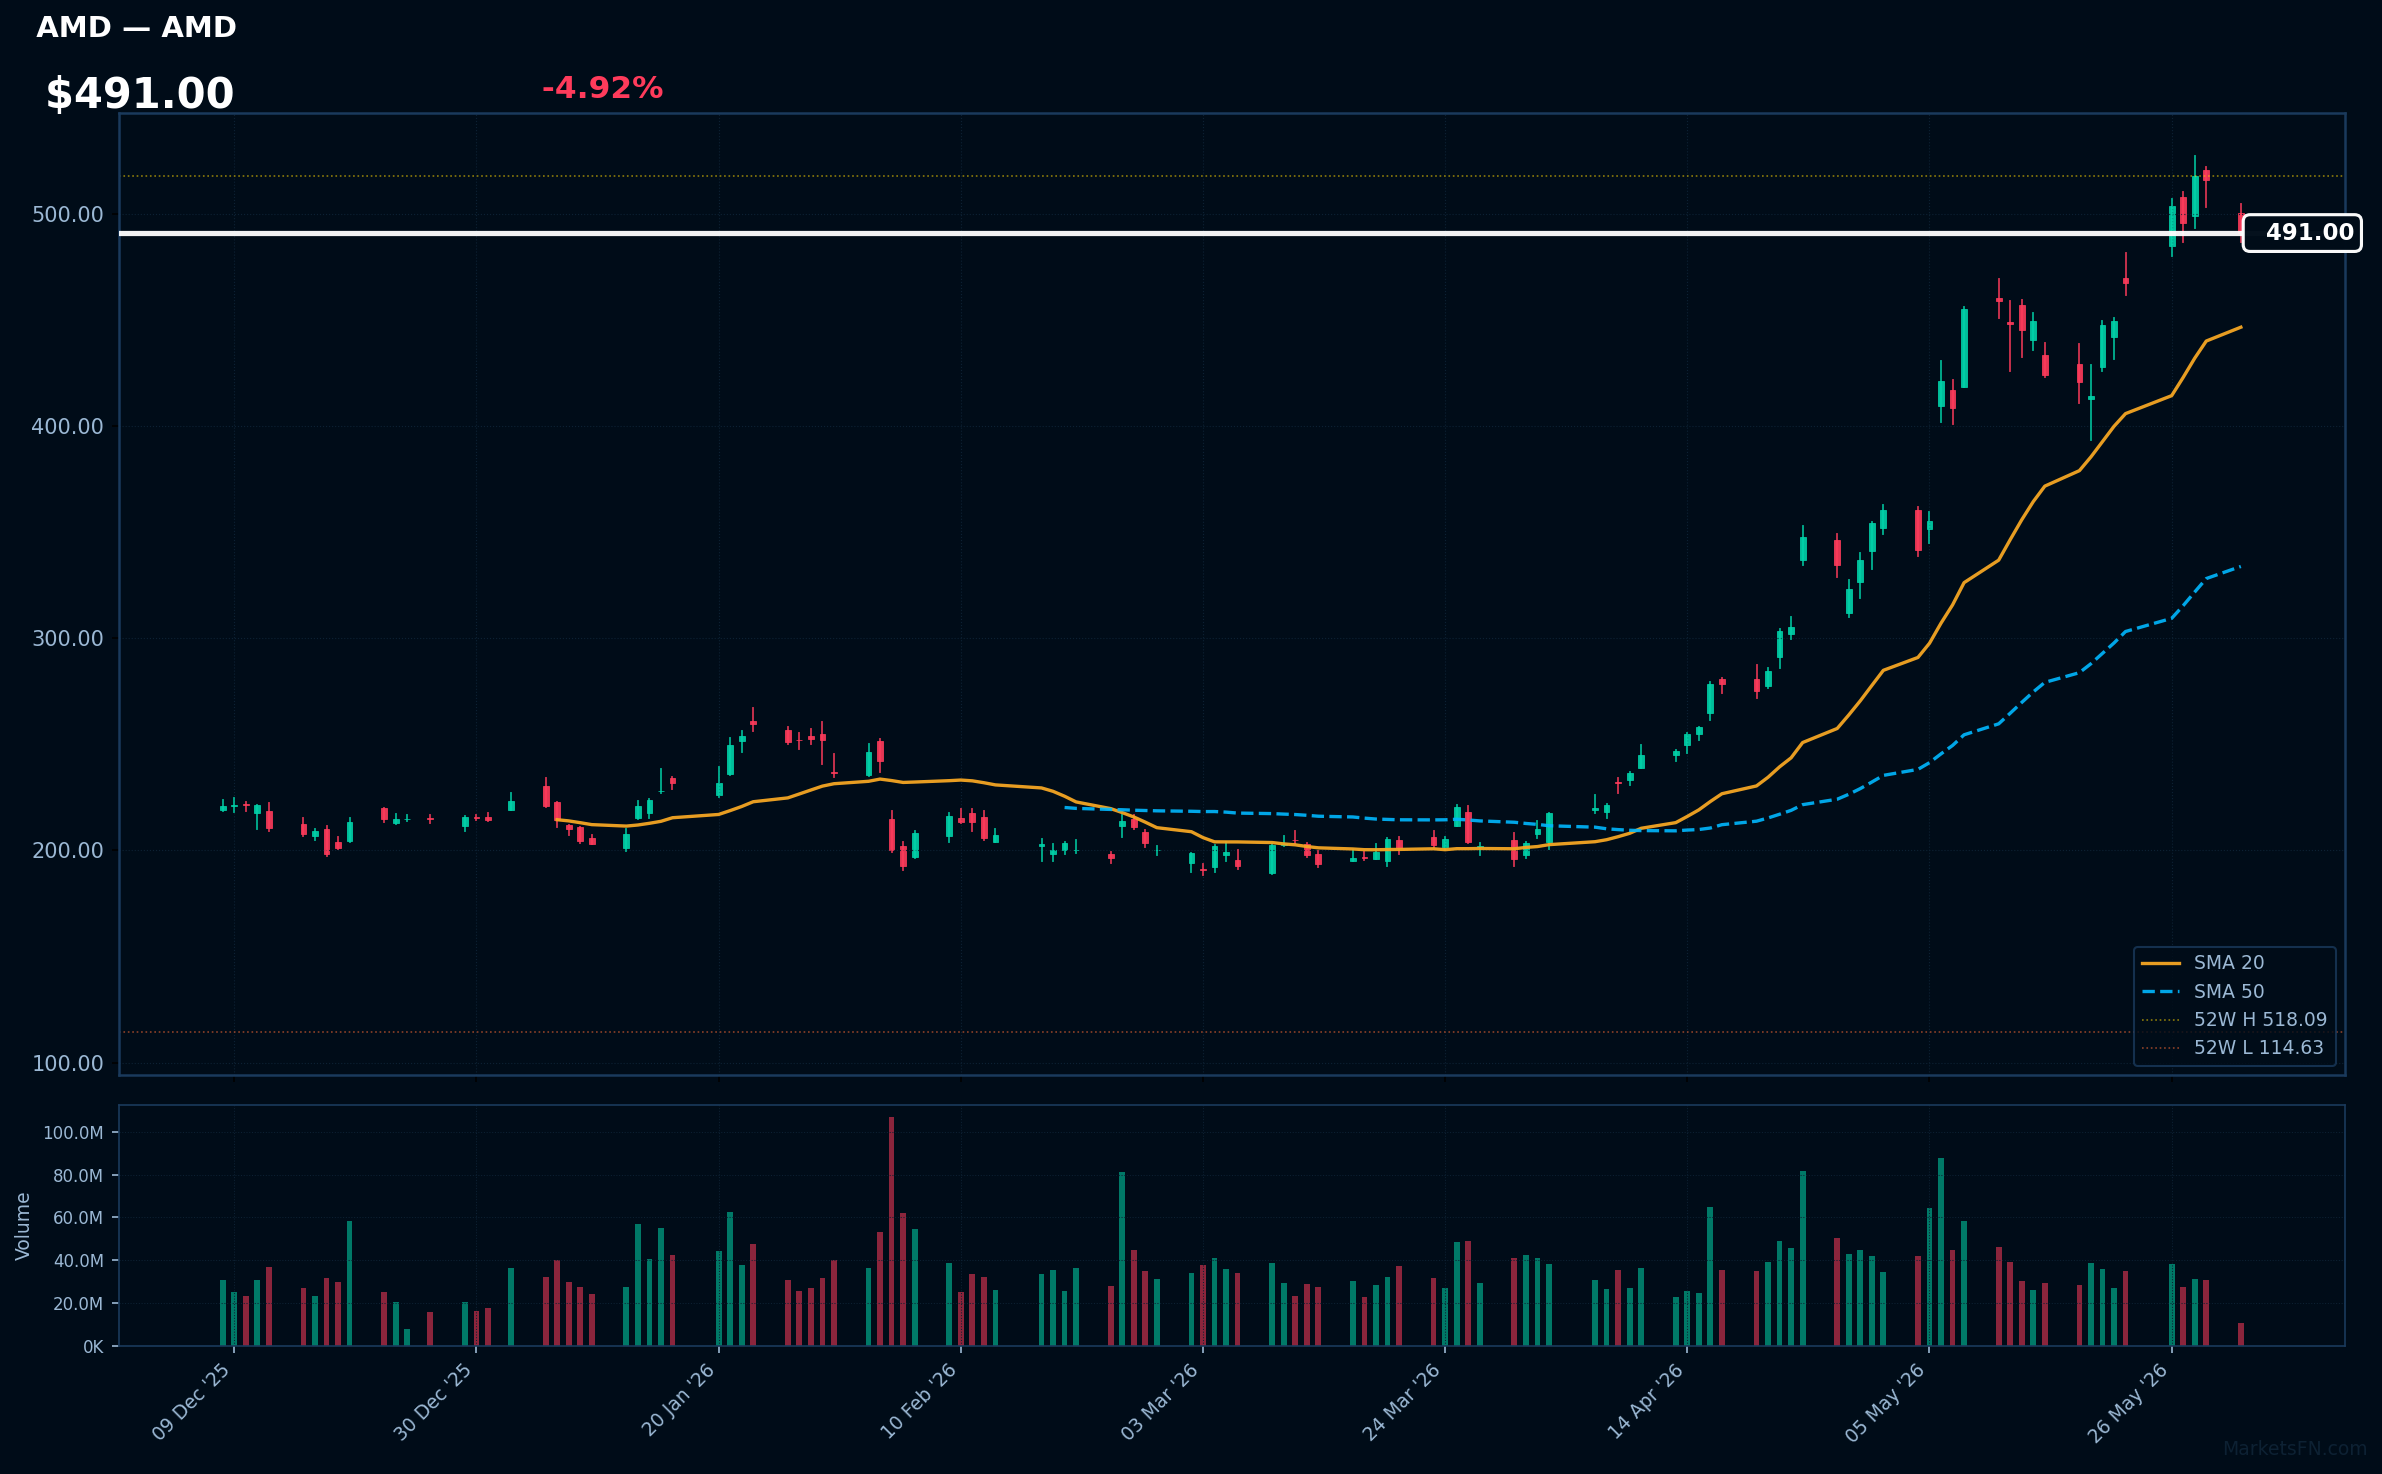
AMD | Advanced Micro Devices Inc | Technology | Price: $490.71 | Day: -4.92% | 1W: +5.02% | 1M: +38.51% | RSI: 67.3 | vs MA200: +105.2% | Trend: Above MA20, MA50, MA200
Recent headlines (last 12h)
- Nvidia Says Anthropic, OpenAI Among Users of New Vera Chip
- Stocks to Watch: Nvidia, Qualcomm, Taylor Morrison, MGM
- Nvidia RTX Spark Targets Intel and AMD PC Dominance
- Nvidia to enter personal computers with new chip reveals at Computex
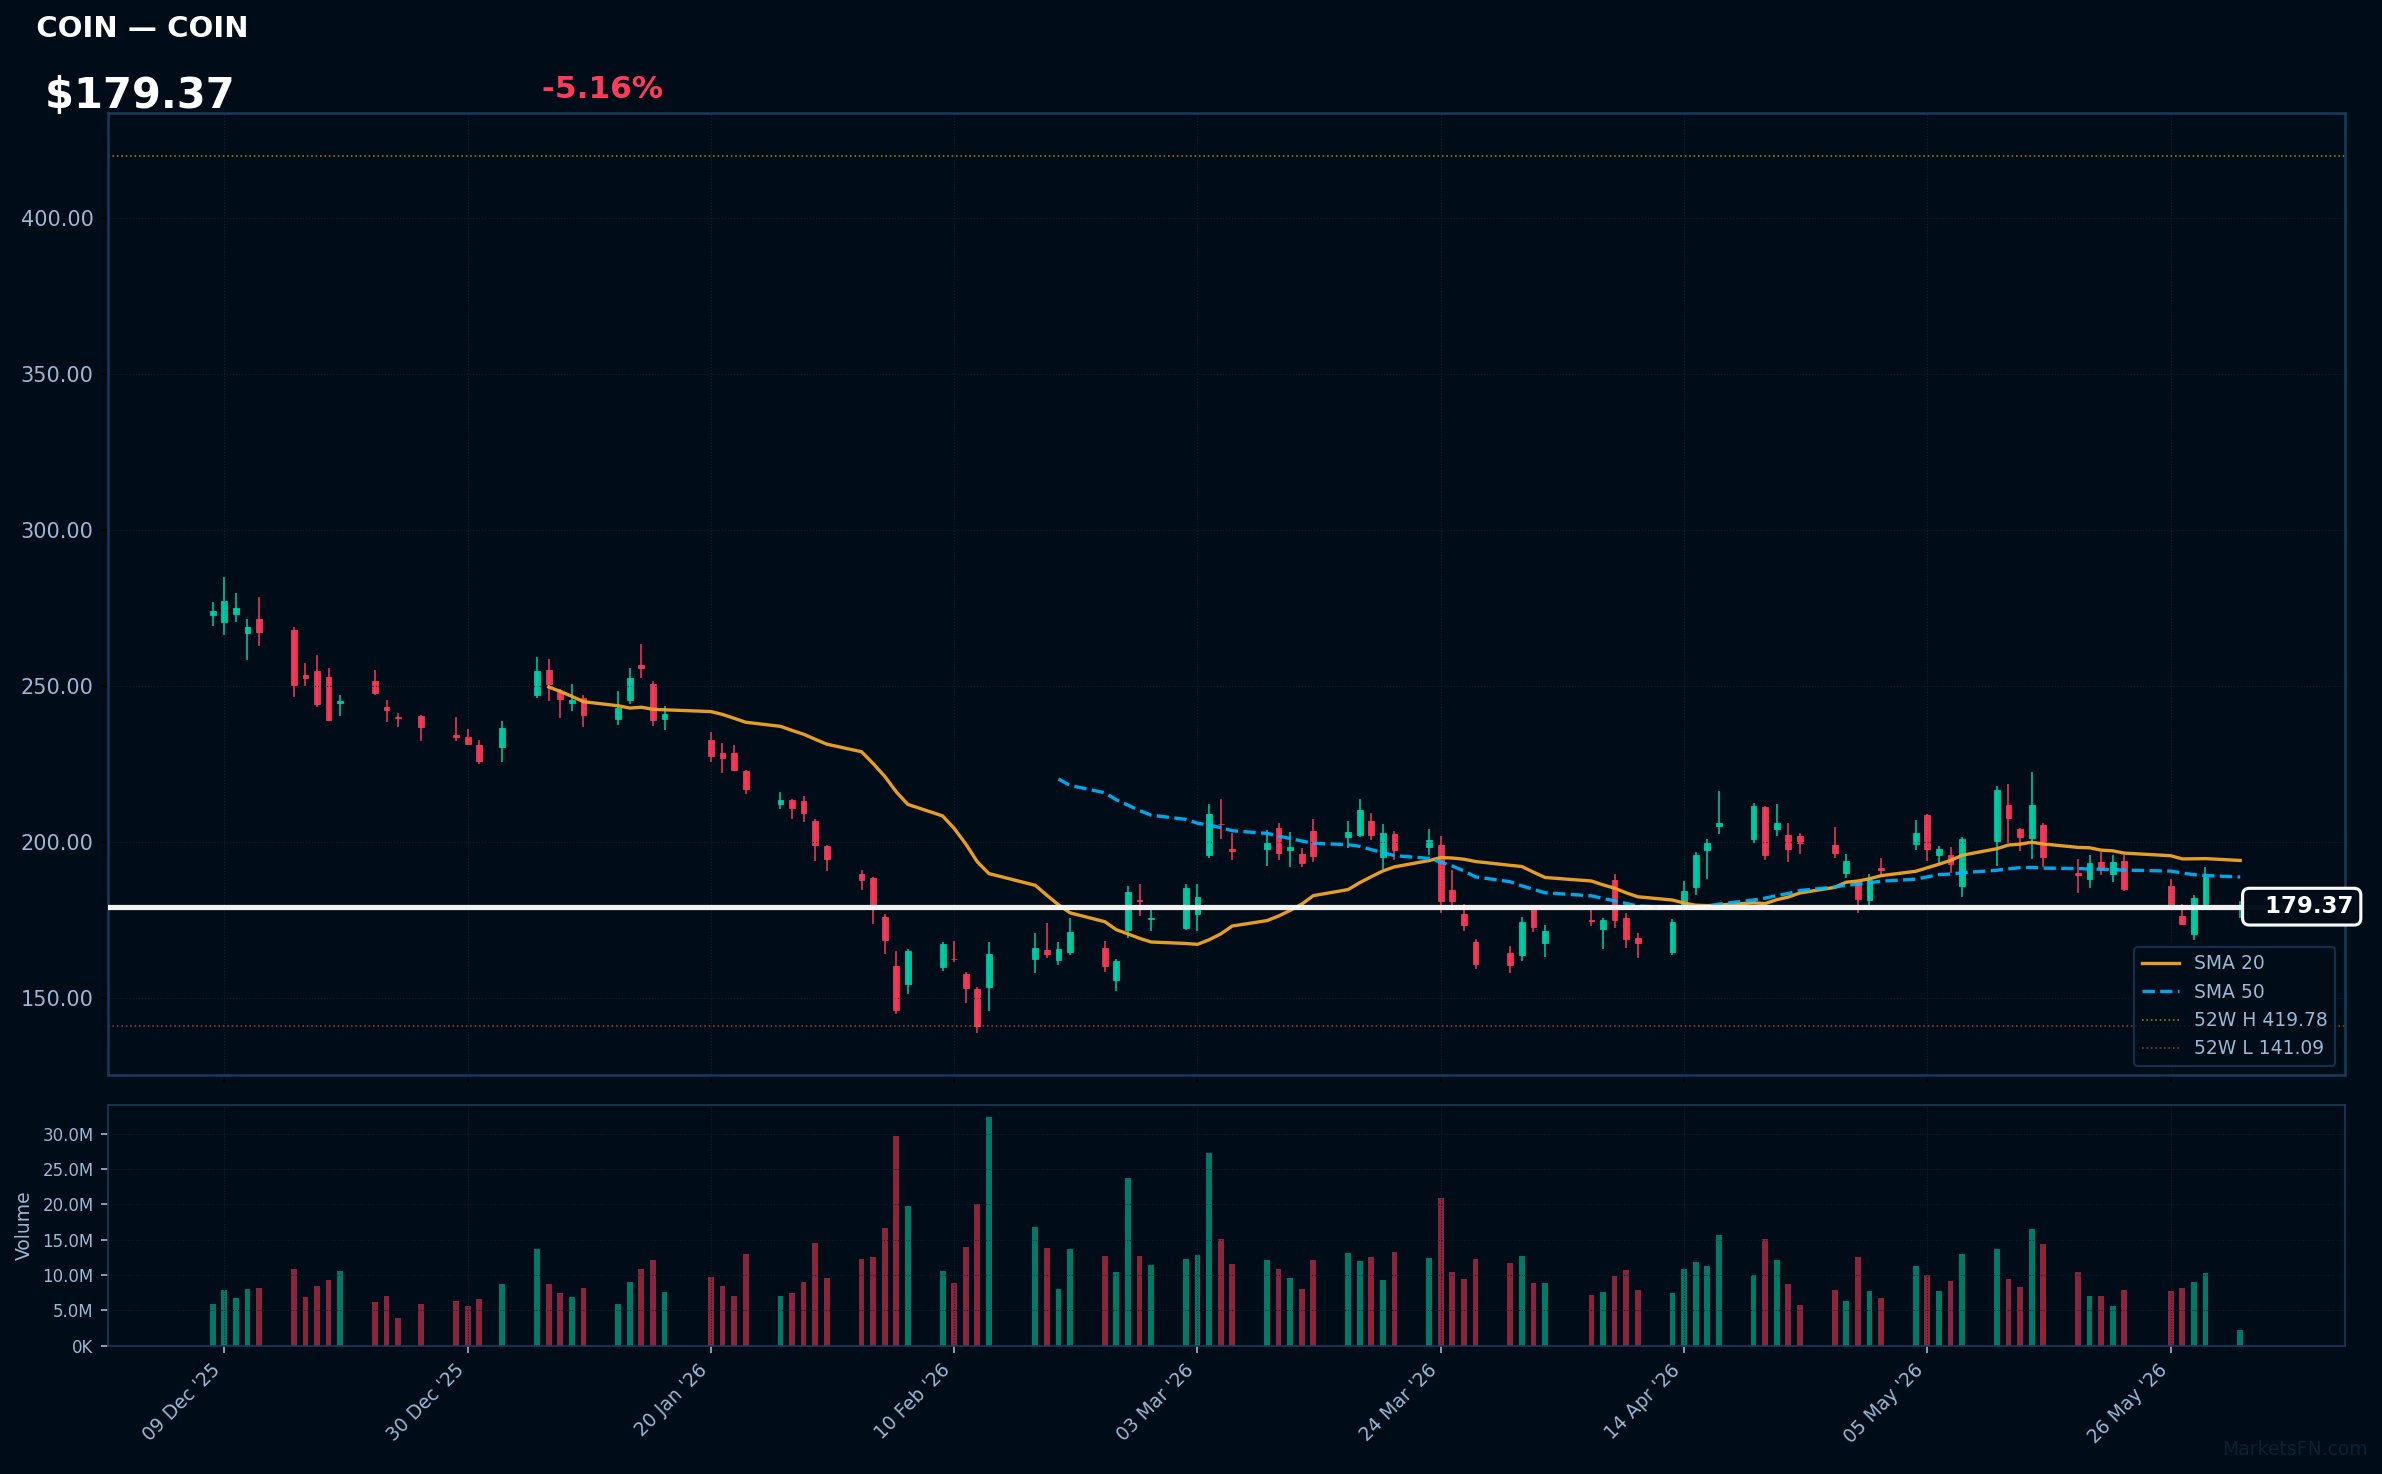
COIN | Coinbase Global Inc | Financial | Price: $179.27 | Day: -5.16% | 1W: -3.04% | 1M: -4.47% | RSI: 43.8 | vs MA200: -27.6% | Trend: Below MA20, MA50, MA200
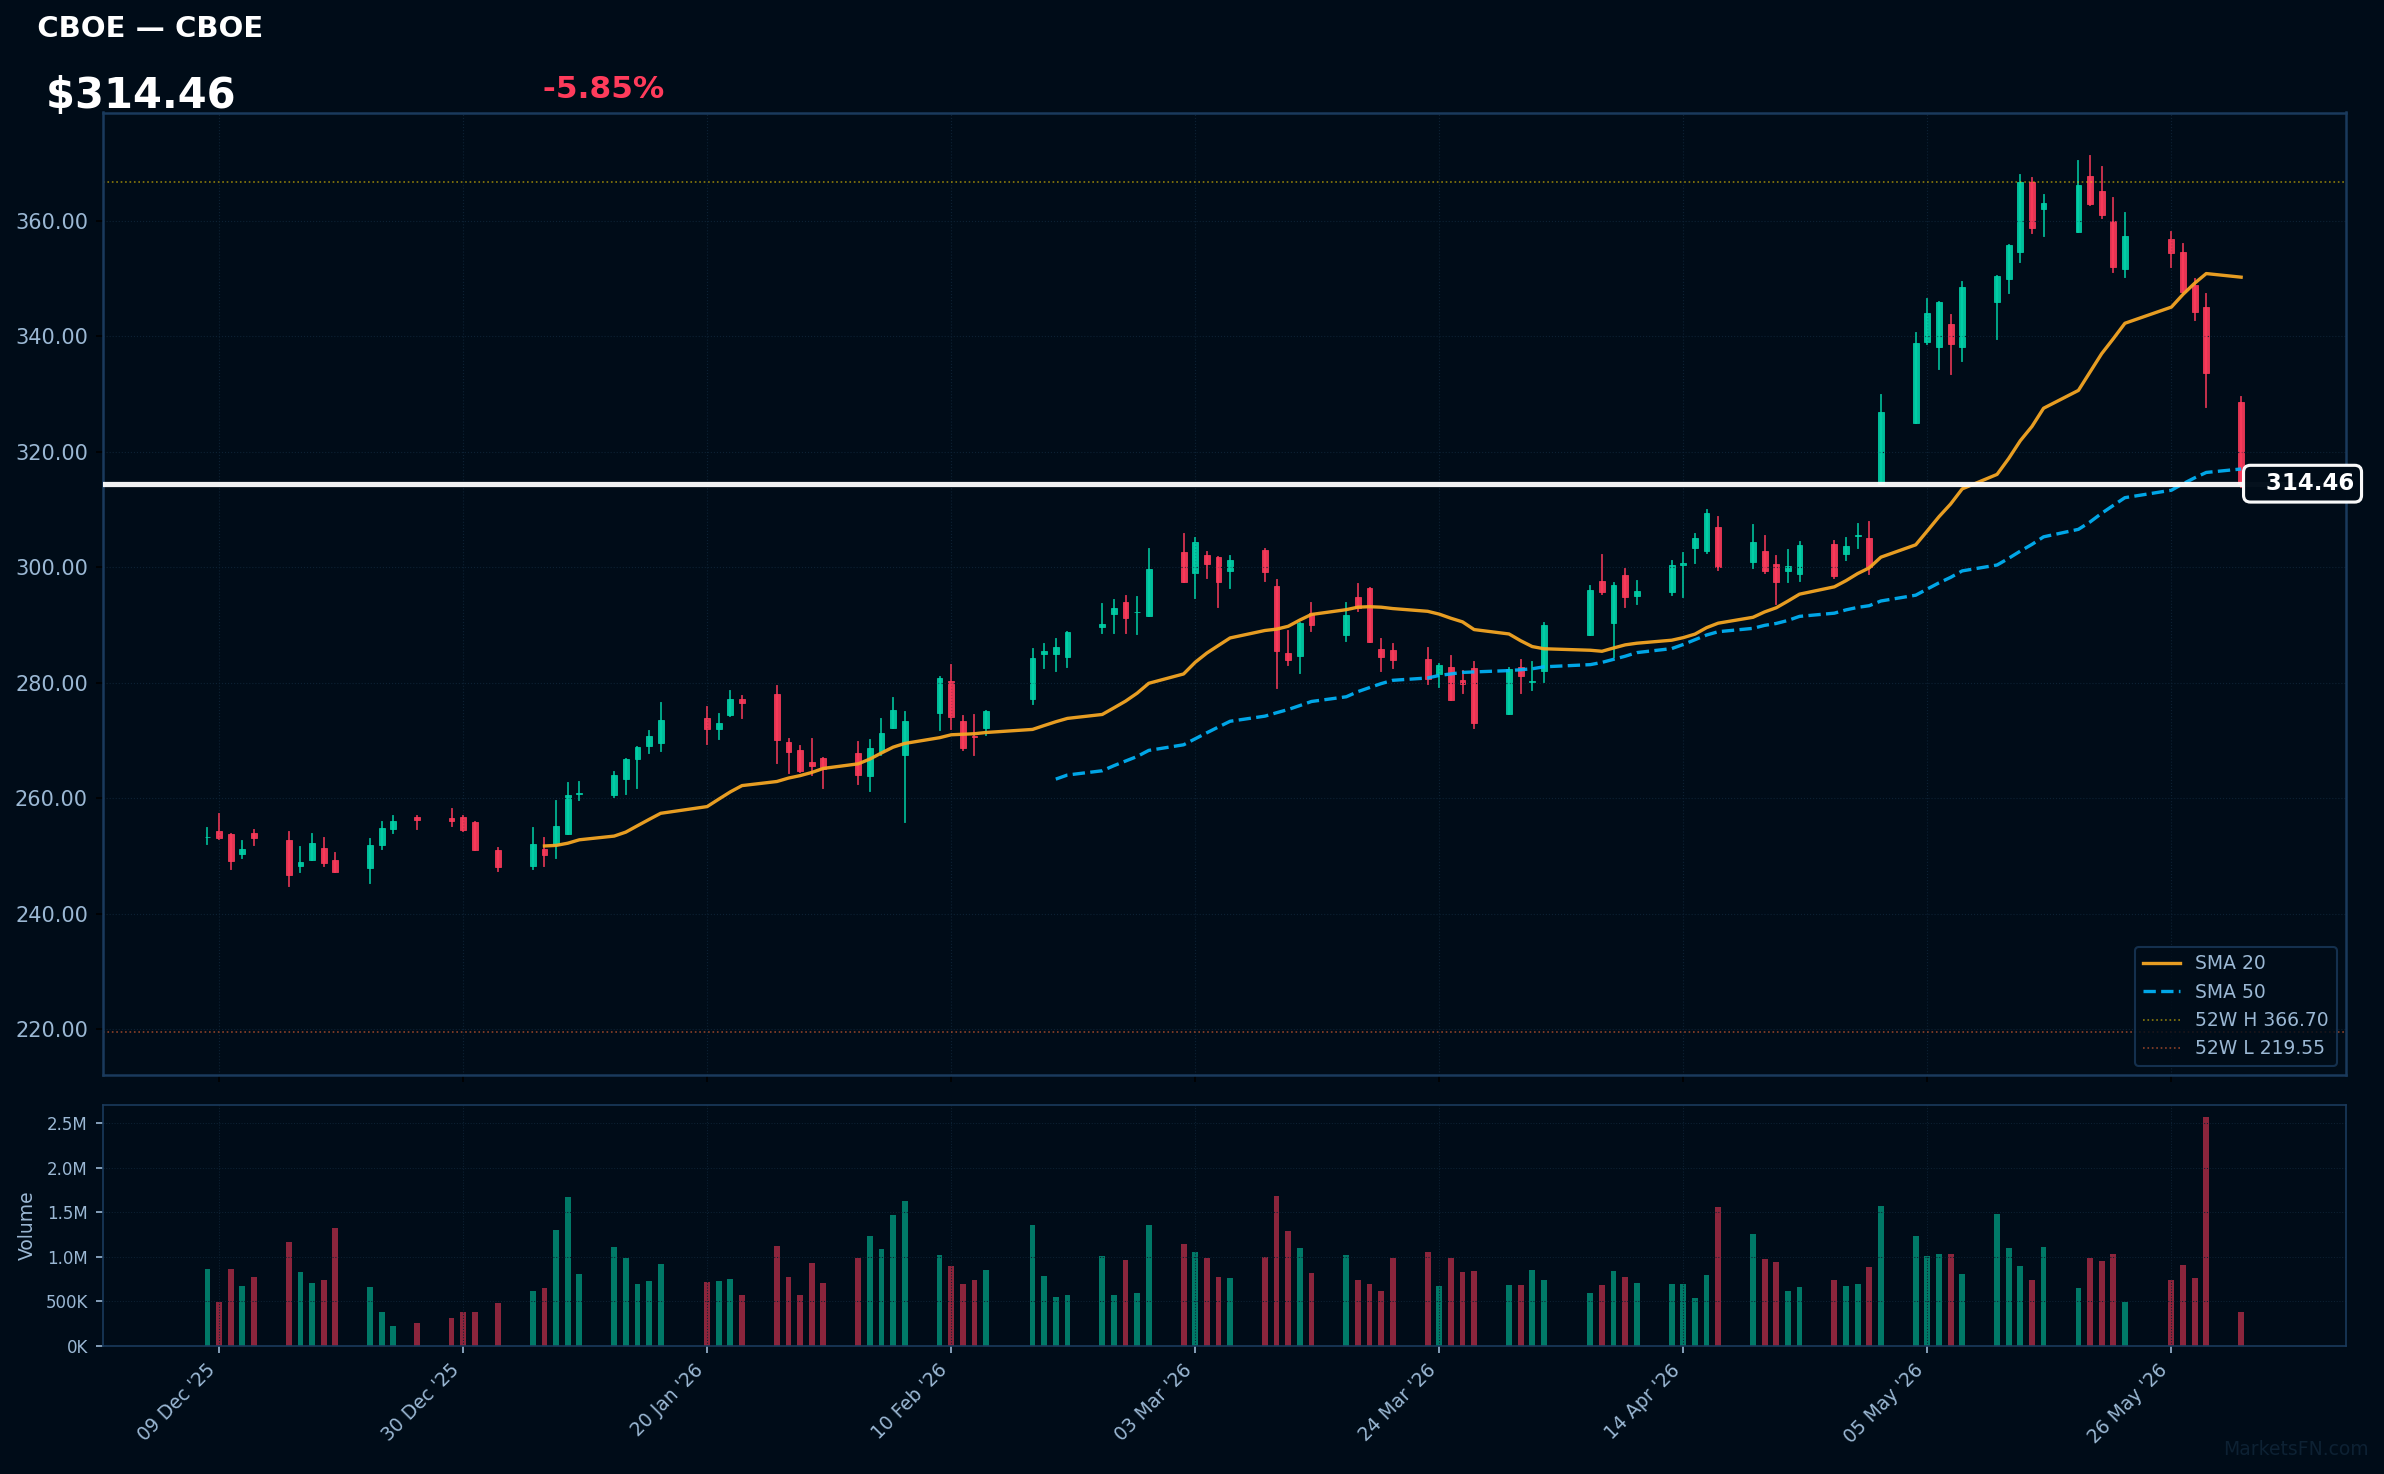
CBOE | Cboe Global Markets Inc | Financial | Price: $314.05 | Day: -5.85% | 1W: -12.00% | 1M: +4.79% | RSI: 37.0 | vs MA200: +15.4% | Trend: Above MA200 · Below MA20, MA50
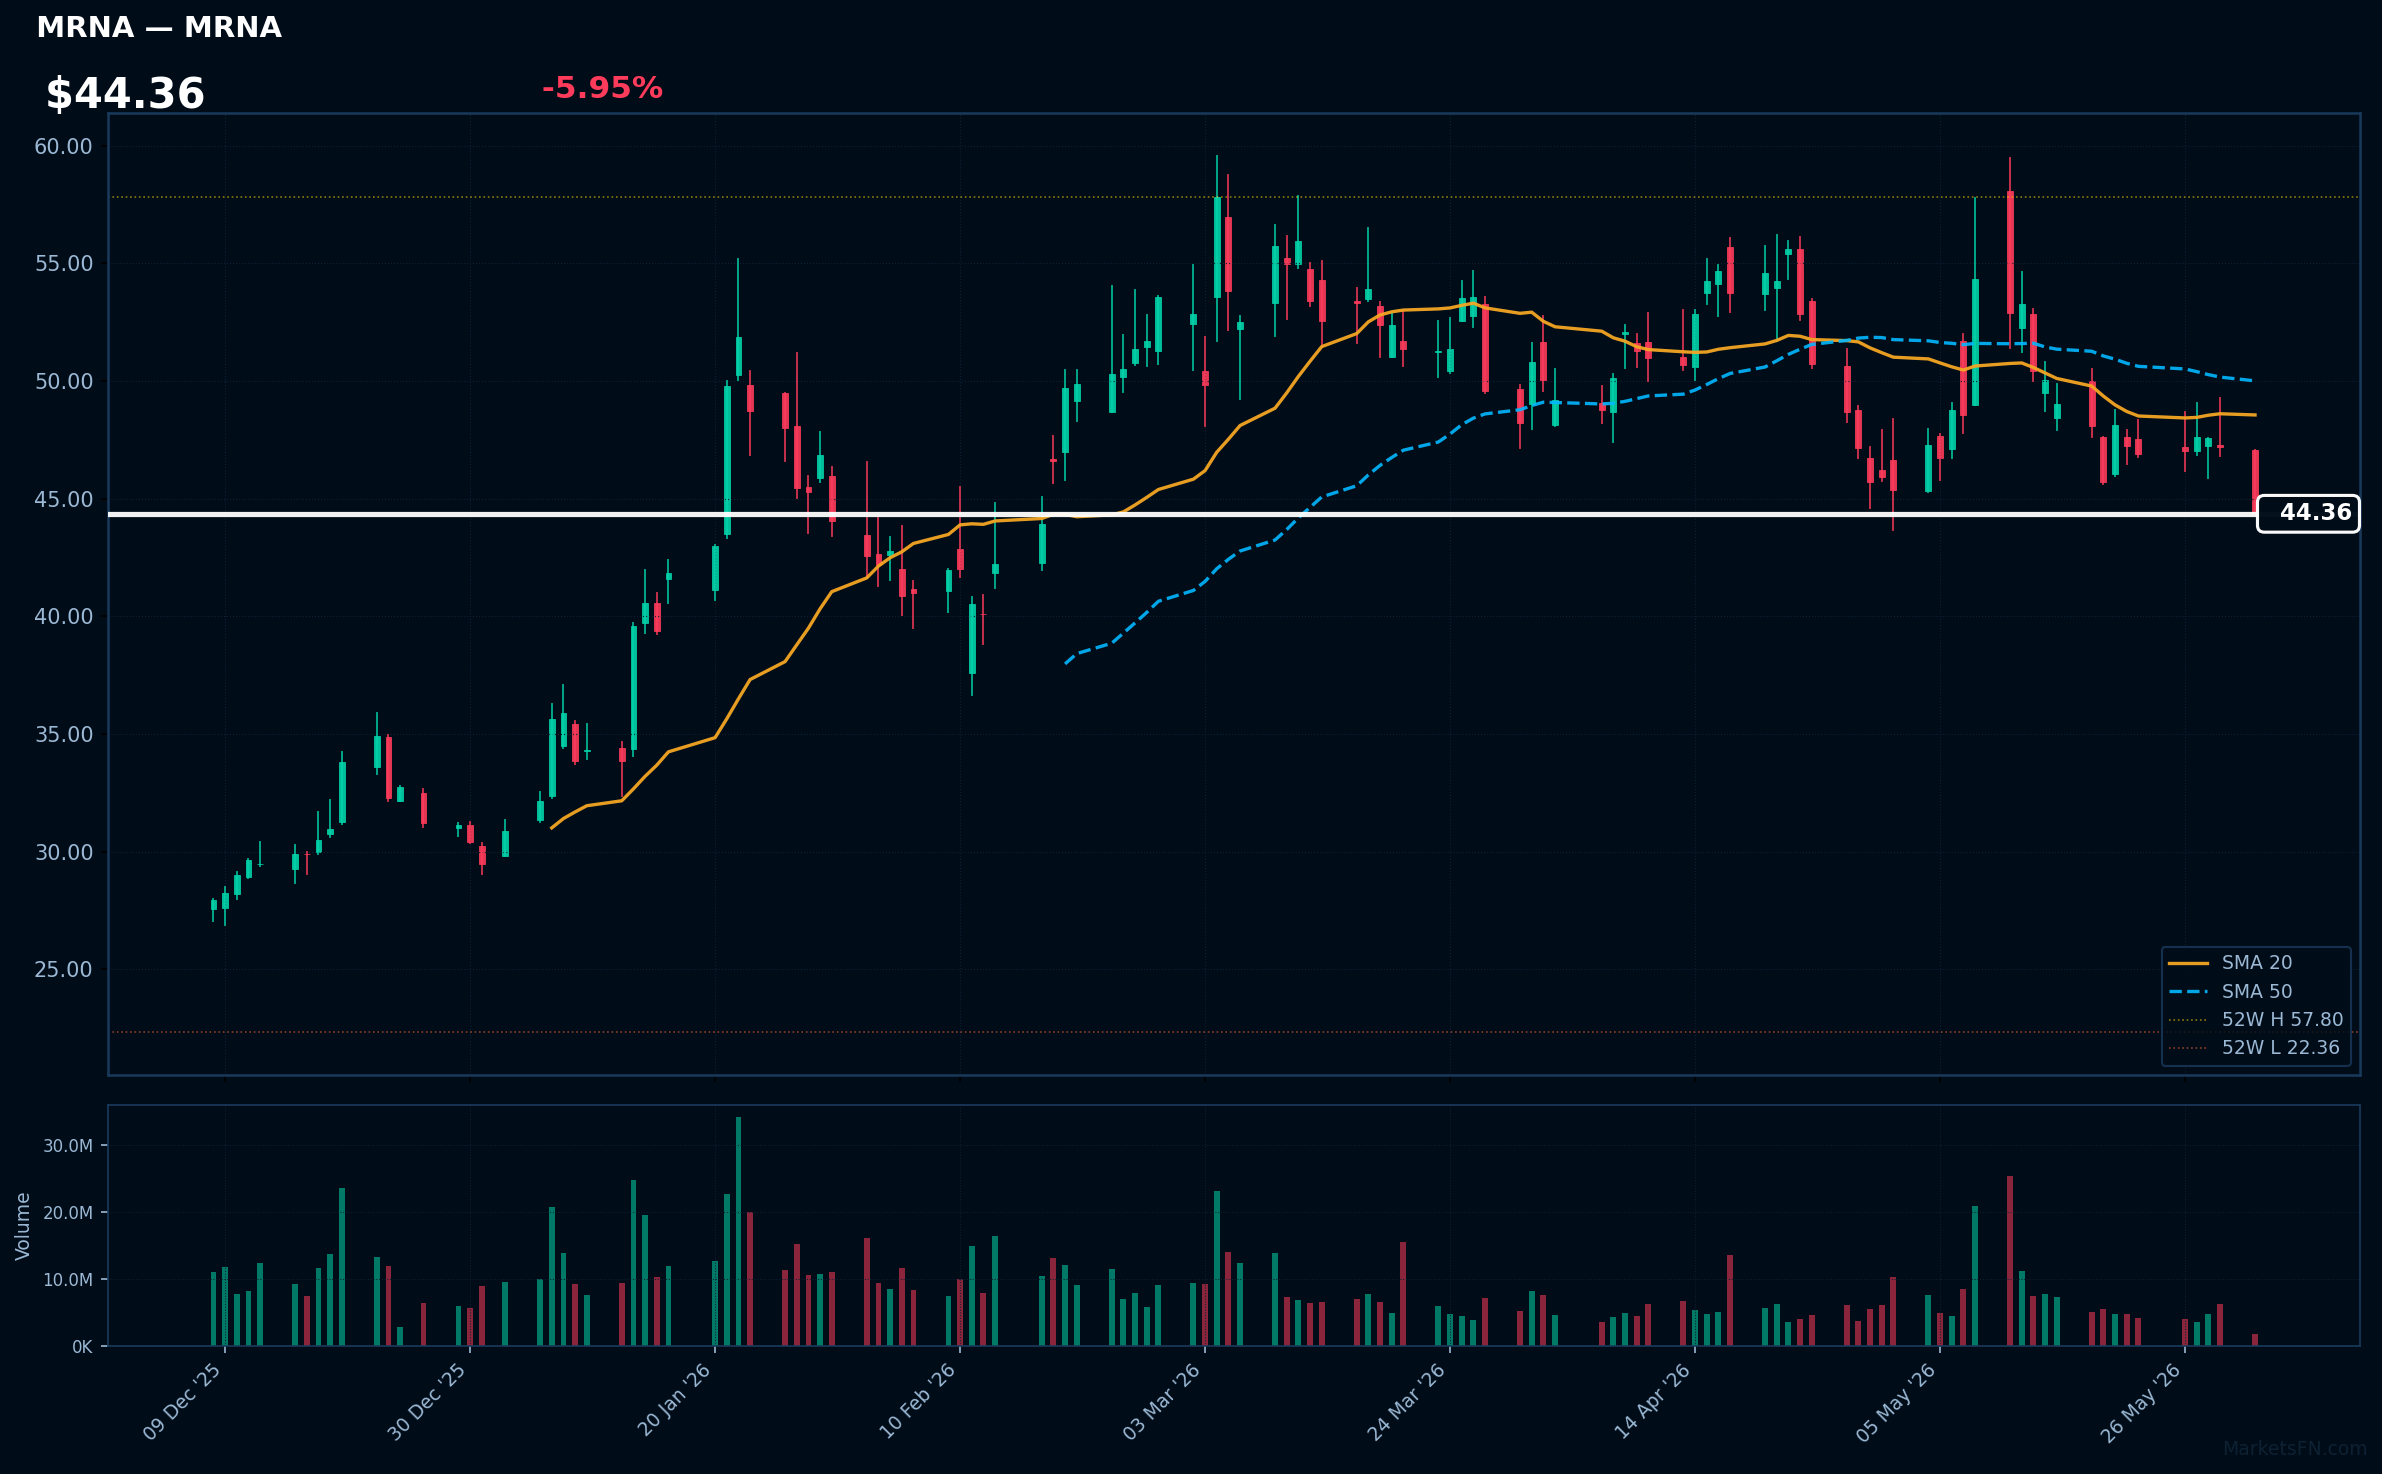
MRNA | Moderna Inc | Healthcare | Price: $44.38 | Day: -5.95% | 1W: -5.38% | 1M: -3.44% | RSI: 37.2 | vs MA200: +18.1% | Trend: Above MA200 · Below MA20, MA50
Recent headlines (last 12h)
- Moderna is developing an mRNA Ebola vaccine as a deadly outbreak spreads through Congo
- Moderna and Merck Present 5-Year Data for Intismeran Autogene in Combination With KEYTRUDA (pembrolizumab) in Patients With High-Risk Stage III/IV Melanoma Following Complete Resection at the 2026 ASCO Annual Meeting
- Moderna Joins Global Initiative to Advance Vaccine Candidate for Bundibugyo Ebola Virus (MRNA)
- Moderna and CEPI Expand Strategic Collaboration to Advance Potential Vaccine Against Bundibugyo Ebolavirus
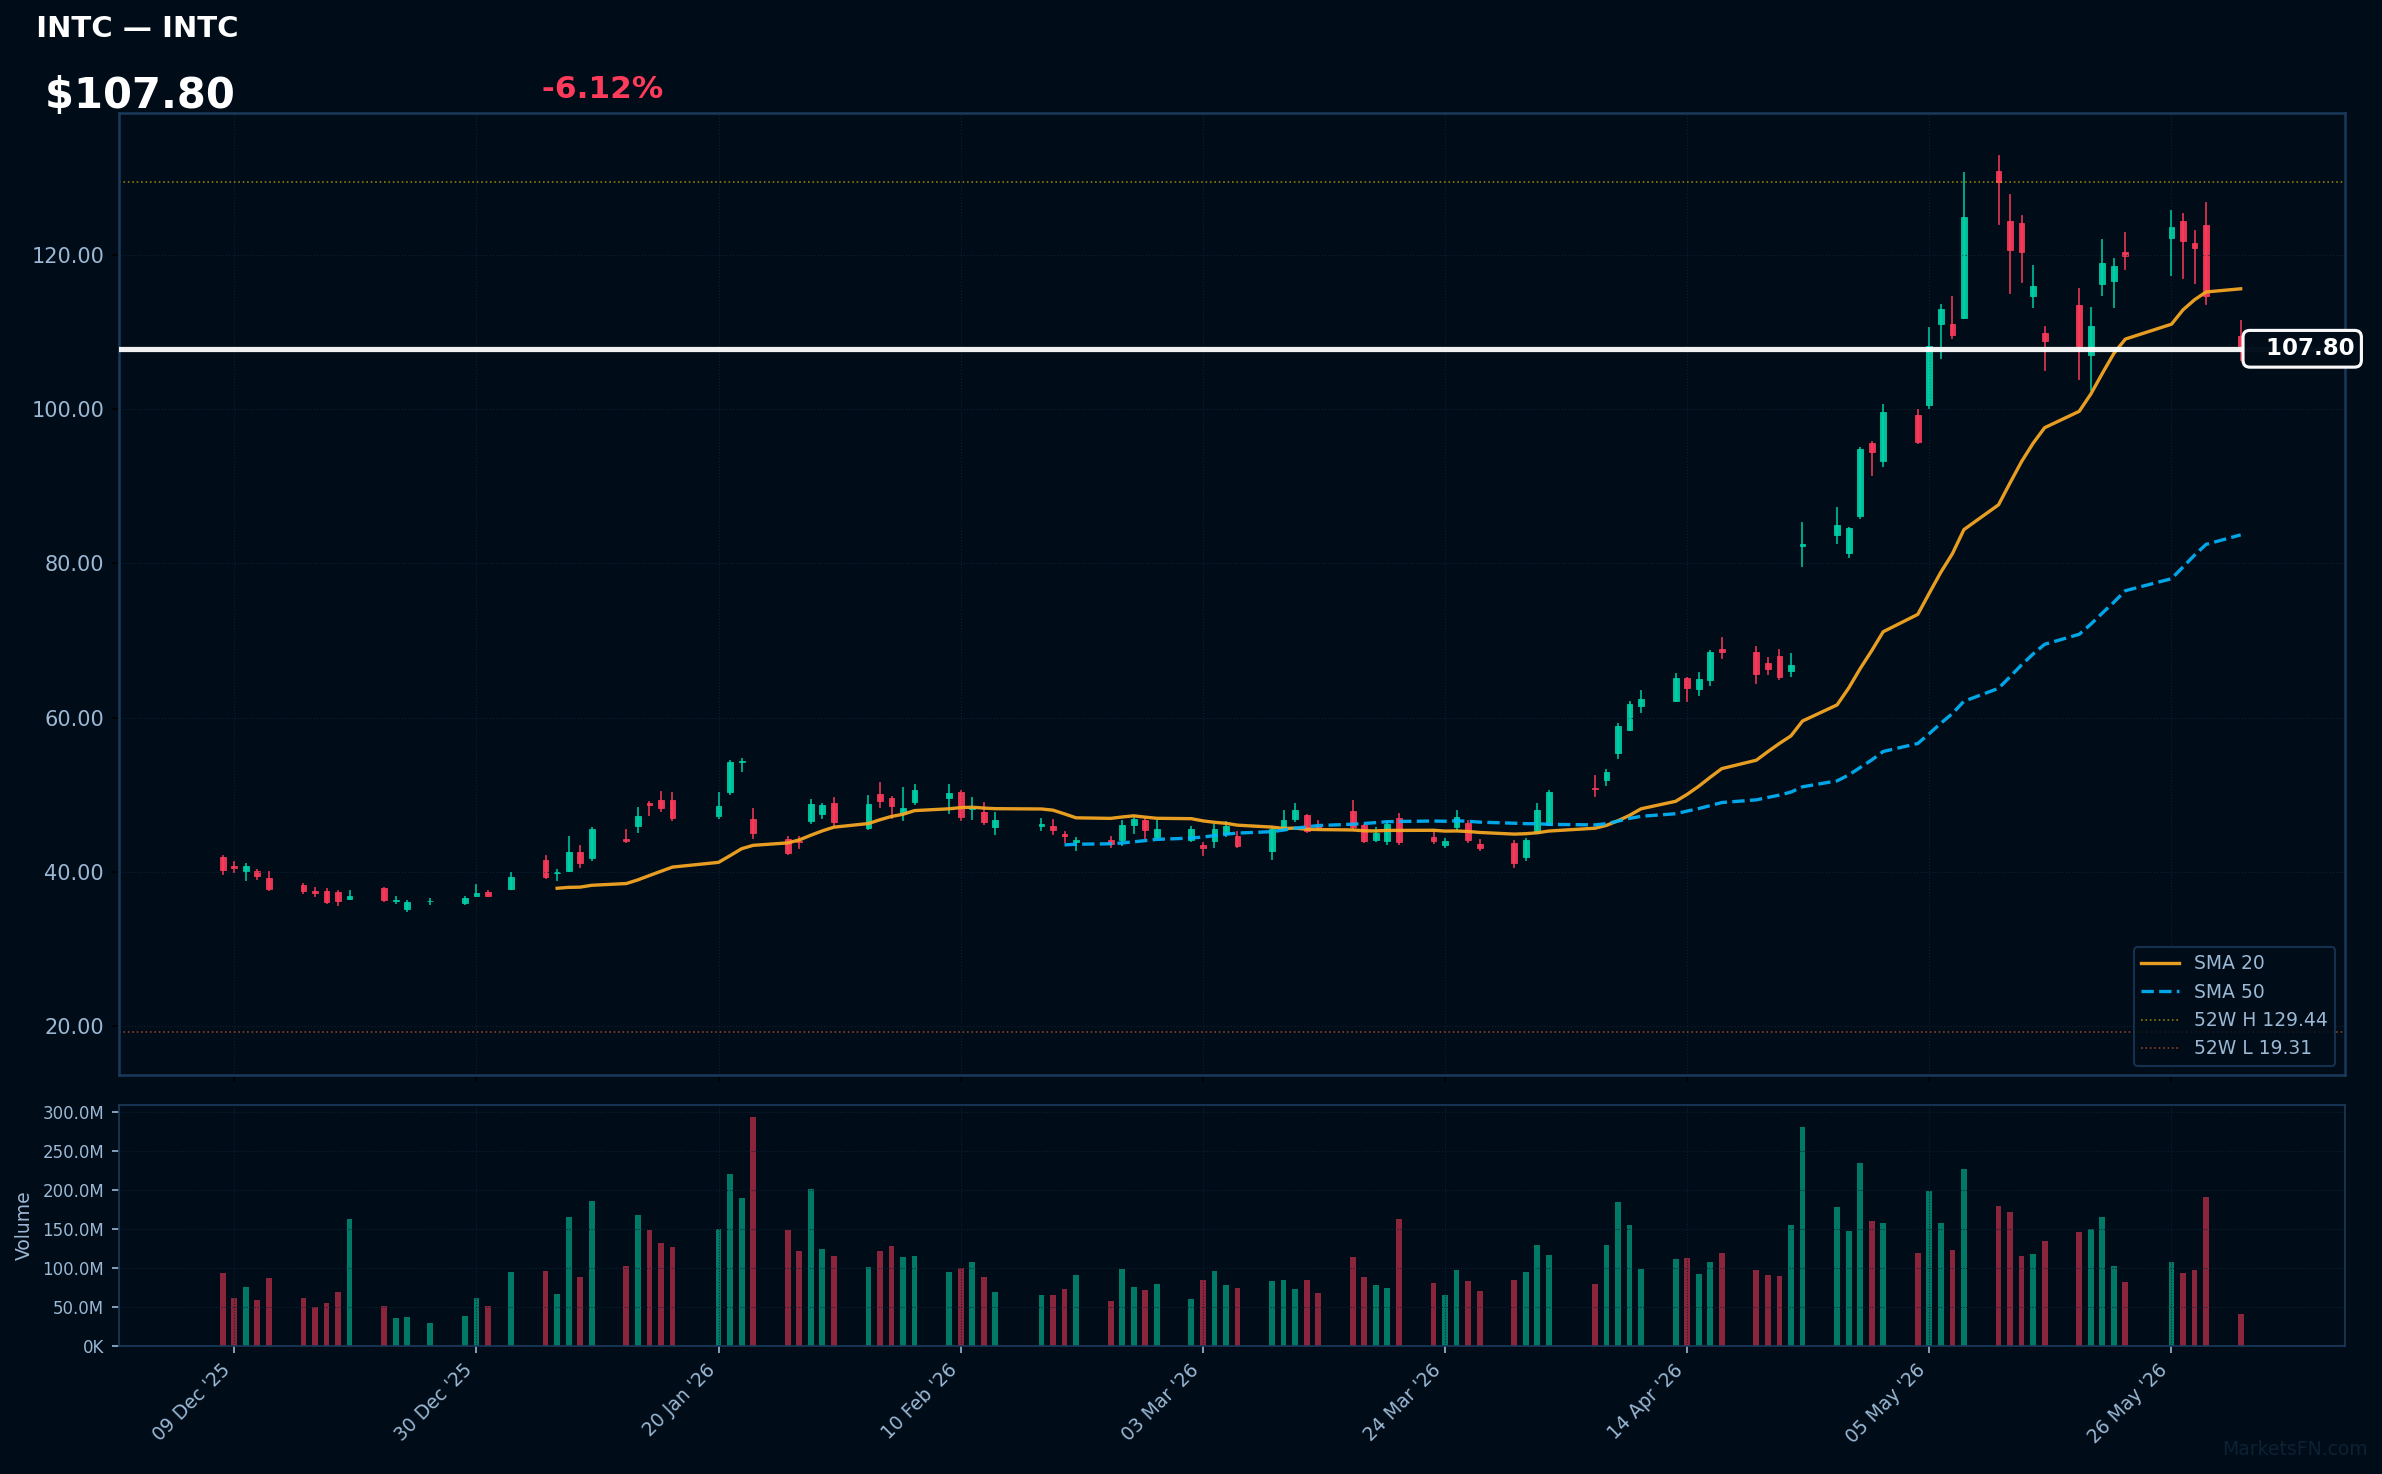
INTC | Intel Corp | Technology | Price: $107.66 | Day: -6.12% | 1W: -10.05% | 1M: +14.10% | RSI: 52.1 | vs MA200: +117.1% | Trend: Above MA50, MA200 · Below MA20
Recent headlines (last 12h)
- Nvidia Says Anthropic, OpenAI Among Users of New Vera Chip
- Stocks to Watch: Nvidia, Qualcomm, Taylor Morrison, MGM
- Nvidia to enter personal computers with new chip reveals at Computex
- Nvidia Is Taking On Intel and AMD With New AI Chip for Computers
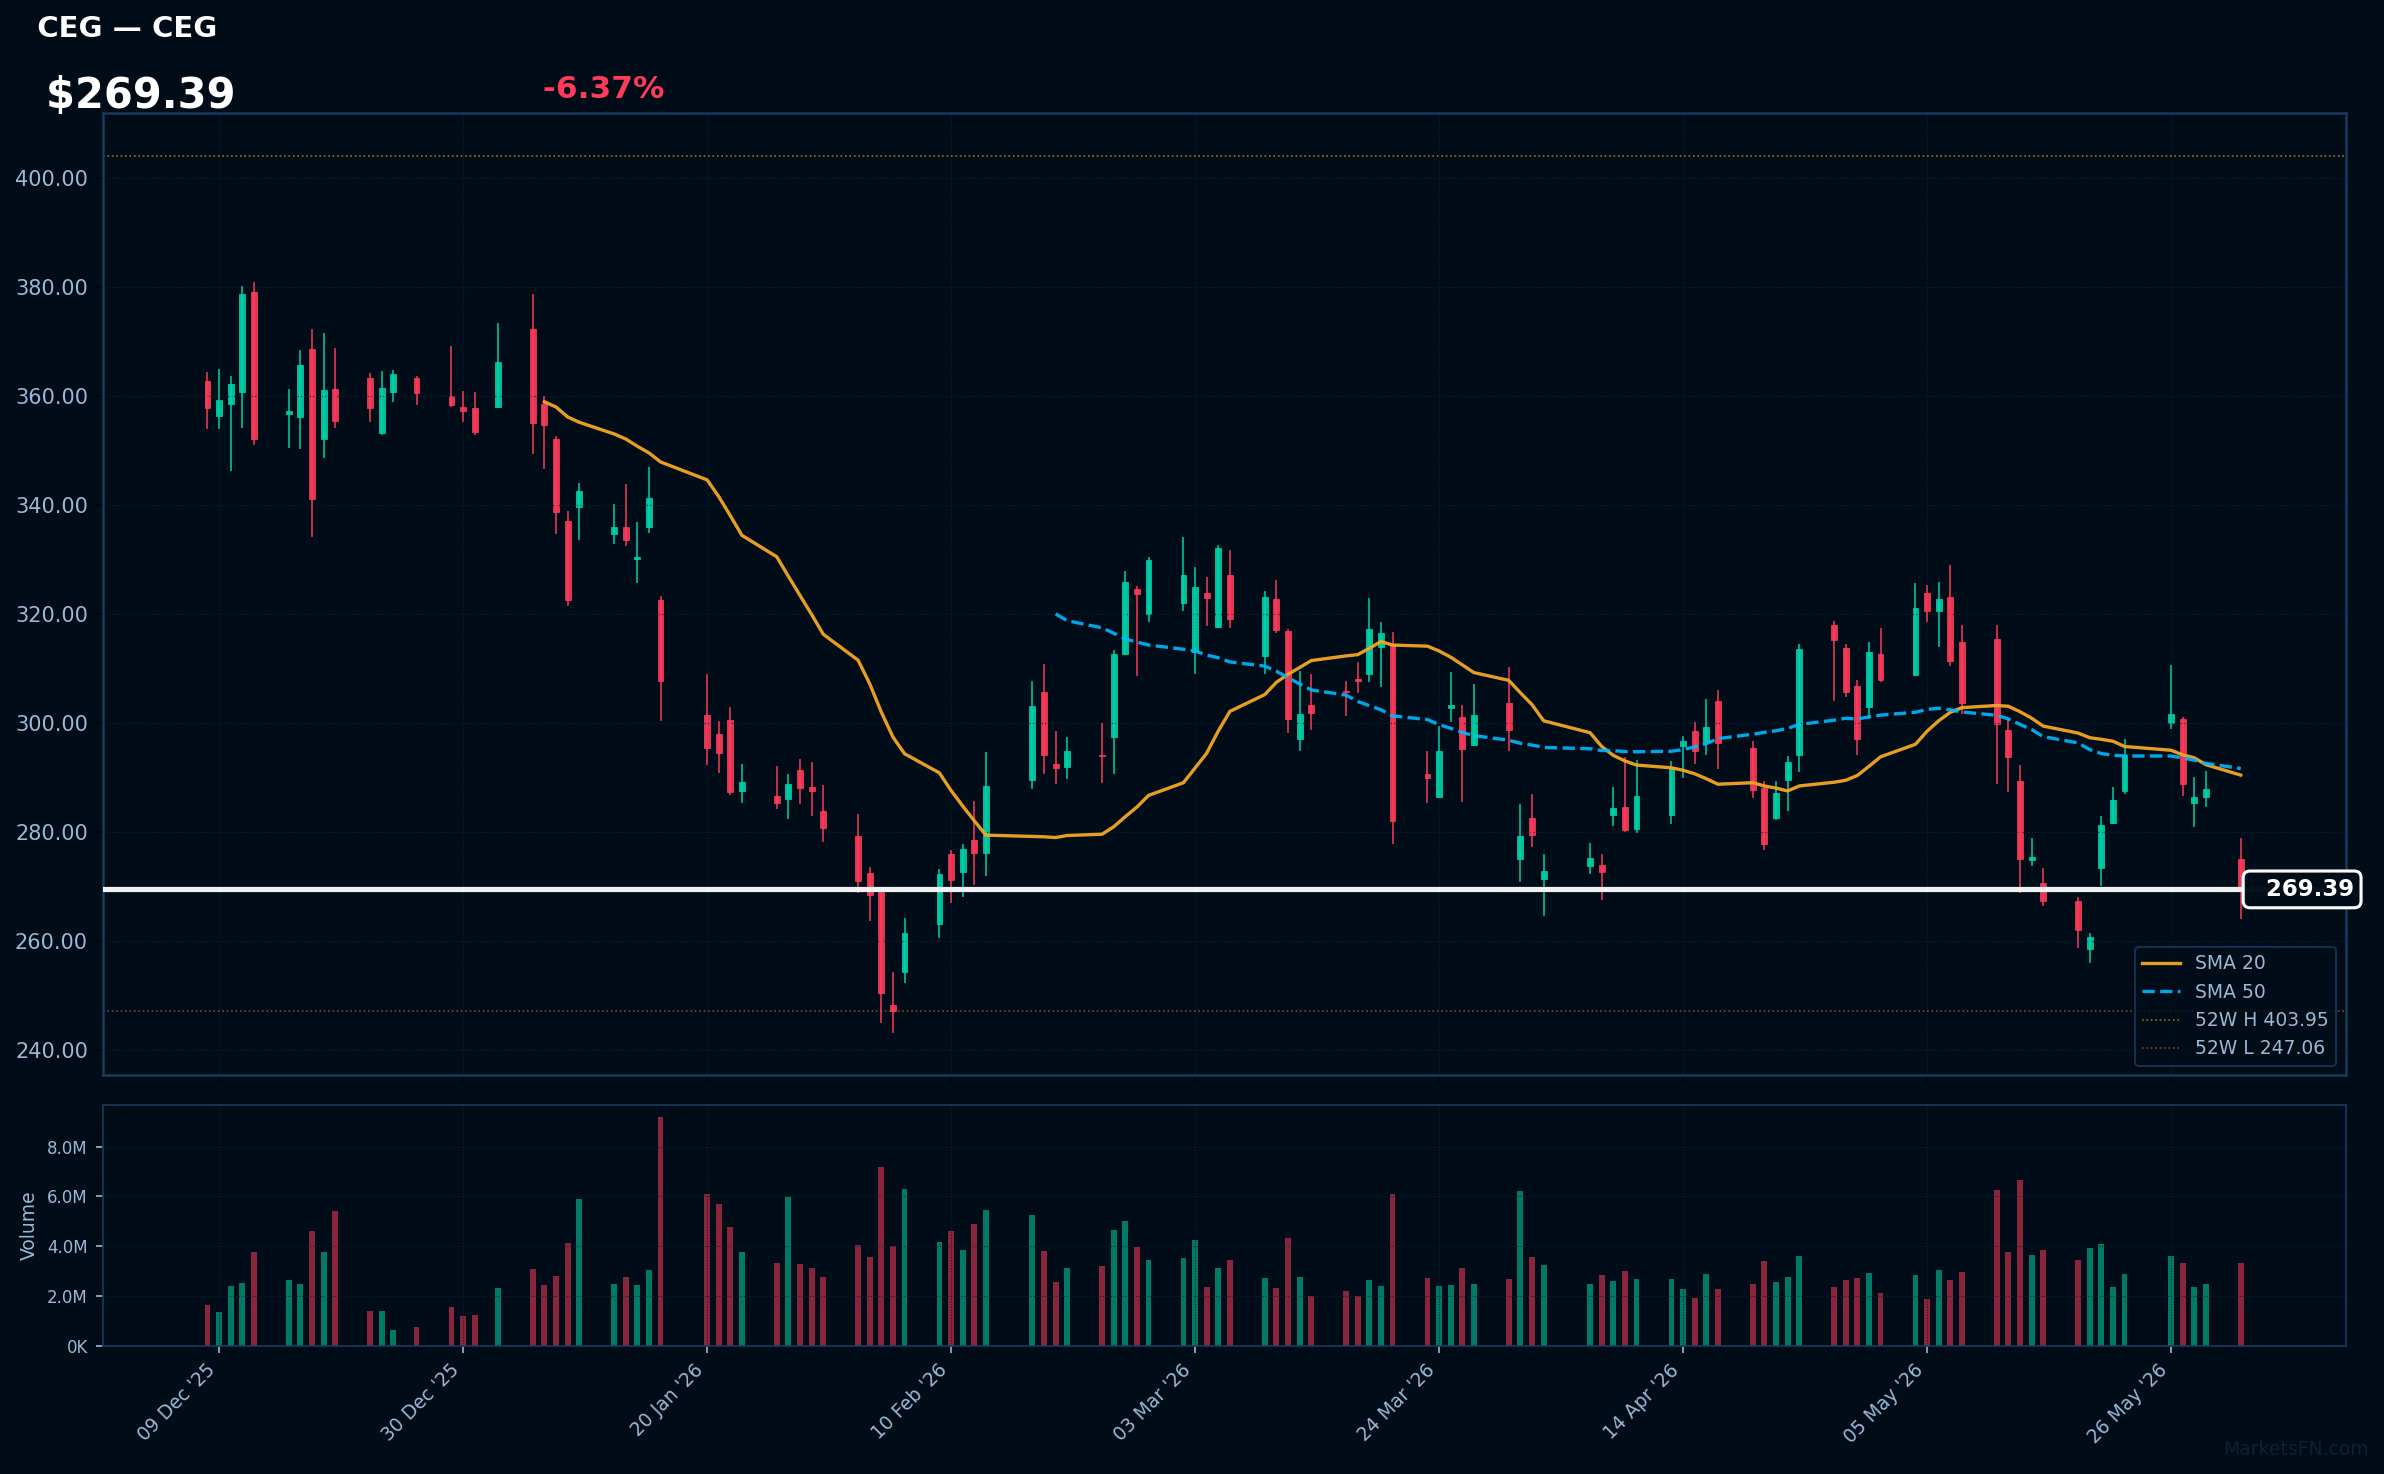
CEG | Constellation Energy Corporation | Utilities | Price: $269.42 | Day: -6.37% | 1W: -8.39% | 1M: -13.93% | RSI: 40.5 | vs MA200: -16.6% | Trend: Below MA20, MA50, MA200
Recent headlines (last 12h)
- Constellation Energy Corporation Announces Pricing of Secondary Public Offering of Common Stock
- Constellation Energy Corporation Announces Secondary Public Offering of Common Stock
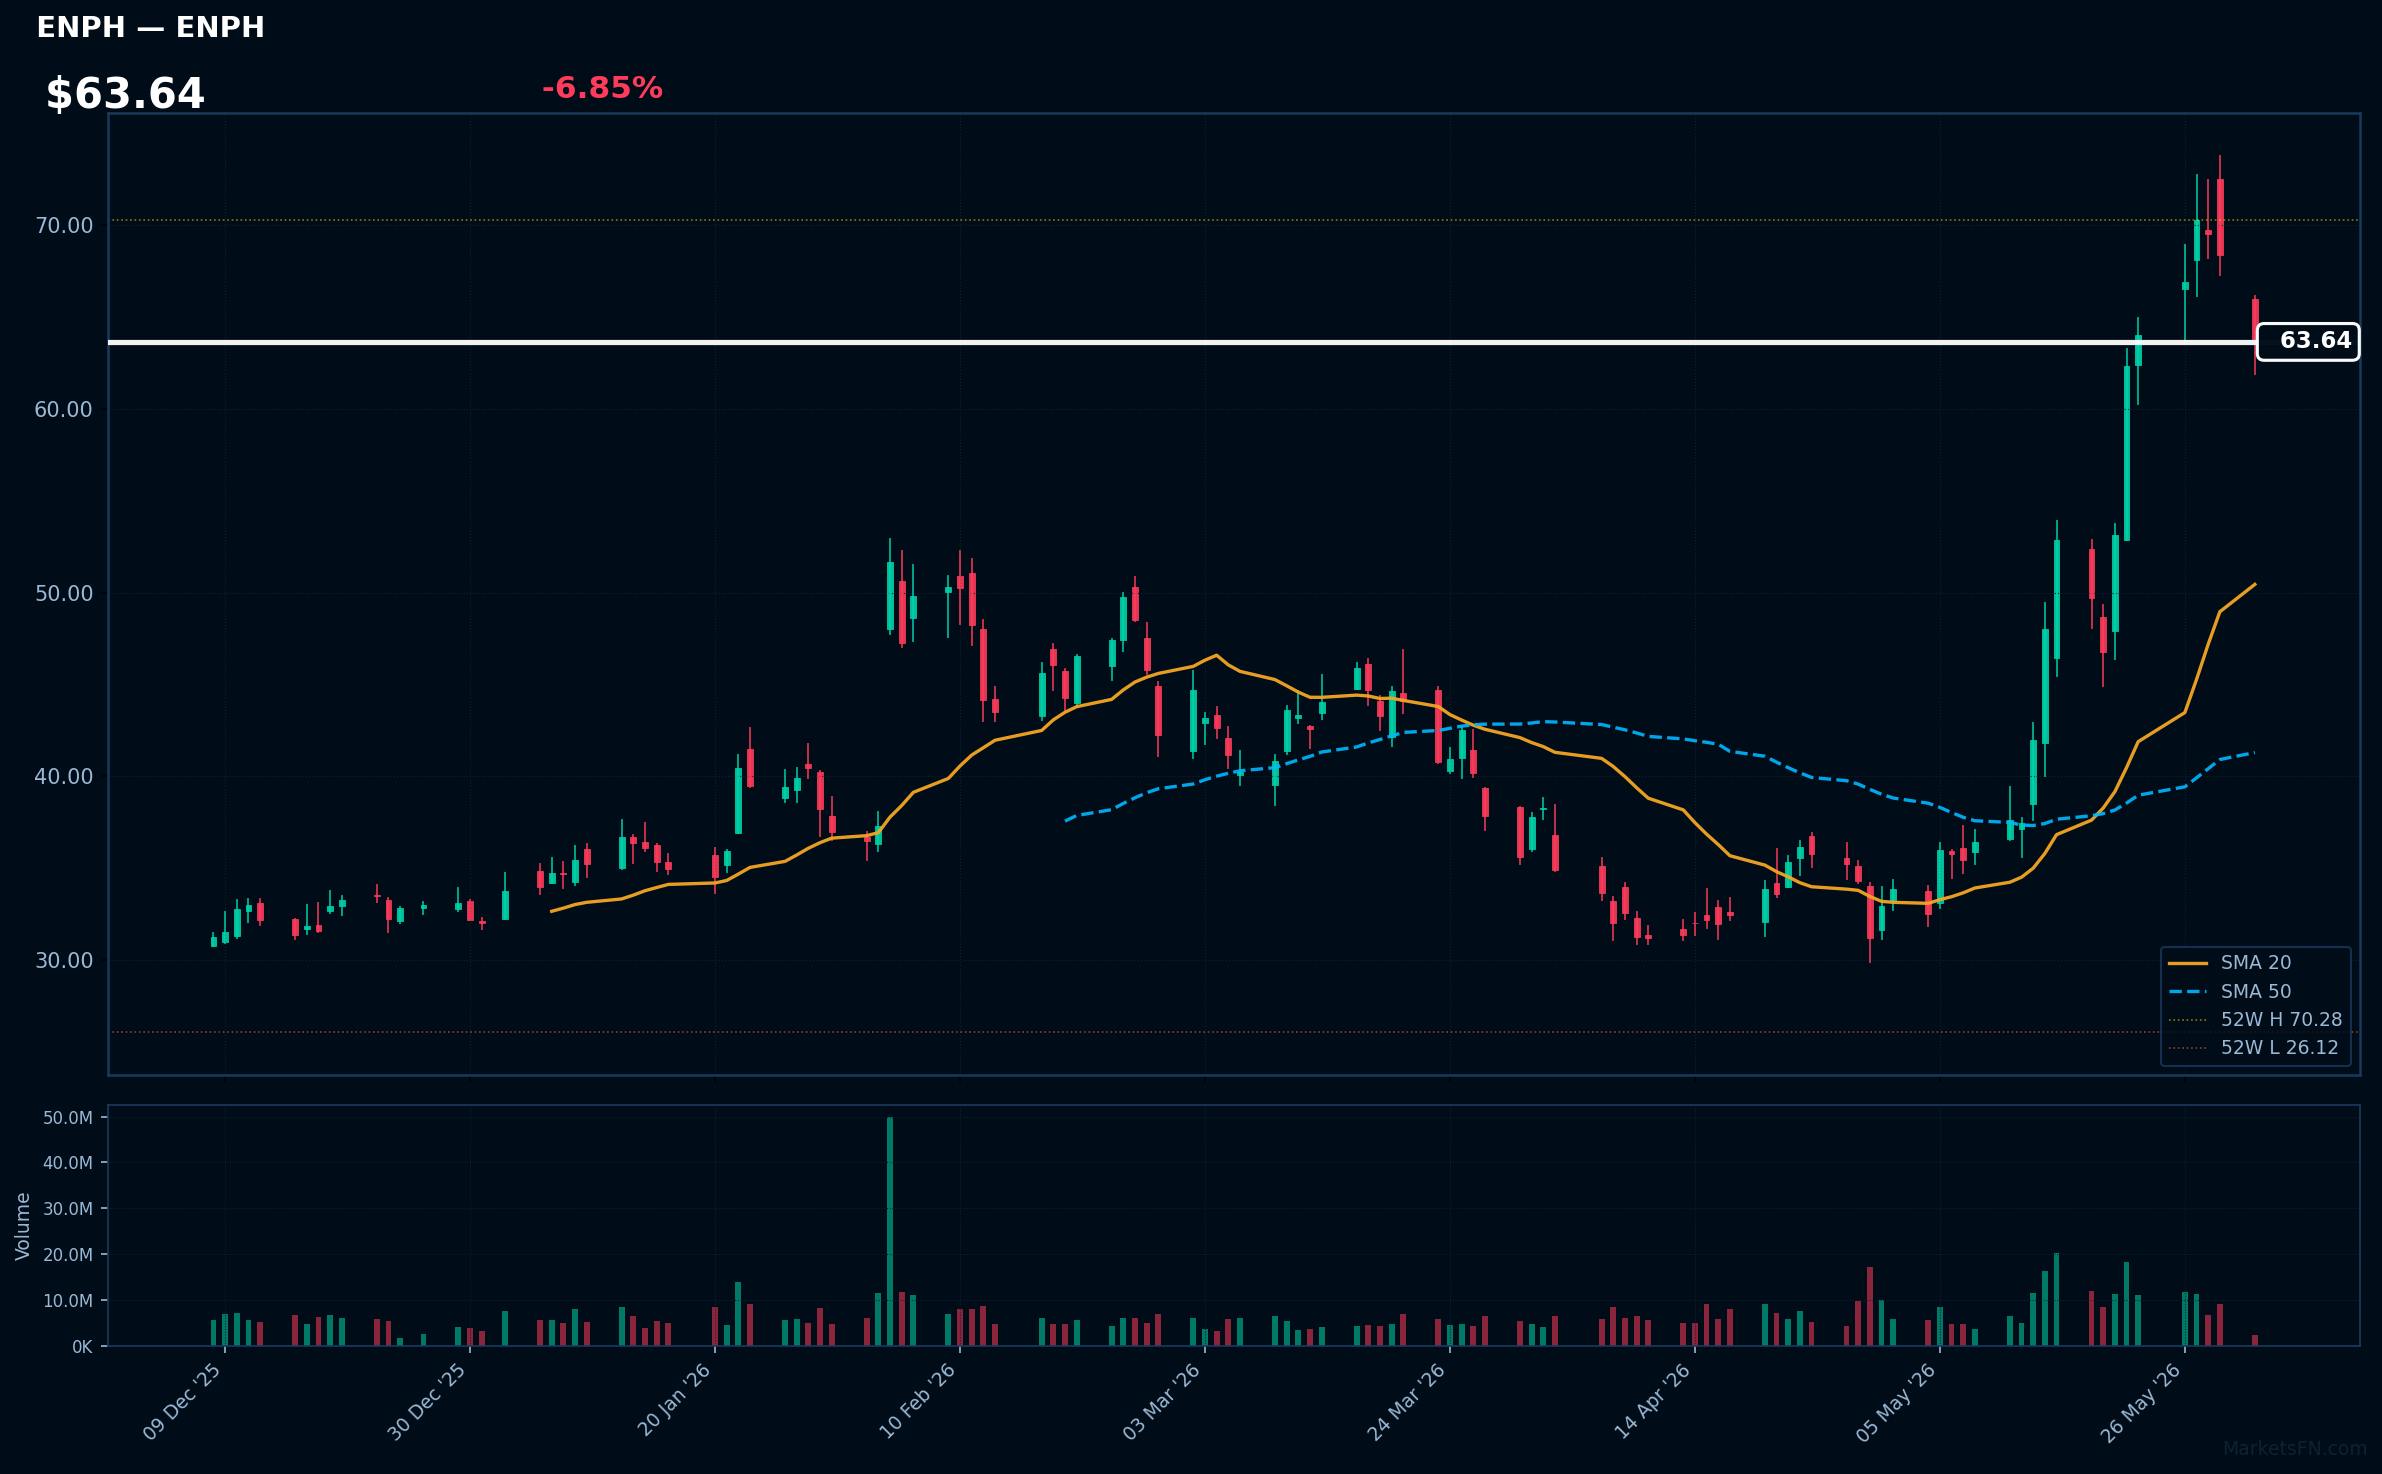
ENPH | Enphase Energy Inc | Technology | Price: $63.68 | Day: -6.85% | 1W: -0.61% | 1M: +93.08% | RSI: 67.8 | vs MA200: +68.0% | Trend: Above MA20, MA50, MA200
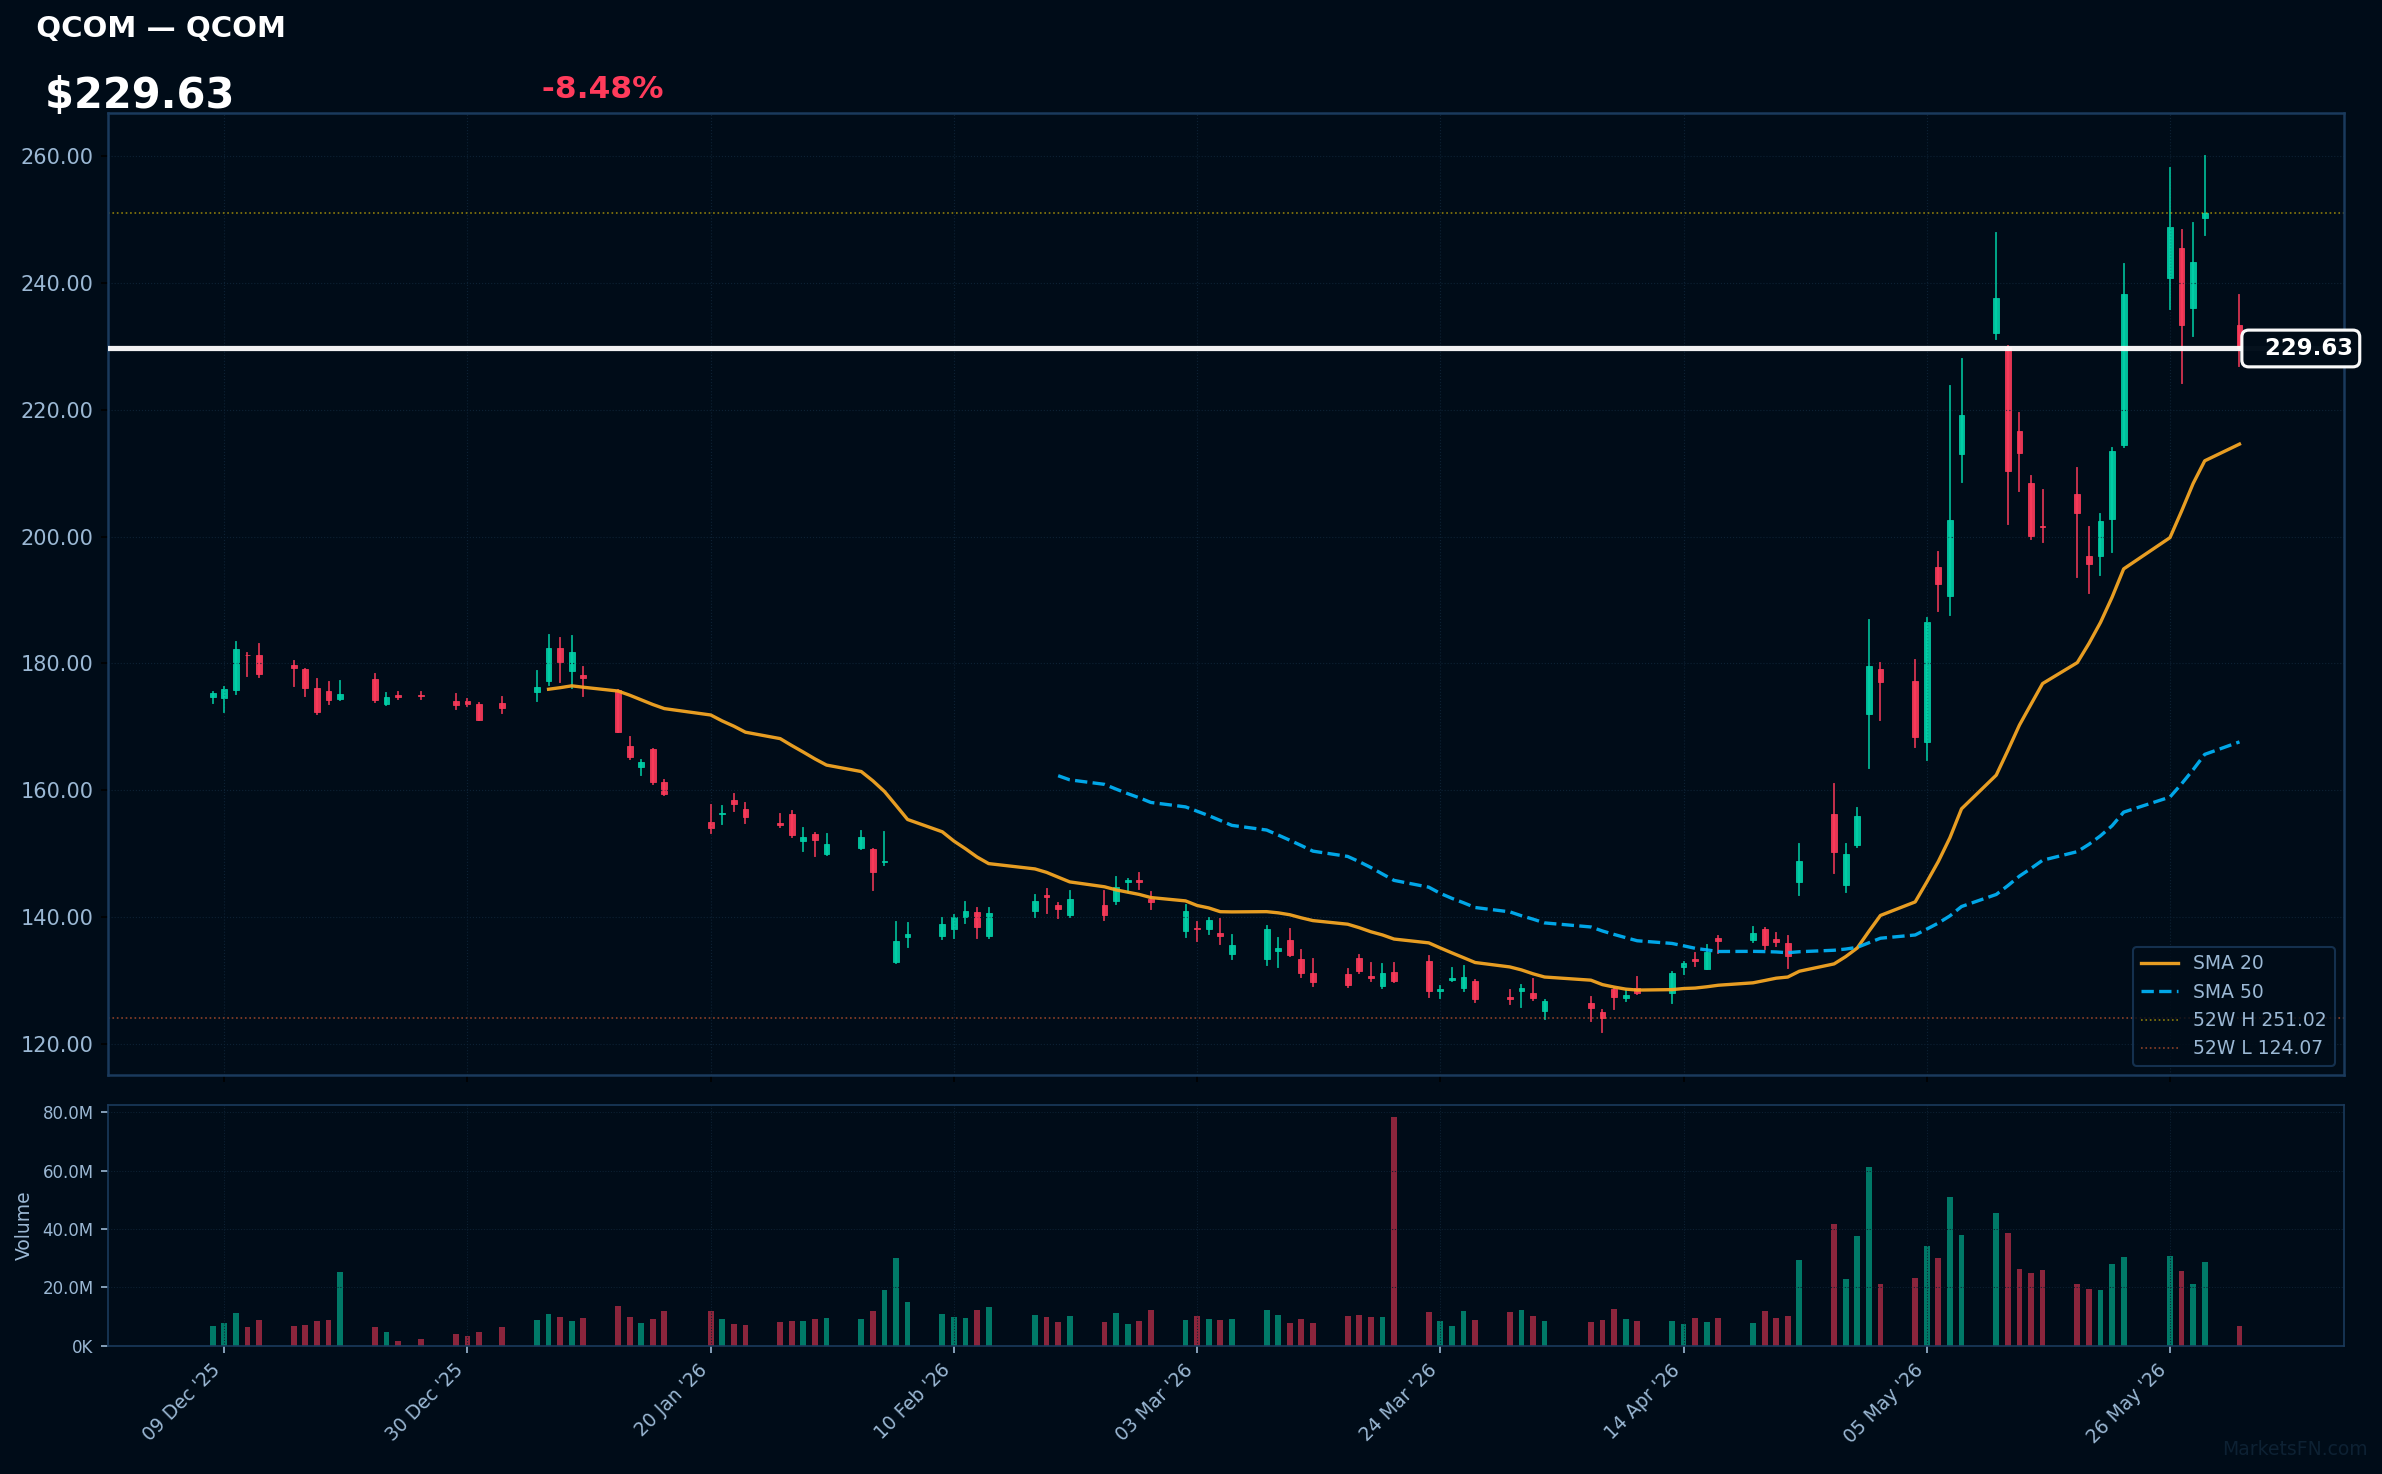
QCOM | Qualcomm, Inc | Technology | Price: $229.74 | Day: -8.48% | 1W: -3.58% | 1M: +27.87% | RSI: 59.7 | vs MA200: +41.1% | Trend: Above MA20, MA50, MA200
Recent headlines (last 12h)
- Stocks to Watch: Nvidia, Qualcomm, Taylor Morrison, MGM
- Nvidia to enter personal computers with new chip reveals at Computex
- Nvidia Is Taking On Intel and AMD With New AI Chip for Computers
- Wall St set for record highs as AI push eclipses US-Iran war worries
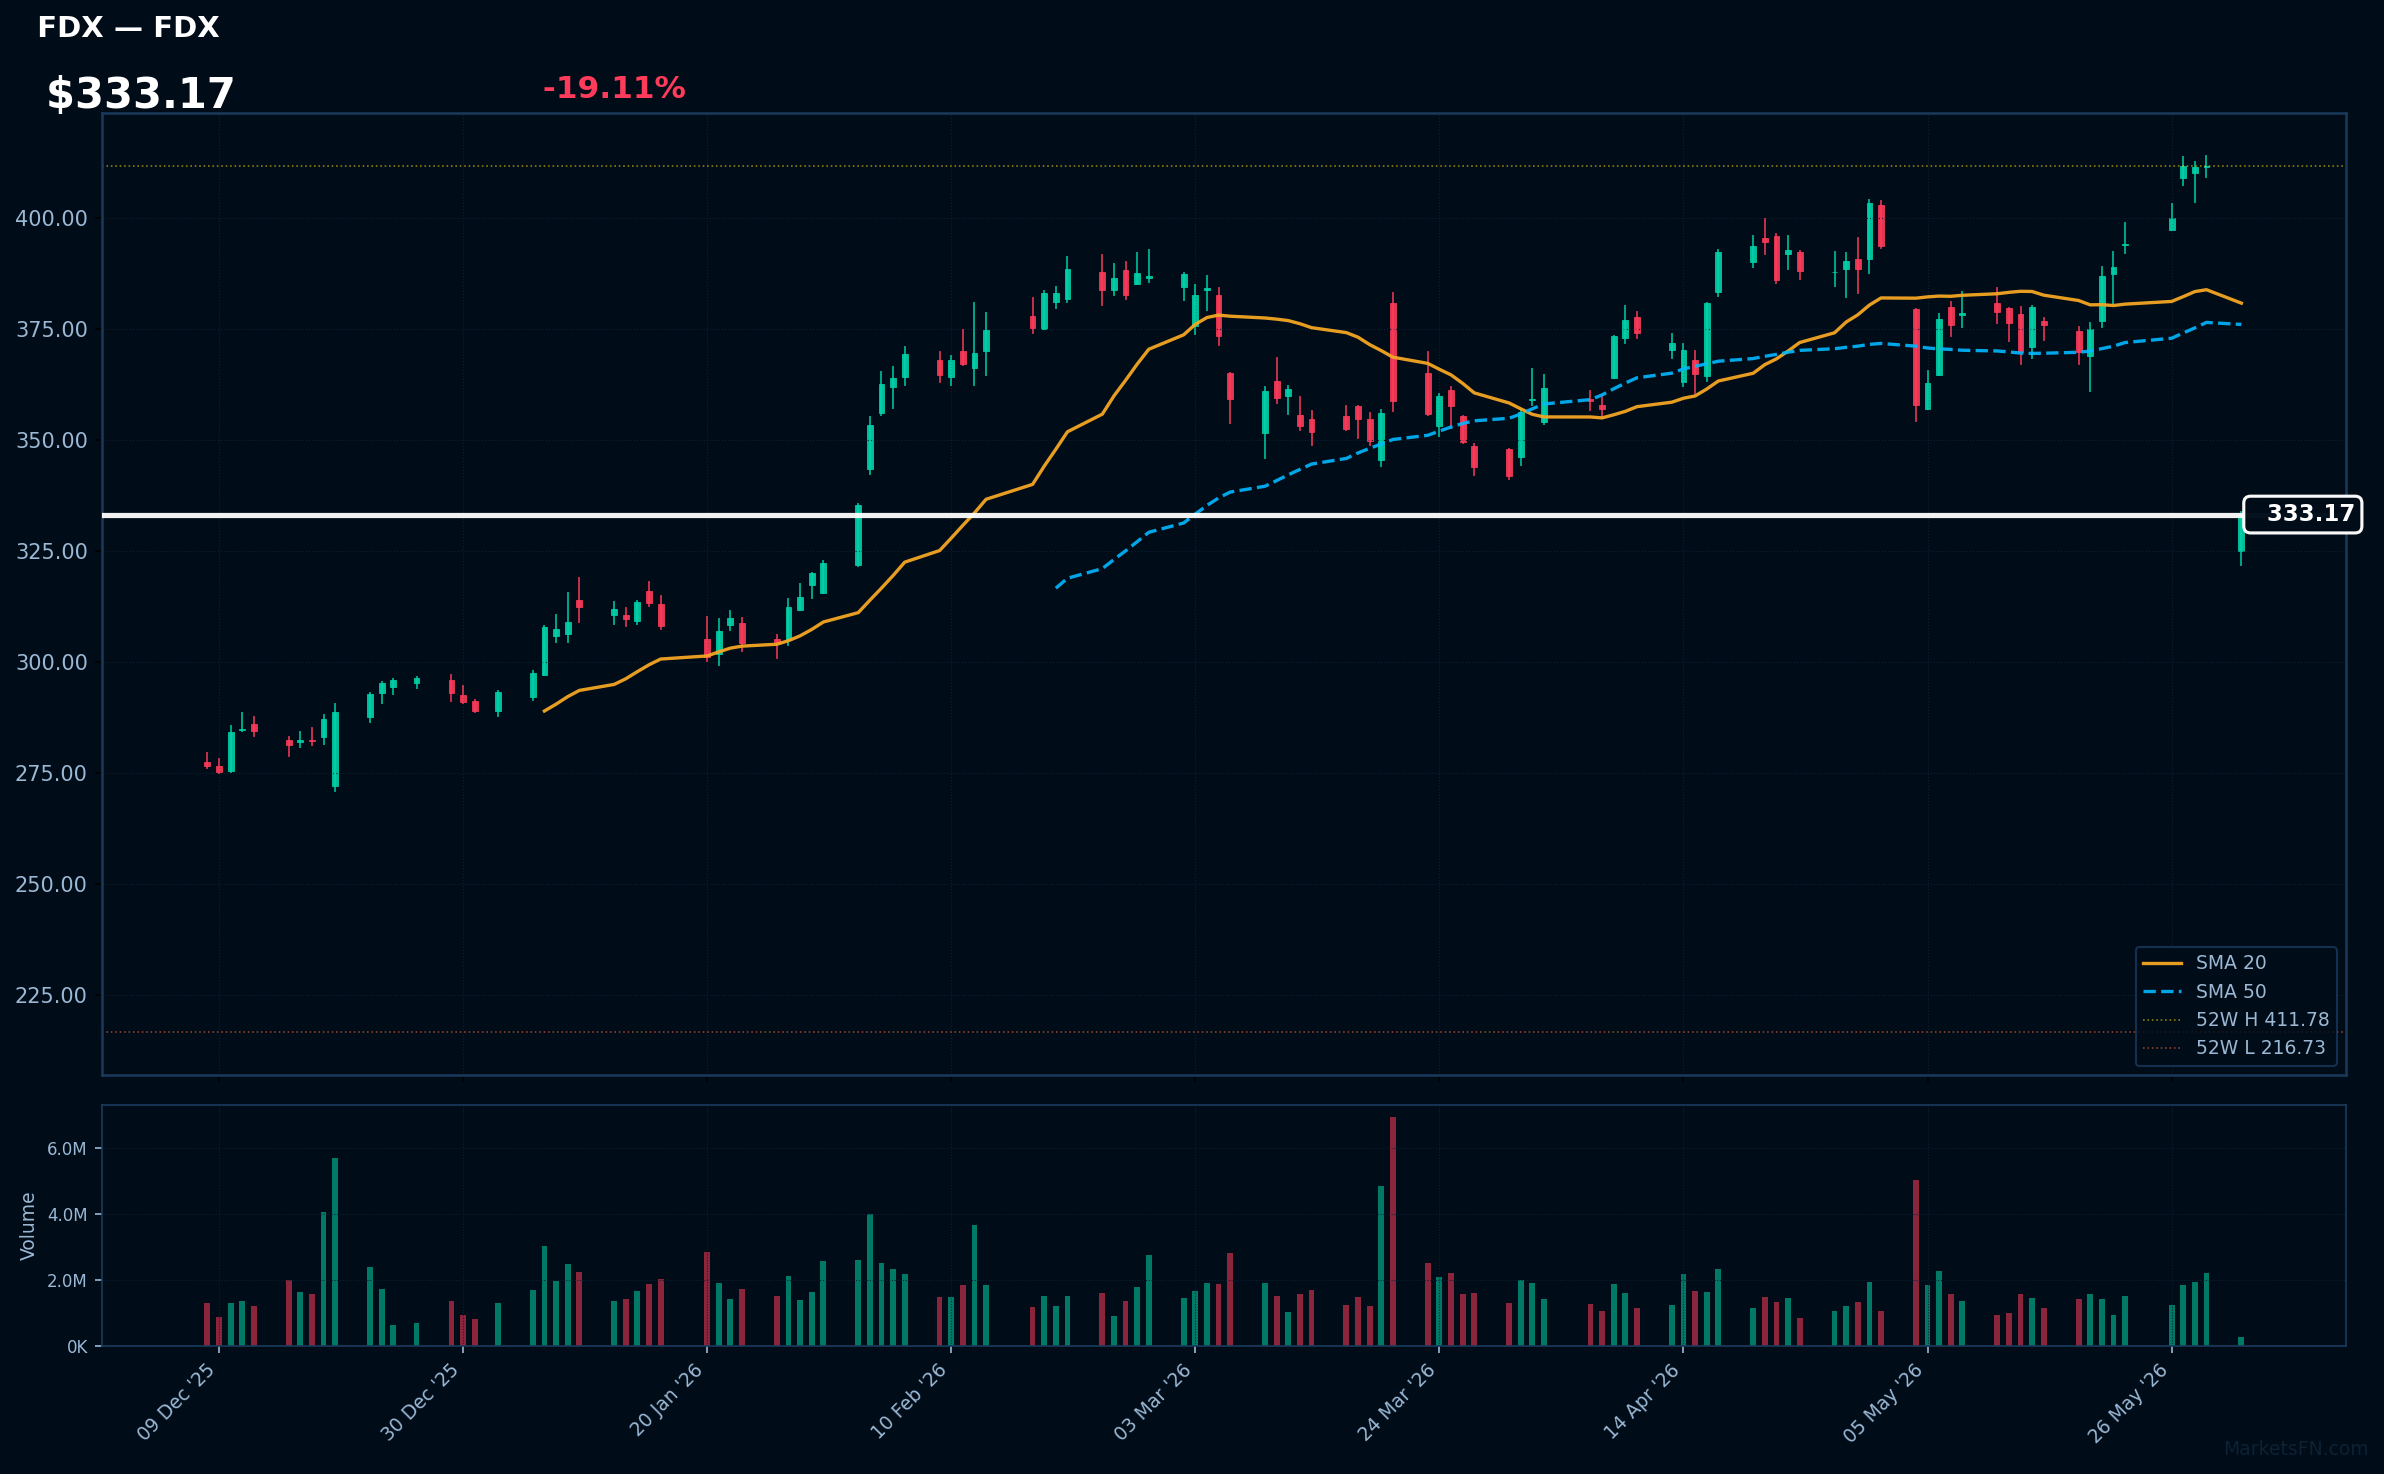
FDX | Fedex Corp | Industrials | Price: $333.06 | Day: -19.11% | 1W: -15.48% | 1M: -17.39% | RSI: 32.7 | vs MA200: +8.2% | Trend: Above MA200 · Below MA20, MA50
Recent headlines (last 12h)
- FedEx trucking hub expansion in Netherlands aids new air cargo strategy
- FedEx Freight Completes Spinoff, Joins S&P 500, Dow Jones Transport Indexes
- FedEx Shares Edge Higher Following Completion of Freight Business Spin-Off (FDX)
- FedEx Freight Completes Spin-Off and Begins Trading on the New York Stock Exchange
Market Commentary
The S&P 500's June 01, 2026 session saw a narrow majority of constituents decline, with 304 stocks (61.3%) falling against 191 (38.5%) advancing, indicating a negative breadth. The average daily change was a modest 0.16%, suggesting a relatively subdued session tone.
Sector rotation is evident in the top gainers and losers. Technology and Healthcare stocks were represented on both lists, with gainers like NOW, CRM, and INTU, while losers included TXN, AMD, and MRNA. Meanwhile, Energy and Consumer Cyclical names like DVN and MGM were among the top gainers, while Industrials and Financials such as FDX and CBOE were among the laggards, indicating a potential shift in investor preferences.
Traders should monitor the MA200, as only 12 stocks (2.4%) are currently trading above this key level. A sustained move above or below this threshold could signal a shift in market sentiment. The next catalyst will be the upcoming earnings reports from key constituents, which may validate or invalidate the current sector rotation trend.
Methodology
Daily ranking uses the latest session close versus the prior close. RSI (14-day EWM), MA20, MA50, and MA200 are computed from 12 months of daily OHLCV data sourced from Yahoo Finance. Charts show the last 120 trading sessions with SMA 20/50, 52-week H/L markers, and volume. Recent news (last 12 h) is sourced from FinViz. Updated every trading day.
Disclaimer
The content on MarketsFN.com is provided for educational and informational purposes only. It does not constitute financial advice, investment recommendations, or trading guidance. All investments involve risks, and past performance does not guarantee future results. You are solely responsible for your investment decisions and should conduct independent research and consult a qualified financial advisor before acting. MarketsFN.com and its authors are not liable for any losses or damages arising from your use of this information.
Related Articles
- Box (BOX) quarter year Box Financial Results Summary — Box, Inc. (BOX) Q1 FY27: Revenue Growth of 11% YoY — Positive Momentum Box, Inc. (NYSE:BOX) reported its financial…
- Semtech Corporation (SMTC) Q1 2027 Financial Results Summary — Semtech Corporation (SMTC) Q1 2027: Record Sales and Earnings Growth — Strong Start to Fiscal Year Semtech Corporation…
- Modine Manufacturing Company (MOD) Q4 2026 Financial Results Summary — Modine (MOD) Q4 2026: Record Sales and Earnings Growth — Strongly Positive Modine (NYSE: MOD) reported impressive…
- Zscaler (ZS) quarter Q2 Financial Results Summary — Zscaler (ZS) Q3 2026: Revenue Growth Accelerates, Operating Losses Widen — Cautiously Optimistic Zscaler, Inc. (Nasdaq:…
- Champion Homes (SKY) Q4 2026 Financial Results Summary — Champion Homes (SKY) Q4 2026: Mixed Results with Revenue Growth but Profit Decline — Cautiously Optimistic Champion…