S&P/ASX 200 Leads Asian Markets Amid Indonesian Bull Market Surge
MarketsFN Team
S&P/ASX 200 Leads Asian Markets Amid Indonesian Bull Market Surge
Note: This analysis covers the Asian trading session close for July 28, 2026. All times are in US Eastern Time (ET).
📊 Asian Indices Performance
| Index | Price | Daily Change (%) |
|---|---|---|
| Shanghai Composite | 3,813.31 | -1.16% |
| Nikkei 225 | 62,364.92 | -3.95% |
| Hang Seng Index | 25,310.85 | +0.41% |
| Shenzhen Component | 13,509.68 | -4.52% |
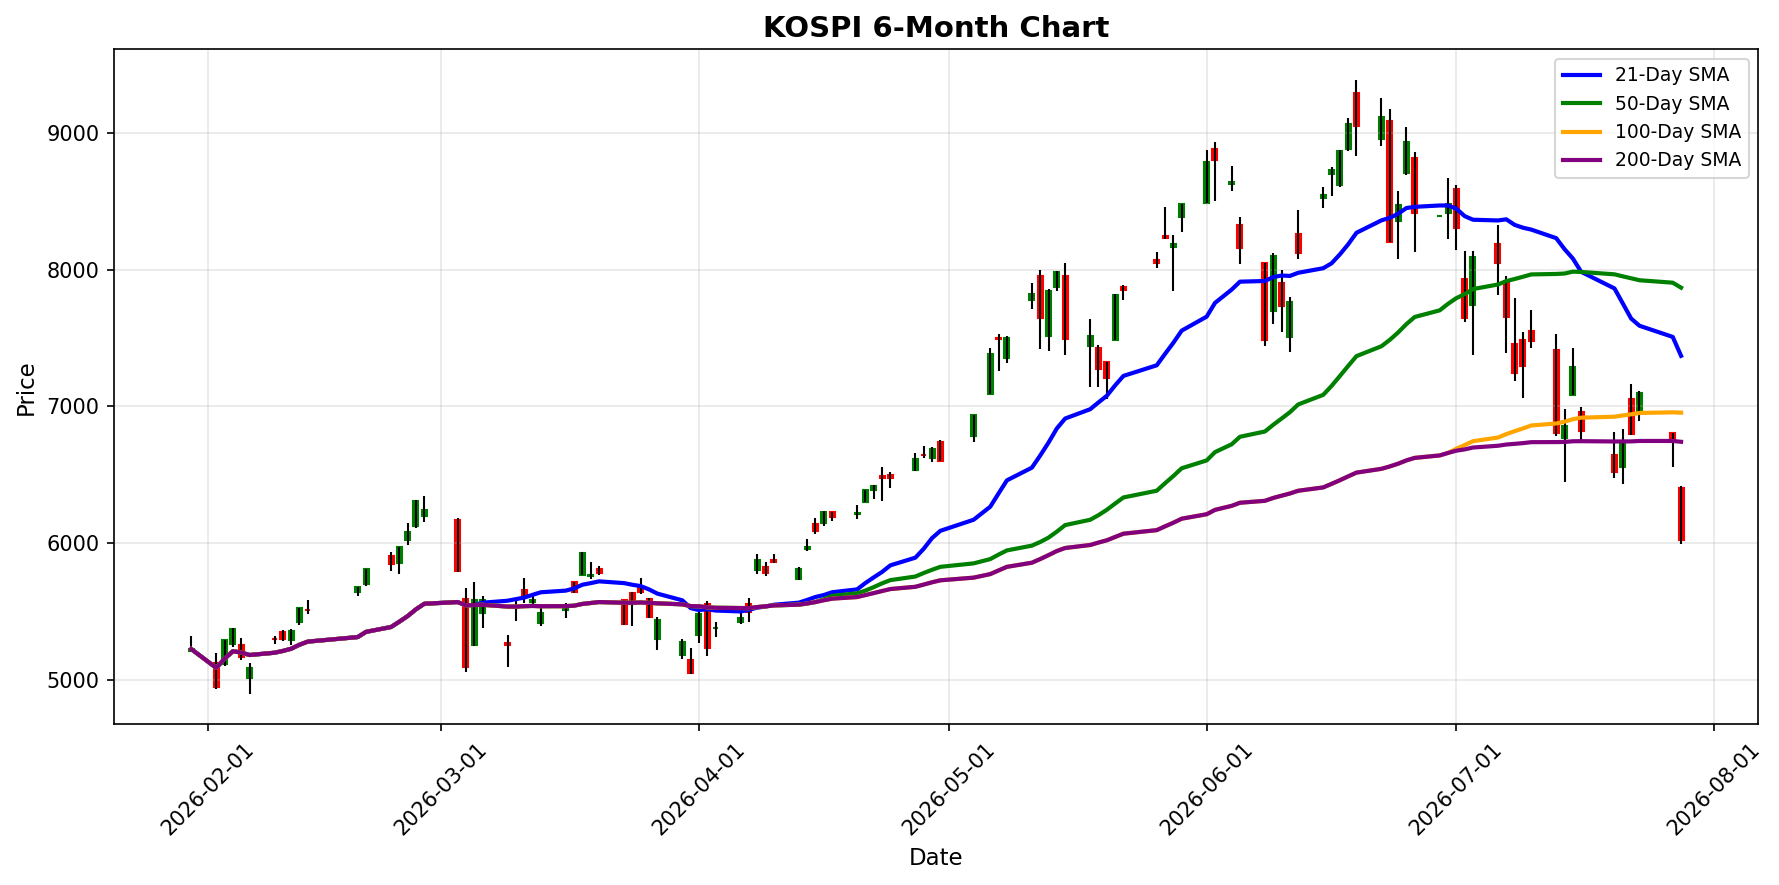
| KOSPI | 6,023.66 | -10.84% |
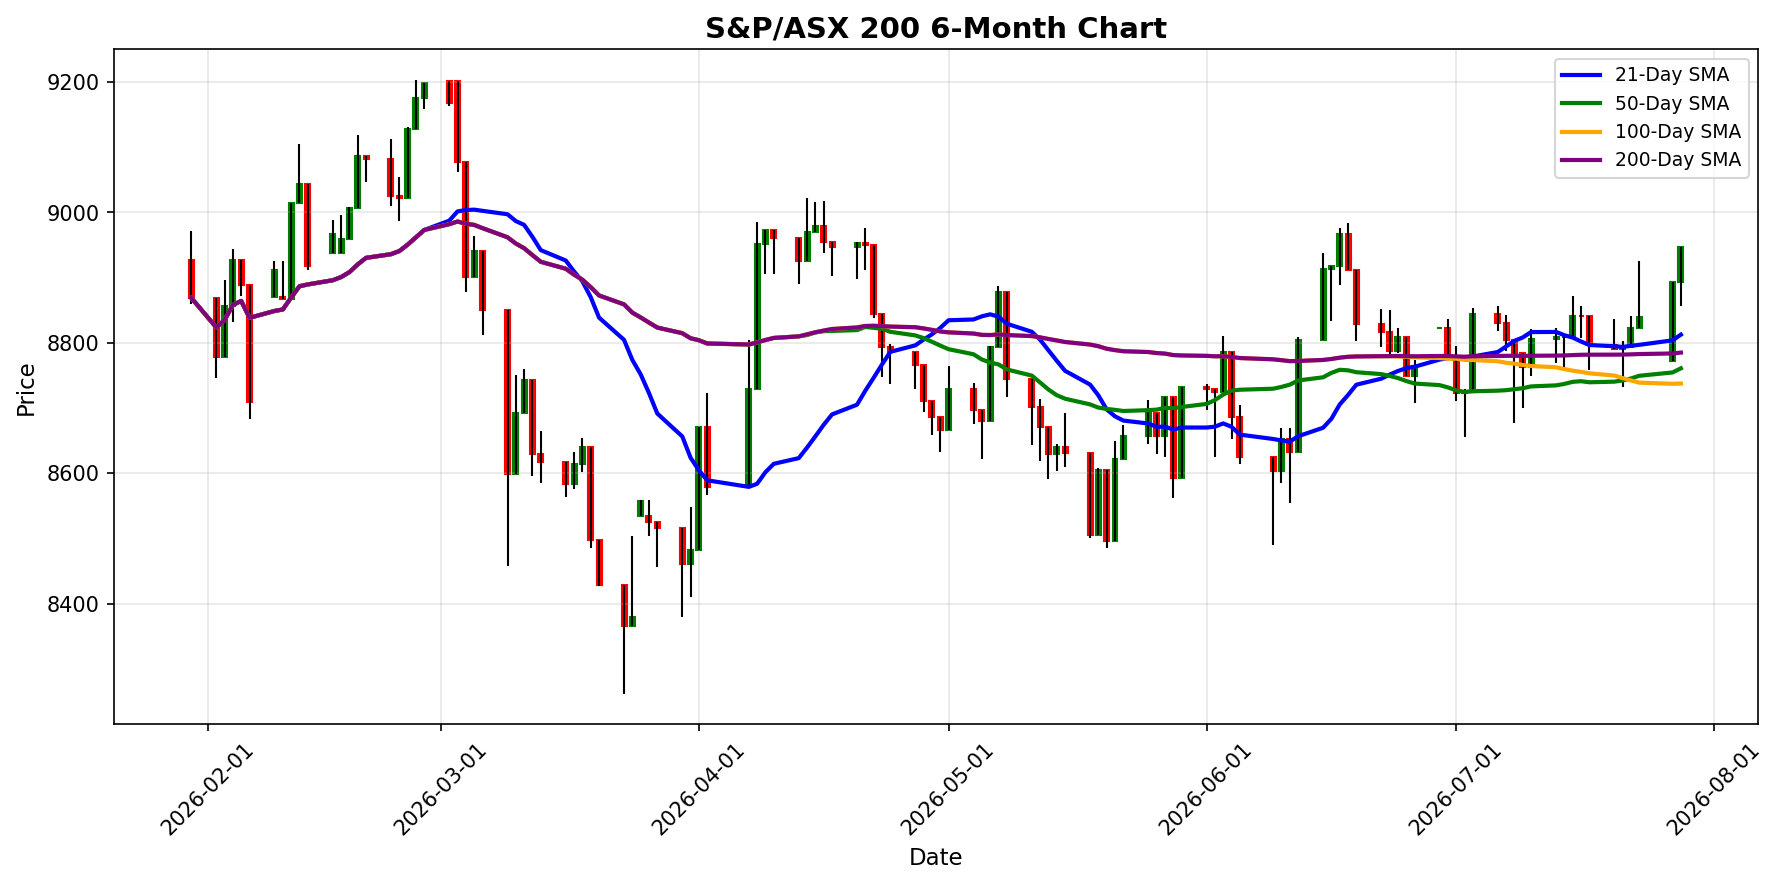
| S&P/ASX 200 | 8,947.80 | +0.60% |
| NIFTY 50 | 23,963.65 | -0.13% |
| Straits Times Index | 5,619.22 | -0.02% |
| S&P/NZX 50 | 13,861.93 | +0.08% |
| FTSE Bursa Malaysia KLCI | 1,712.48 | -0.04% |
| TAIEX | 41,603.36 | -4.65% |
📰 Market Commentary
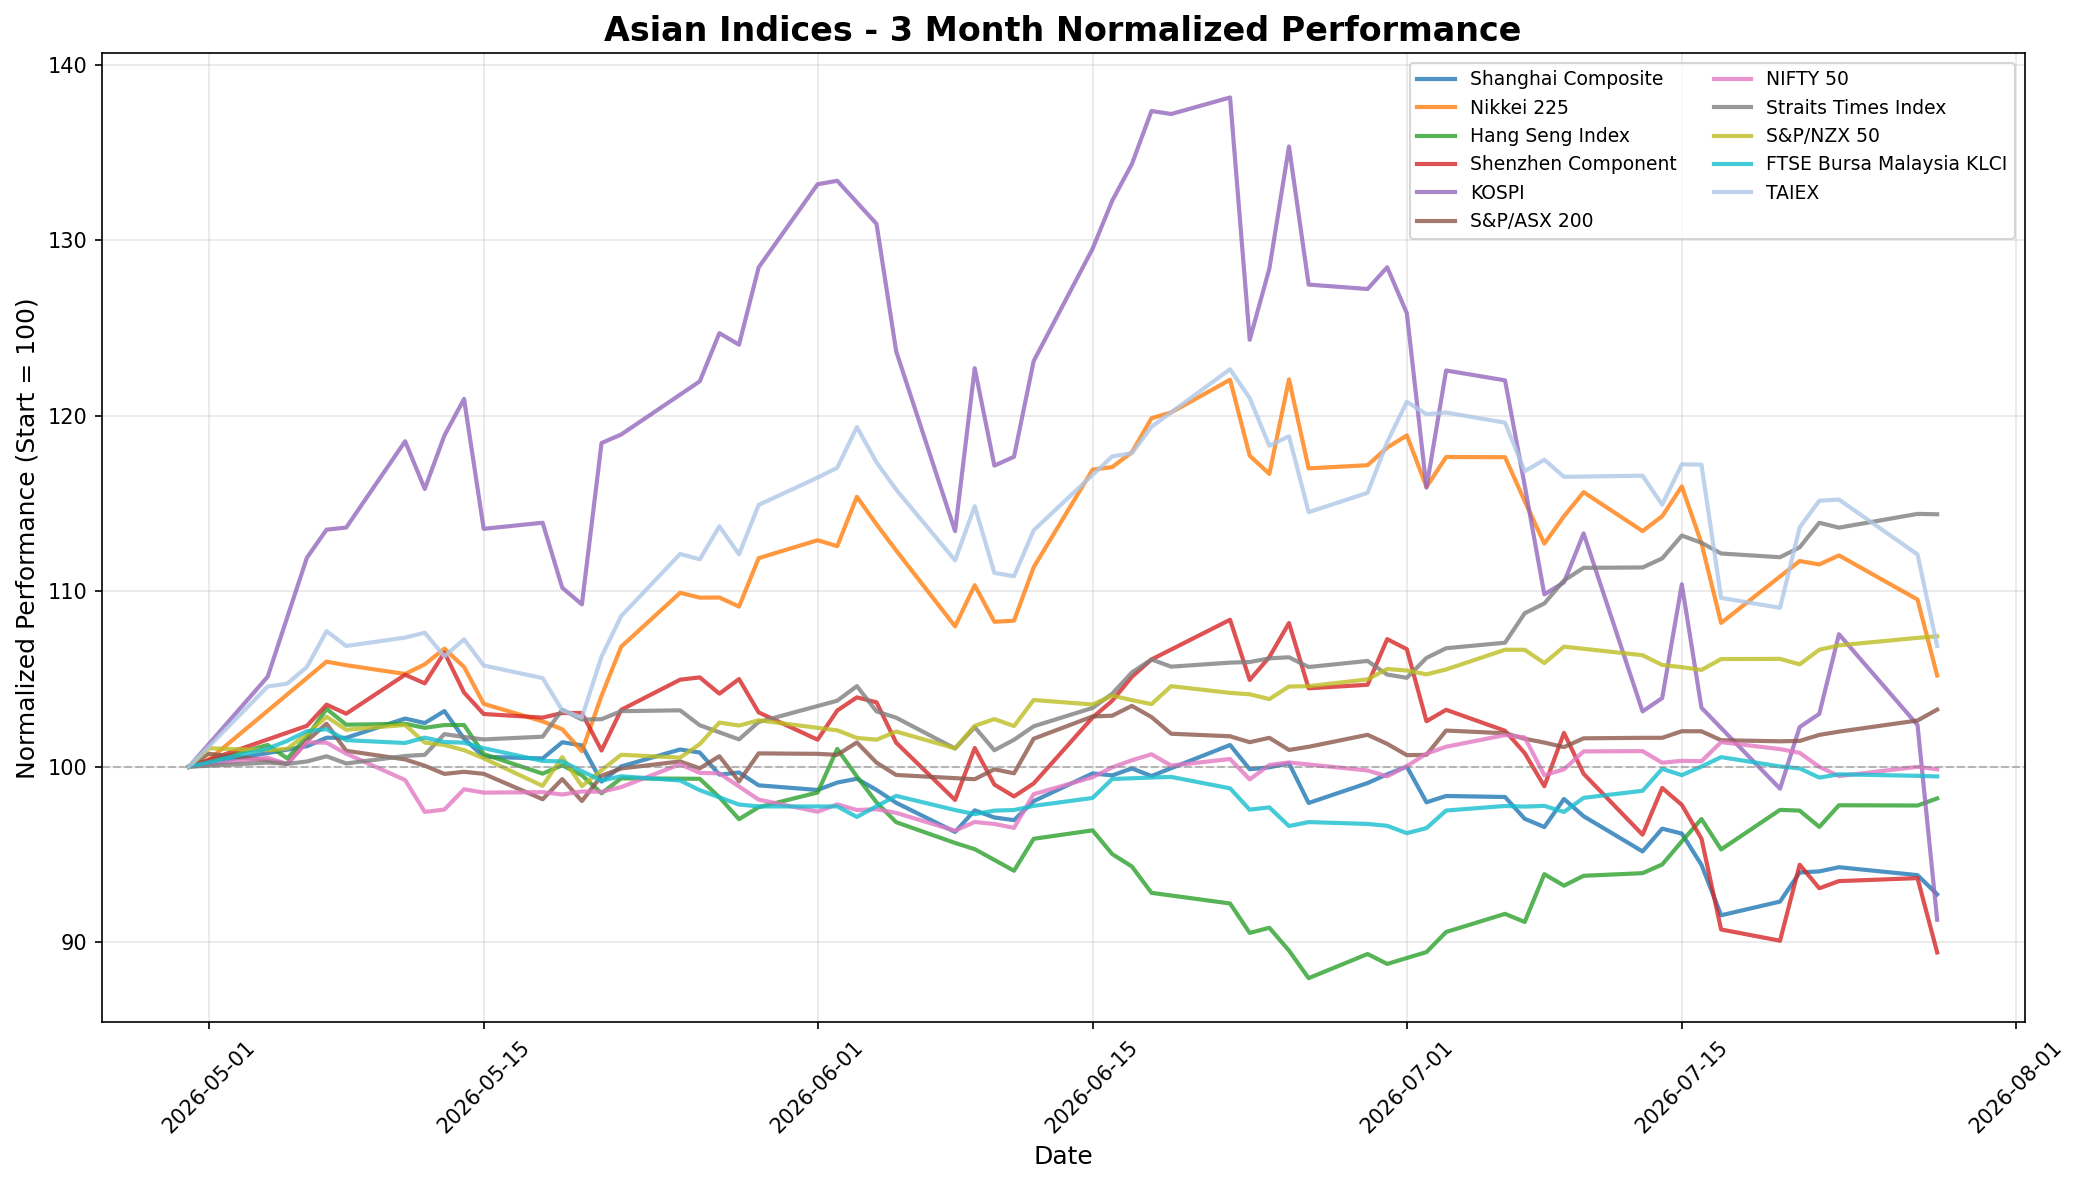
As of July 28, 2026, the Asian markets are experiencing significant volatility, primarily driven by concerns regarding the semiconductor sector and broader economic developments across the region. ### Key Events Impacting Asian Indices 1. **Nikkei 225 Decline**: The Nikkei 225 index fell sharply by 3.95%, closing at 62,364.92, marking a substantial drop of over 10,000 points from its record high. This decline is attributed to a selloff in semiconductor-related shares, driven by fears of intensified competition from China. 2. **Emerging Markets Under Pressure**: The broader Asian market is feeling the effects of a tech stock slump, with the regional benchmark dropping approximately 10% from its peak in June, pushing it towards a technical correction. Concerns over sustainability in AI spending and a deepening rout in chipmakers have exacerbated the situation. 3. **Chinese Luxury Jeweler's Loss**: Laopu Gold Co. lost $2.1 billion in market value after announcing a slowdown in sales growth, unsettling investors who had high expectations for the brand. ### Market Sentiment and Price Movements - **Mixed Sentiment**: While the Hang Seng Index saw a slight increase of 0.41%, other indices like the KOSPI and Shenzhen Component faced severe declines of 10.84% and 4.52%, respectively. The overall sentiment remains bearish, particularly in technology and related sectors. - **Sector-Specific Losses**: The semiconductor sector is under intense scrutiny, with fears of a funding circularity and increased competition from Chinese manufacturers leading to a significant selloff. This has contributed to a broader downturn in tech stocks across the region. ### Regional Economic Developments 1. **Hong Kong's Land Tender**: Hong Kong's first large-scale land disposal tender in the Northern Metropolis is being closely watched as it tests a new public-private partnership model aimed at housing and economic transformation. The market's response will provide insights into future investment opportunities. 2. **Singapore's Office Market Dynamics**: Singapore-based investors have emerged as the largest non-local buyers of commercial properties in Hong Kong, capitalizing on a significant correction in office asset prices, which have seen declines of up to 50%. This trend indicates a potential stabilization in the market as investor sentiment shifts. 3. **Indonesian Market Recovery**: In contrast to the broader regional downturn, Indonesian stocks have staged a remarkable turnaround, achieving bull market status after hitting a five-year low last month. This recovery is attributed to attractive valuations and a resurgence of foreign investment. 4. **Technological Advancements in Banking**: In Singapore, DBS Bank is enhancing its AI capabilities, transforming virtual assistants into digital agents for banking tasks, reflecting a broader trend in the region where financial institutions are increasingly adopting AI to improve customer service and operational efficiency. Overall, the Asian markets on July 28, 2026, are navigating through a complex landscape of technological challenges, shifting investment patterns, and evolving economic strategies, leading to pronounced volatility and mixed performance across various indices.
📅 Economic Calendar - Asian Session
All times are in US Eastern Time (ET)
No significant economic events during Asian session.
📈 Index Performance Charts
Best Performer: S&P/ASX 200
Worst Performer: KOSPI
💱 FX, Commodities & Crypto
### FX Pairs Performance 1. **USD/JPY**: Currently trading at 163.8280, the pair shows a slight daily increase of 0.08%. The Japanese yen remains under pressure due to ongoing monetary policy divergence between the Bank of Japan and the Federal Reserve. 2. **USD/CNY**: Priced at 6.7681, this pair has seen a daily increase of 0.20%. The Chinese yuan's performance is influenced by economic data releases and ongoing trade tensions, reflecting market sentiment regarding China's economic recovery. 3. **AUD/USD**: The Australian dollar is trading at 0.6976, down 0.24% for the day. This decline is attributed to weaker commodity prices and concerns over Australia's economic outlook, particularly in the mining sector. 4. **NZD/USD**: Currently at 0.5774, the New Zealand dollar has decreased by 0.07%. Similar to the AUD, the NZD is affected by commodity price fluctuations and global risk sentiment. ### Commodities Performance 1. **Gold**: Trading at $4,043.60, gold has decreased by 0.76%. The decline is driven by a stronger U.S. dollar and rising interest rates, which diminish gold's appeal as a non-yielding asset. 2. **Silver**: Priced at $57.81, silver has seen a more significant drop of 1.13%. The price movement reflects broader weakness in precious metals, influenced by industrial demand concerns and the overall economic outlook. 3. **Crude Oil (WTI)**: Currently at $80.89, WTI crude oil has dropped by 2.08%. This decline is primarily due
Currency Pairs
| Pair | Price | Daily Change (%) |
|---|---|---|
| USD/JPY | 163.83 | +0.08% |
| USD/CNY | 6.77 | +0.20% |
| AUD/USD | 0.70 | -0.24% |
| NZD/USD | 0.58 | -0.07% |
Commodities
| Commodity | Price | Daily Change (%) |
|---|---|---|
| Gold | $4043.60 | -0.76% |
| Silver | $57.81 | -1.13% |
| Crude Oil (WTI) | $80.89 | -2.08% |
Cryptocurrencies
| Asset | Price | Daily Change (%) |
|---|---|---|
| Bitcoin | $63,430 | -0.46% |
| Ethereum | $1,882 | -0.45% |
Disclaimer
The content on MarketsFN.com is provided for educational and informational purposes only. It does not constitute financial advice, investment recommendations, or trading guidance. All investments involve risks, and past performance does not guarantee future results. You are solely responsible for your investment decisions and should conduct independent research and consult a qualified financial advisor before acting. MarketsFN.com and its authors are not liable for any losses or damages arising from your use of this information.