The ETF developed a bullish channel, starting from the September lows of 16.19. After the double top made between April and May the drop was not irrelevant, with a -14% , but not too significant to call a bear market. The retracement of the September-May uptrend was just higher than 38.2%.
Now SLV is between the 21 day SMA and the 200 day SMA, with the former working as dynamic resistence and the latter as a dynamic support. Below the 200 day SMA SLV could test the dynamic channel in area 20, where the ETF also would test its 50% Fibonacci retracement.
Usually after a compression of volatility prices would start to trend again, but uncertainty about the direction suggest a more prudent approach.
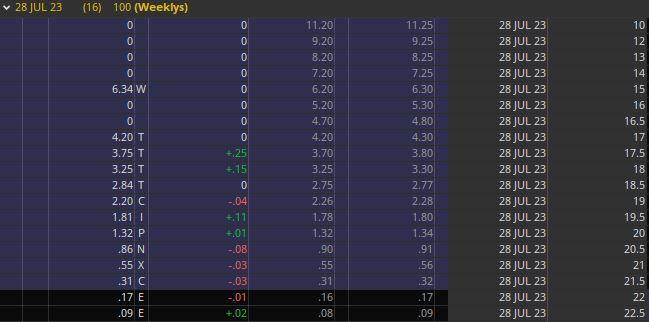
The channel and the 200 day SMA are valid bullish framework but lower highs have been made since May, plus both 21 day SMA and 55 day EMA are now resistance. The mix of elements in the analysis would be more fitted for a volatility trade setting.
At the time of writing is trading in premarket at 21.66$.
