Bitcoin Dips to $62K as RSI Hints at Potential Rebound
· Crypto · QuoteReporter
Bitcoin Dips to $62K as RSI Hints at Potential Rebound
Bitcoin (BTC/USD) | June 23, 2026 $62,332.0312 -2.53%
🔍 Technical Analysis
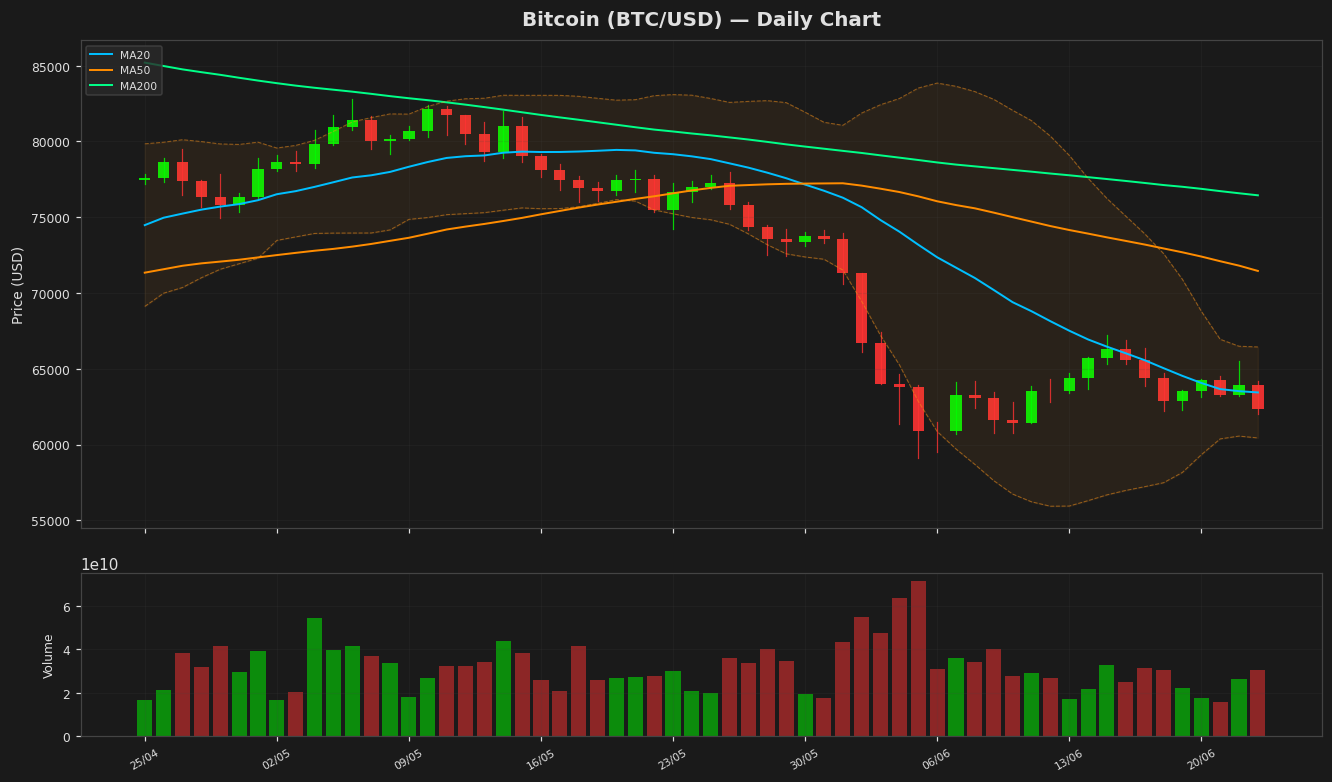
Bitcoin (BTC) is currently trading at $62,332, showing a daily decline of 2.53%. The price remains below key moving averages, with the 20-day MA at $63,437, the 50-day MA at $71,456, and the 200-day MA at $76,447, indicating a bearish trend in the medium to long term. The Bollinger Bands highlight volatility, with the upper band at $66,439 and the lower band at $60,436, suggesting potential consolidation between these levels. The RSI at 52.61 reflects neutral momentum, neither overbought nor oversold. The MACD histogram shows a bearish crossover, with the MACD line (-2003.65) below the signal line (-2371.31), reinforcing downward pressure. The ATR (14) at 1866.25 indicates moderate volatility. Key resistance levels are seen near the 20-day MA ($63,437) and the Bollinger upper band ($66,439), while support lies at the lower band ($60,436) and the psychological $60,000 level. The 52-week high ($116,273) and YTD high ($97,860) underscore the current downtrend from yearly peaks. A break below $60,000 could signal further downside, while reclaiming the 20-day MA may indicate short-term recovery. Traders should monitor these levels closely for directional cues.
Technical Metrics
| Metric | Value |
|---|---|
| Current Price | $62,332.0312 |
| Daily Change | -2.53% |
| MA 20 | $63,437.9029 |
| % from MA20 | -1.74% |
| MA 50 | $71,456.9970 |
| % from MA50 | -12.77% |
| MA 200 | $76,447.4871 |
| % from MA200 | -18.46% |
| BB Upper | $66,439.7168 |
| % from BB Upper | -6.18% |
| BB Lower | $60,436.0891 |
| % from BB Lower | +3.14% |
| RSI (14) | 52.62 |
| MACD | -2003.655187 |
| MACD Signal | -2371.311589 |
| ATR (14) | 1866.252232 |
| 3-Day High | $65,544.0000 |
| 3-Day Low | $61,992.1641 |
| 52-Week High | $116,273.3125 |
| % from 52W High | -46.39% |
| 52-Week Low | $59,108.9180 |
| % from 52W Low | +5.45% |
| YTD High | $97,860.6016 |
| % from YTD High | -36.31% |
| YTD Low | $59,108.9180 |
| % from YTD Low | +5.45% |
📊 Market Commentary
Bitcoin (BTC) is currently trading at $62,332.03, down 2.53% today, as the market shows signs of consolidation following recent volatility. The Relative Strength Index (RSI) at 52.6 suggests neutral momentum, indicating neither overbought nor oversold conditions. Over the past 52 weeks, Bitcoin has ranged between $59,108.92 and $116,273.31, reflecting significant price swings driven by macroeconomic factors, regulatory developments, and shifts in investor sentiment.
Market sentiment appears cautious, with traders closely monitoring key support and resistance levels. The $60,000 psychological level is seen as critical short-term support, while resistance near $65,000 could cap upward moves. A break below $60,000 may test the 52-week low, whereas sustained buying above $65,000 could signal renewed bullish interest.
Traders are also watching broader market indicators, including institutional flows, ETF activity, and macroeconomic data, particularly inflation trends and central bank policies. Bitcoin’s correlation with traditional markets remains a focal point, as risk appetite fluctuates. Additionally, on-chain metrics such as exchange reserves and miner activity are being scrutinized for signs of accumulation or distribution.
Despite the recent pullback, Bitcoin’s long-term fundamentals, including its fixed supply and adoption as a store of value, continue to underpin investor interest. However, near-term price action will likely hinge on market liquidity and macroeconomic conditions. For now, the market remains in a wait-and-see mode, with traders prepared for potential volatility in either direction.
Disclaimer
The content on MarketsFN.com is provided for educational and informational purposes only. It does not constitute financial advice or investment recommendations. All investments involve risk. Cryptocurrency markets are highly volatile. Past performance does not guarantee future results.