Bitcoin Hits $81K: RSI 68.8 Signals Potential Overbuy
· Crypto · QuoteReporter
Bitcoin Hits $81K: RSI 68.8 Signals Potential Overbuy
Bitcoin (BTC/USD) | May 05, 2026 $80,934.1172 +1.39%
🔍 Technical Analysis
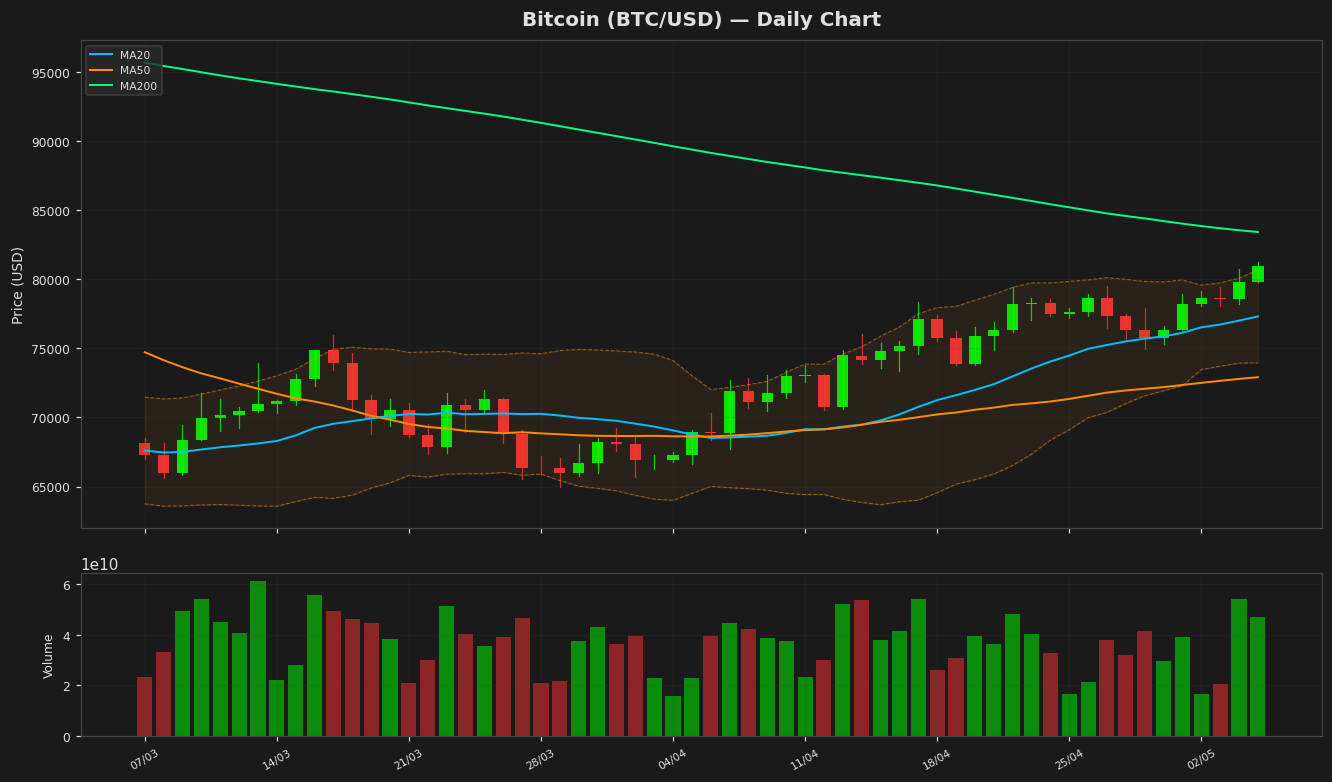
Bitcoin (BTC) is currently trading at $80,934.11, reflecting a daily increase of 1.39%. The price action shows bullish momentum as BTC remains above key moving averages. The 20-day moving average (MA20) stands at $77,310.90, providing immediate support, while the 50-day moving average (MA50) at $72,911.41 reinforces a longer-term bullish trend. However, the price is slightly below the 200-day moving average (MA200) at $83,416.47, indicating potential resistance if upward momentum stalls.
Analyzing Bollinger Bands, BTC is trading near the upper band of $80,669.93, suggesting overextension and a possible pullback if momentum wanes, with the lower band at $73,951.88 acting as a downside target in case of a reversal. The Relative Strength Index (RSI) at 68.76 indicates the asset is approaching overbought territory, warranting caution for short-term traders. Meanwhile, the MACD at 1,819.67 remains above the signal line of 1,702.01, confirming bullish momentum, though convergence could signal a slowdown.
Key support levels to watch are $77,310 (MA20) and $73,951 (BB Lower), while resistance lies at $83,416 (MA200) and the year-to-date high of $97,860.60. The ATR of 1,890.94 suggests moderate volatility, and traders should monitor for a breakout above resistance or a retreat to support for the next directional move.
Technical Metrics
| Metric | Value |
|---|---|
| Current Price | $80,934.1172 |
| Daily Change | +1.39% |
| MA 20 | $77,310.9020 |
| % from MA20 | +4.69% |
| MA 50 | $72,911.4119 |
| % from MA50 | +11.00% |
| MA 200 | $83,416.4716 |
| % from MA200 | -2.98% |
| BB Upper | $80,669.9287 |
| % from BB Upper | +0.33% |
| BB Lower | $73,951.8753 |
| % from BB Lower | +9.44% |
| RSI (14) | 68.76 |
| MACD | 1819.670968 |
| MACD Signal | 1702.010795 |
| ATR (14) | 1890.941964 |
| 3-Day High | $81,226.4219 |
| 3-Day Low | $78,073.0781 |
| 52-Week High | $126,198.0703 |
| % from 52W High | -35.87% |
| 52-Week Low | $60,074.2031 |
| % from 52W Low | +34.72% |
| YTD High | $97,860.6016 |
| % from YTD High | -17.30% |
| YTD Low | $60,074.2031 |
| % from YTD Low | +34.72% |
📊 Market Commentary
Bitcoin (BTC) is currently trading at $80,934.1172, reflecting a modest gain of 1.39% over the past 24 hours. Market sentiment appears cautiously optimistic as BTC continues to hover in the upper half of its 52-week range, which spans from a low of $60,074.2031 to a high of $126,198.0703. The Relative Strength Index (RSI) stands at 68.8, indicating that the asset is approaching overbought territory, though it remains below the critical threshold of 70. This suggests that while buying momentum is strong, there is still room for potential upside before technical indicators signal overextension.
Traders are closely monitoring key price levels in the near term. The $80,000 mark has emerged as a psychological support level, with sustained trading above it reinforcing bullish sentiment. On the upside, resistance near $85,000 is a focal point, as a break above this could signal further strength. Additionally, market participants are watching on-chain data and institutional activity, with recent inflows into Bitcoin ETFs and whale accumulation adding to the positive tone. Macroeconomic factors, including interest rate expectations and geopolitical developments, also remain in focus as they continue to influence risk asset sentiment. For now, the market appears to be in a consolidation phase, with traders assessing whether current momentum can push BTC toward higher resistance levels while keeping an eye on potential profit-taking pressures.
Traders are closely monitoring key price levels in the near term. The $80,000 mark has emerged as a psychological support level, with sustained trading above it reinforcing bullish sentiment. On the upside, resistance near $85,000 is a focal point, as a break above this could signal further strength. Additionally, market participants are watching on-chain data and institutional activity, with recent inflows into Bitcoin ETFs and whale accumulation adding to the positive tone. Macroeconomic factors, including interest rate expectations and geopolitical developments, also remain in focus as they continue to influence risk asset sentiment. For now, the market appears to be in a consolidation phase, with traders assessing whether current momentum can push BTC toward higher resistance levels while keeping an eye on potential profit-taking pressures.
Disclaimer
The content on MarketsFN.com is provided for educational and informational purposes only. It does not constitute financial advice or investment recommendations. All investments involve risk. Cryptocurrency markets are highly volatile. Past performance does not guarantee future results.