Bitcoin Holds $61.5K as RSI Nears Oversold Territory
· Crypto · QuoteReporter
Bitcoin Holds $61.5K as RSI Nears Oversold Territory
Bitcoin (BTC/USD) | July 03, 2026 $61,506.5898 +0.03%
🔍 Technical Analysis
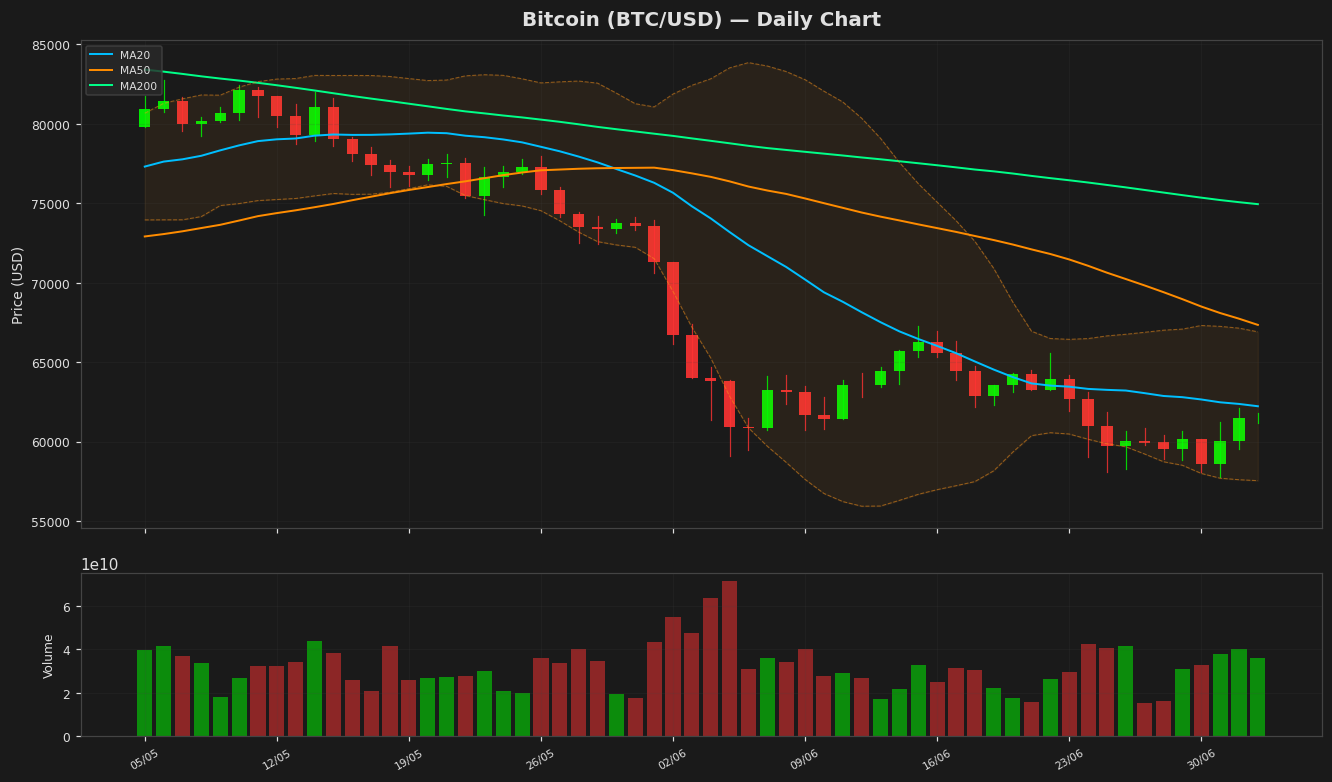
Bitcoin is currently trading at $61,506, showing minimal daily movement with a slight gain of 0.03%. The price remains below the 20-day moving average (MA20) at $62,222, indicating short-term bearish pressure, while the 50-day (MA50) and 200-day (MA200) moving averages at $67,343 and $74,945, respectively, reinforce a broader downtrend. The Bollinger Bands highlight volatility compression, with the upper band at $66,907 and the lower band at $57,538, suggesting potential for a breakout if price action breaches either boundary. The RSI at 41.9 reflects neutral to slightly bearish momentum, lacking strong directional bias. The MACD histogram at -1,858 remains below the signal line (-2,179), confirming bearish divergence but showing signs of potential weakening in downward momentum. Key support lies near the yearly low of $57,747, while resistance is observed around the MA20 and the upper Bollinger Band. The ATR of 2,175 indicates moderate volatility, suggesting cautious trading. Bitcoin’s inability to reclaim higher moving averages signals persistent selling pressure, though a break above $66,907 could shift sentiment. The 52-week high at $116,273 underscores the significant downside from peak levels, while the YTD high at $97,860 remains a critical recovery target.
Technical Metrics
| Metric | Value |
|---|---|
| Current Price | $61,506.5898 |
| Daily Change | +0.03% |
| MA 20 | $62,222.6098 |
| % from MA20 | -1.15% |
| MA 50 | $67,343.9120 |
| % from MA50 | -8.67% |
| MA 200 | $74,945.1284 |
| % from MA200 | -17.93% |
| BB Upper | $66,907.1815 |
| % from BB Upper | -8.07% |
| BB Lower | $57,538.0380 |
| % from BB Lower | +6.90% |
| RSI (14) | 41.90 |
| MACD | -1858.691897 |
| MACD Signal | -2179.036114 |
| ATR (14) | 2175.038504 |
| 3-Day High | $62,117.8750 |
| 3-Day Low | $57,747.7656 |
| 52-Week High | $116,273.3125 |
| % from 52W High | -47.10% |
| 52-Week Low | $57,747.7656 |
| % from 52W Low | +6.51% |
| YTD High | $97,860.6016 |
| % from YTD High | -37.15% |
| YTD Low | $57,747.7656 |
| % from YTD Low | +6.51% |
📊 Market Commentary
Bitcoin (BTC) is trading at $61,506.5898, showing minimal movement with a slight gain of 0.03% today. The Relative Strength Index (RSI) stands at 41.9, indicating neutral to slightly oversold conditions, suggesting potential consolidation or a pause in recent downward pressure. Over the past 52 weeks, BTC has fluctuated between $57,747.7656 and $116,273.3125, reflecting significant volatility amid macroeconomic uncertainty and shifting risk appetite in crypto markets.
Market sentiment remains cautious as traders assess macroeconomic factors, including inflation data and central bank policies, which continue to influence risk assets. The $60,000 level is a key psychological support zone, with a sustained break below potentially leading to further downside toward the yearly low near $57,700. On the upside, resistance is seen around $63,000-$65,000, where previous buying interest has faded.
Traders are closely monitoring Bitcoin’s correlation with traditional markets, particularly equities, as well as on-chain metrics such as exchange flows and whale activity. The current RSI suggests neither strong bullish nor bearish momentum, leaving room for sideways movement unless a clear catalyst emerges. With liquidity thinning in the summer months, volatility could remain subdued unless unexpected macroeconomic or regulatory developments arise. For now, the market appears to be in a holding pattern, awaiting clearer signals.
Disclaimer
The content on MarketsFN.com is provided for educational and informational purposes only. It does not constitute financial advice or investment recommendations. All investments involve risk. Cryptocurrency markets are highly volatile. Past performance does not guarantee future results.