Tron Eyes Recovery as RSI Nears Oversold at $0.3193
· Crypto · QuoteReporter
Tron Eyes Recovery as RSI Nears Oversold at $0.3193
Tron (TRX/USD) | July 03, 2026 $0.3193 +0.66%
🔍 Technical Analysis
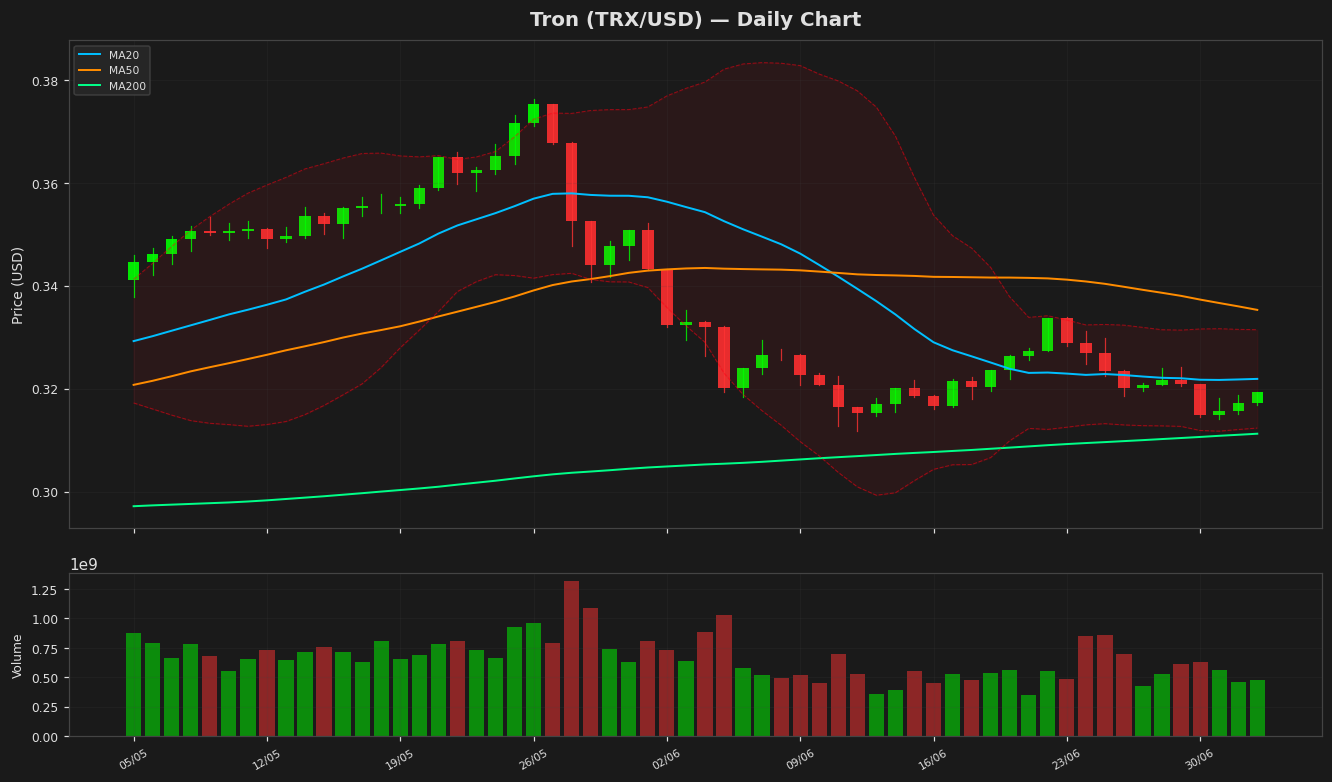
Tron (TRX) is currently trading at $0.319263, showing a modest daily gain of 0.66%. The price remains below both the 20-day moving average (MA20) at $0.321889 and the 50-day moving average (MA50) at $0.335293, indicating short-term bearish pressure. However, it holds above the 200-day moving average (MA200) at $0.311235, suggesting a longer-term bullish foundation. The Bollinger Bands reveal a narrowing range, with the upper band at $0.33144 and the lower band at $0.312337, signaling reduced volatility and potential for a breakout. The RSI(14) stands at 43.959372, hovering near neutral territory but leaning slightly bearish, lacking strong momentum in either direction. The MACD histogram shows a minor negative value of -0.003718, with the signal line at -0.003811, reflecting weak bearish momentum but no strong divergence. Key resistance levels to watch are the MA20 at $0.321889 and the yearly high at $0.37633201. Support lies at the MA200 ($0.311235) and the 52-week low of $0.26813799. The Average True Range (ATR) of 0.004503 indicates low volatility, suggesting cautious trading until a clearer trend emerges.
Technical Metrics
| Metric | Value |
|---|---|
| Current Price | $0.3193 |
| Daily Change | +0.66% |
| MA 20 | $0.3219 |
| % from MA20 | -0.82% |
| MA 50 | $0.3353 |
| % from MA50 | -4.78% |
| MA 200 | $0.3112 |
| % from MA200 | +2.58% |
| BB Upper | $0.3314 |
| % from BB Upper | -3.67% |
| BB Lower | $0.3123 |
| % from BB Lower | +2.22% |
| RSI (14) | 43.96 |
| MACD | -0.003718 |
| MACD Signal | -0.003811 |
| ATR (14) | 0.004503 |
| 3-Day High | $0.3193 |
| 3-Day Low | $0.3140 |
| 52-Week High | $0.3763 |
| % from 52W High | -15.16% |
| 52-Week Low | $0.2681 |
| % from 52W Low | +19.07% |
| YTD High | $0.3763 |
| % from YTD High | -15.16% |
| YTD Low | $0.2681 |
| % from YTD Low | +19.07% |
📊 Market Commentary
Tron (TRX) is trading at $0.3193, up 0.66% today, as the broader crypto market shows cautious optimism. The Relative Strength Index (RSI) at 44.0 suggests TRX is neither overbought nor oversold, hovering near neutral territory. This indicates a balanced market sentiment, with no clear dominance of buyers or sellers in the short term. Over the past 52 weeks, TRX has fluctuated between $0.2681 and $0.3763, with the current price sitting closer to the mid-range, reflecting a consolidation phase.
Traders are closely watching key support and resistance levels. Immediate support lies around $0.3100, a psychological level that has held firm in recent weeks. A break below this could test the yearly low of $0.2681. On the upside, resistance is seen near $0.3400, followed by the yearly high of $0.3763. Sustained buying pressure would need to overcome these levels to signal a stronger bullish trend.
Market sentiment for TRX remains mixed, influenced by broader crypto trends and network developments. Tron’s consistent transaction volume and active ecosystem provide underlying support, but macroeconomic factors and Bitcoin’s price movements continue to sway trader confidence. For now, TRX appears range-bound, with traders awaiting a decisive breakout or breakdown for clearer directional bias. Monitoring trading volume and RSI shifts will be crucial in assessing near-term momentum.
Disclaimer
The content on MarketsFN.com is provided for educational and informational purposes only. It does not constitute financial advice or investment recommendations. All investments involve risk. Cryptocurrency markets are highly volatile. Past performance does not guarantee future results.