Ethereum Eyes $1,750 as RSI Nears Key Breakout Level
· Crypto · QuoteReporter
Ethereum Eyes $1,750 as RSI Nears Key Breakout Level
Ethereum (ETH/USD) | July 03, 2026 $1,718.4600 +1.19%
🔍 Technical Analysis
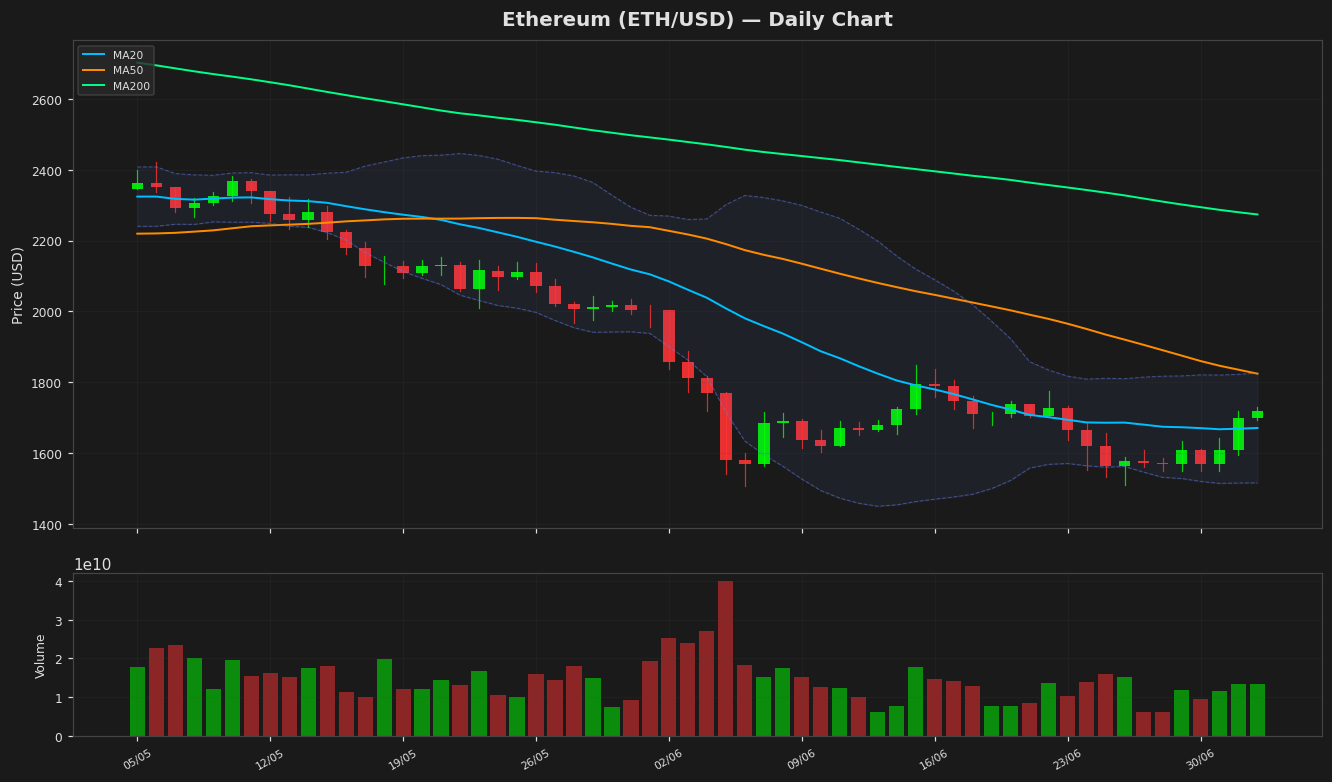
Ethereum (ETH) is currently trading at $1,718.46, showing a modest daily gain of 1.19%. The price action remains within a consolidation phase, hovering between the 20-day moving average (MA20) at $1,671.14 and the 50-day moving average (MA50) at $1,824.41. The MA200 at $2,273.81 continues to act as a long-term resistance level, reflecting the broader bearish trend. Bollinger Bands indicate moderate volatility, with the upper band at $1,826.08 and the lower band at $1,516.21, suggesting potential resistance near $1,826 and support around $1,516. The RSI at 50.76 is neutral, indicating neither overbought nor oversold conditions, while the MACD histogram at -49.08 remains below the signal line (-68.44), signaling weak bullish momentum. Key support levels are $1,516 (Bollinger lower band) and $1,506 (52-week low), while resistance is seen at $1,826 (Bollinger upper band) and $1,824 (MA50). The ATR of 76.41 suggests moderate price volatility. Ethereum faces significant overhead resistance at its YTD high of $3,397.90, while downside risks persist if it breaches $1,506. The market awaits a decisive breakout for directional clarity.
Technical Metrics
| Metric | Value |
|---|---|
| Current Price | $1,718.4600 |
| Daily Change | +1.19% |
| MA 20 | $1,671.1445 |
| % from MA20 | +2.83% |
| MA 50 | $1,824.4144 |
| % from MA50 | -5.81% |
| MA 200 | $2,273.8117 |
| % from MA200 | -24.42% |
| BB Upper | $1,826.0772 |
| % from BB Upper | -5.89% |
| BB Lower | $1,516.2119 |
| % from BB Lower | +13.34% |
| RSI (14) | 50.76 |
| MACD | -49.076460 |
| MACD Signal | -68.435022 |
| ATR (14) | 76.415231 |
| 3-Day High | $1,729.3793 |
| 3-Day Low | $1,551.1393 |
| 52-Week High | $4,250.6699 |
| % from 52W High | -59.57% |
| 52-Week Low | $1,506.5057 |
| % from 52W Low | +14.07% |
| YTD High | $3,397.8977 |
| % from YTD High | -49.43% |
| YTD Low | $1,506.5057 |
| % from YTD Low | +14.07% |
📊 Market Commentary
Ethereum (ETH) is trading at $1,718.46, up 1.19% today, as the broader crypto market shows cautious optimism. The Relative Strength Index (RSI) at 50.8 indicates neutral momentum, neither overbought nor oversold, suggesting a balanced market sentiment. ETH remains within its 52-week range of $1,506.51 to $4,250.67, reflecting the volatility and broader market conditions over the past year.
Market sentiment for Ethereum is mixed, with traders closely monitoring macroeconomic factors, including interest rate expectations and institutional adoption. The recent approval of spot Bitcoin ETFs has sparked discussions about potential Ethereum ETF applications, adding to the narrative around ETH’s long-term utility. However, short-term price action remains influenced by liquidity flows and technical levels.
Key price levels to watch include the psychological $1,700 support, which has held firm in recent sessions. A break below this level could see ETH test the yearly low near $1,506, while sustained buying pressure above $1,750 may open the path toward $1,800 resistance. Traders are also observing Ethereum’s network activity, including gas fees and DeFi TVL, for signs of increasing demand.
With the RSI hovering near the midpoint, neither bulls nor bears have clear dominance, leaving ETH in a consolidation phase. Market participants remain cautious, awaiting clearer signals from both technical indicators and broader macroeconomic trends before establishing stronger directional bias.
Disclaimer
The content on MarketsFN.com is provided for educational and informational purposes only. It does not constitute financial advice or investment recommendations. All investments involve risk. Cryptocurrency markets are highly volatile. Past performance does not guarantee future results.