Solana Price Hits $80.94, RSI at 70 as Bulls Push Higher
· Crypto · QuoteReporter
Solana Price Hits $80.94, RSI at 70 as Bulls Push Higher
Solana (SOL/USD) | July 03, 2026 $80.9400 +0.37%
🔍 Technical Analysis
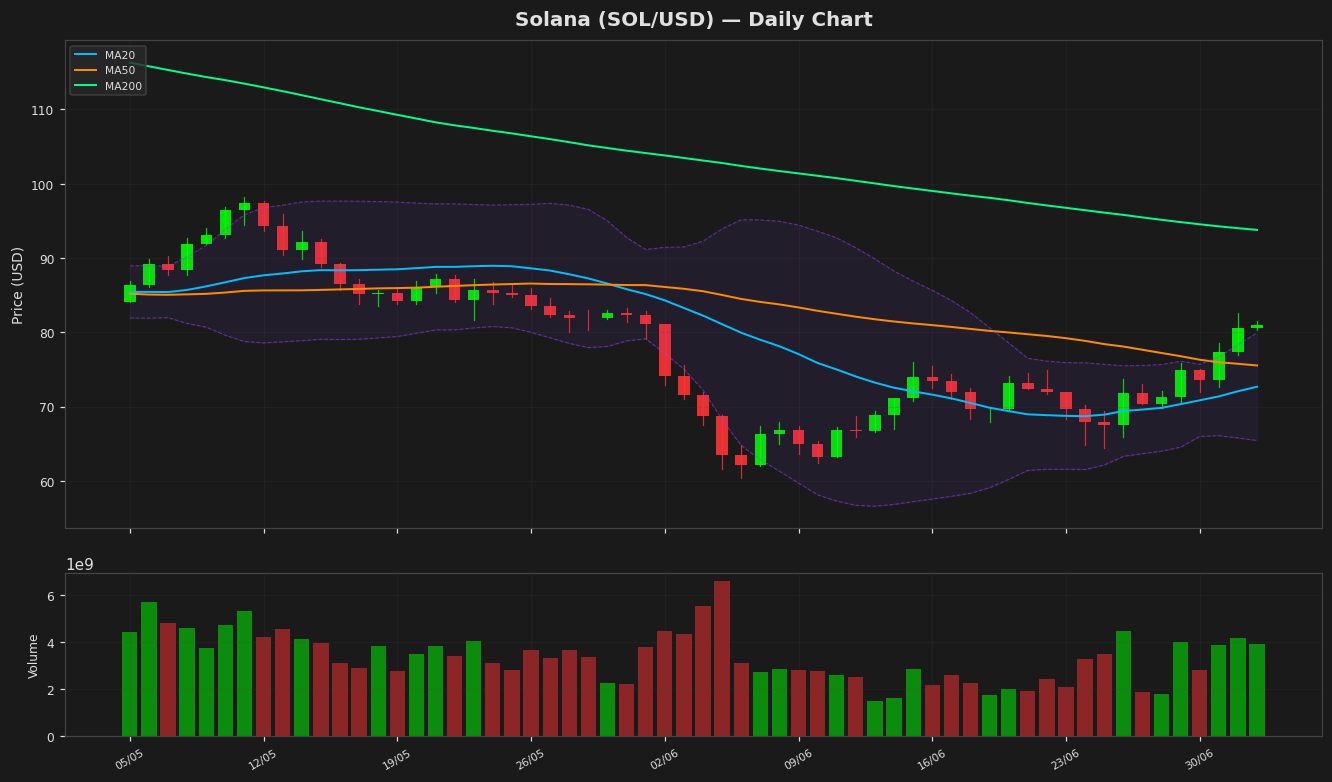
Solana (SOL) is currently trading at $80.94, showing a modest daily gain of 0.37%. The price action remains bullish, with SOL holding above key moving averages. The MA20 at $72.67 and MA50 at $75.54 are trending upward, indicating short-term strength, while the MA200 at $93.78 acts as a potential resistance level. The Bollinger Bands show volatility contraction, with the upper band at $79.91 and the lower band at $65.43, suggesting a potential breakout if volatility expands. The RSI(14) at 69.95 is approaching overbought territory but hasn’t crossed the 70 threshold, leaving room for further upside. The MACD histogram at 1.08 is above the signal line (-0.47), confirming bullish momentum. Key support levels are at $75.50 (MA50) and $72.67 (MA20), while resistance is seen at $93.78 (MA200) and the YTD high of $148.21. The ATR(14) at 4.14 indicates moderate volatility. Solana’s 52-week range ($60.41 to $205.02) highlights its potential for significant moves. Traders should watch for a breakout above the MA200 or a pullback to the MA20 for confirmation of trend continuation.
Technical Metrics
| Metric | Value |
|---|---|
| Current Price | $80.9400 |
| Daily Change | +0.37% |
| MA 20 | $72.6767 |
| % from MA20 | +11.37% |
| MA 50 | $75.5400 |
| % from MA50 | +7.15% |
| MA 200 | $93.7802 |
| % from MA200 | -13.69% |
| BB Upper | $79.9138 |
| % from BB Upper | +1.28% |
| BB Lower | $65.4396 |
| % from BB Lower | +23.69% |
| RSI (14) | 69.95 |
| MACD | 1.086651 |
| MACD Signal | -0.472578 |
| ATR (14) | 4.149665 |
| 3-Day High | $82.5987 |
| 3-Day Low | $72.5937 |
| 52-Week High | $205.0201 |
| % from 52W High | -60.52% |
| 52-Week Low | $60.4147 |
| % from 52W Low | +33.97% |
| YTD High | $148.2160 |
| % from YTD High | -45.39% |
| YTD Low | $60.4147 |
| % from YTD Low | +33.97% |
📊 Market Commentary
Solana (SOL) is currently trading at $80.94, showing a modest gain of 0.37% today. The Relative Strength Index (RSI) stands at 70.0, indicating that SOL is approaching overbought territory, which could signal potential consolidation or a pullback if buying pressure eases. Over the past 52 weeks, SOL has fluctuated between $60.41 and $205.02, reflecting significant volatility and a wide trading range.
Market sentiment around Solana remains cautiously optimistic, supported by its strong ecosystem growth and high-speed transaction capabilities. Traders are closely monitoring the $80 level as a key psychological support zone, with a break below potentially testing the next support near $75. On the upside, resistance is seen around $85, a level that has acted as a barrier in recent weeks. A sustained move above this could open the door for a retest of higher levels, though the overbought RSI suggests near-term caution.
Network activity and developer engagement continue to be focal points for SOL, as positive developments in its ecosystem often correlate with price momentum. However, broader market conditions, including Bitcoin's performance and macroeconomic factors, remain influential. Traders are also watching trading volumes, as declining volume amid rising prices could signal weakening momentum. For now, SOL appears to be in a consolidation phase, with market participants weighing technical indicators against fundamental strengths.
Disclaimer
The content on MarketsFN.com is provided for educational and informational purposes only. It does not constitute financial advice or investment recommendations. All investments involve risk. Cryptocurrency markets are highly volatile. Past performance does not guarantee future results.