BNB Eyes Recovery at $562 as RSI Hints Oversold Bounce
· Crypto · QuoteReporter
BNB Eyes Recovery at $562 as RSI Hints Oversold Bounce
BNB (BNB/USD) | July 03, 2026 $562.2100 +0.75%
🔍 Technical Analysis
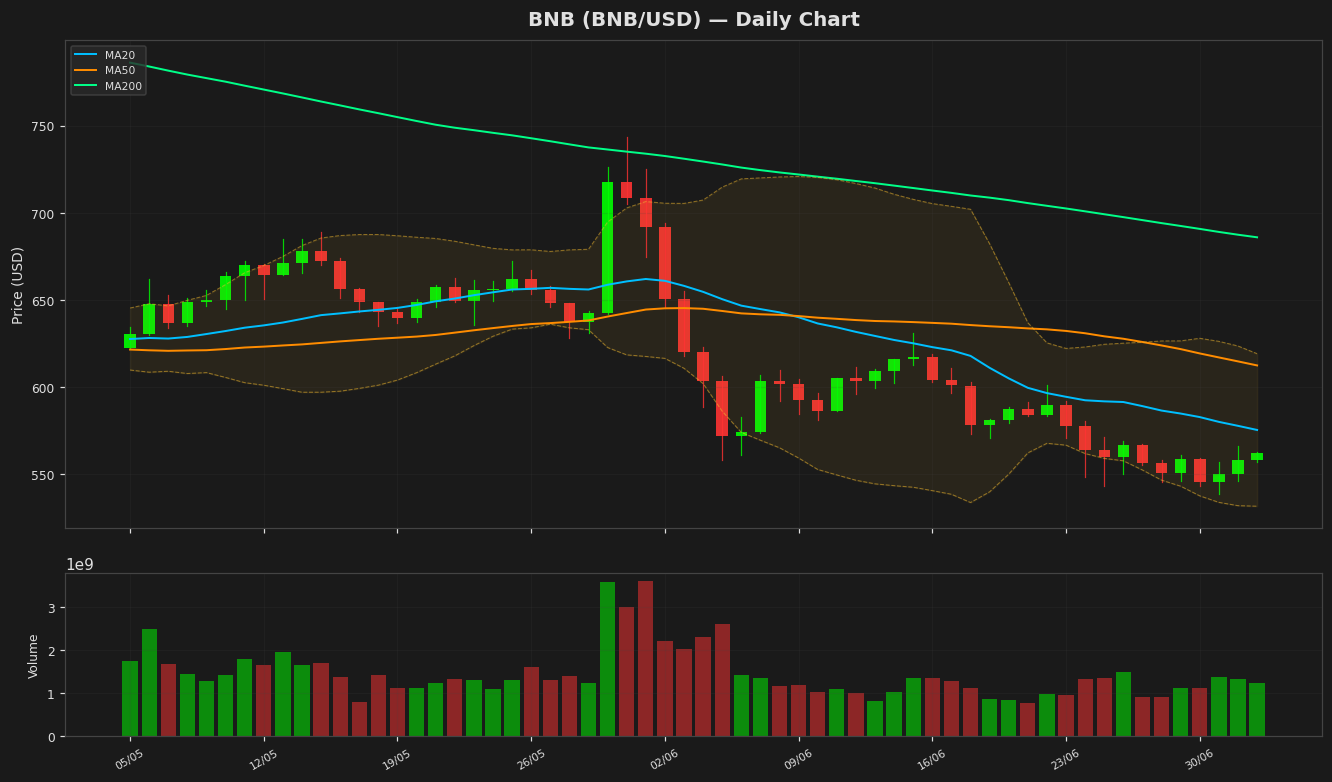
BNB is currently trading at $562.21, showing a modest daily gain of 0.75%. The price remains below key moving averages, indicating a bearish trend in the short to medium term. The 20-day MA at $575.45 and the 50-day MA at $612.47 act as immediate resistance levels, while the 200-day MA at $685.96 underscores a longer-term downtrend. Bollinger Bands reveal a narrowing range, with the upper band at $619.20 and the lower band at $531.71, suggesting reduced volatility. The price hovering near the lower band indicates potential oversold conditions.
The RSI at 41.17 reflects neutral to slightly bearish momentum, lacking strong directional bias. The MACD histogram at -16.48 remains below the signal line (-16.97), reinforcing bearish sentiment, though the narrowing gap hints at a possible slowdown in downward momentum. Key support lies at the yearly low of $538.60, while resistance is seen at the 20-day MA ($575.45) and the upper Bollinger Band ($619.20). A break below $538.60 could trigger further declines, whereas reclaiming the 20-day MA may signal a short-term recovery. The ATR at 16.71 suggests moderate price volatility, warranting caution in near-term trades.
The RSI at 41.17 reflects neutral to slightly bearish momentum, lacking strong directional bias. The MACD histogram at -16.48 remains below the signal line (-16.97), reinforcing bearish sentiment, though the narrowing gap hints at a possible slowdown in downward momentum. Key support lies at the yearly low of $538.60, while resistance is seen at the 20-day MA ($575.45) and the upper Bollinger Band ($619.20). A break below $538.60 could trigger further declines, whereas reclaiming the 20-day MA may signal a short-term recovery. The ATR at 16.71 suggests moderate price volatility, warranting caution in near-term trades.
Technical Metrics
| Metric | Value |
|---|---|
| Current Price | $562.2100 |
| Daily Change | +0.75% |
| MA 20 | $575.4541 |
| % from MA20 | -2.30% |
| MA 50 | $612.4740 |
| % from MA50 | -8.21% |
| MA 200 | $685.9638 |
| % from MA200 | -18.04% |
| BB Upper | $619.1964 |
| % from BB Upper | -9.20% |
| BB Lower | $531.7118 |
| % from BB Lower | +5.74% |
| RSI (14) | 41.17 |
| MACD | -16.482002 |
| MACD Signal | -16.965249 |
| ATR (14) | 16.707541 |
| 3-Day High | $566.0003 |
| 3-Day Low | $538.5992 |
| 52-Week High | $1,180.0149 |
| % from 52W High | -52.36% |
| 52-Week Low | $538.5992 |
| % from 52W Low | +4.38% |
| YTD High | $954.8583 |
| % from YTD High | -41.12% |
| YTD Low | $538.5992 |
| % from YTD Low | +4.38% |
📊 Market Commentary
BNB is trading at $562.21, up 0.75% today, as the broader crypto market shows cautious optimism. The Relative Strength Index (RSI) at 41.2 suggests BNB is neither overbought nor oversold, hovering near neutral territory. Over the past 52 weeks, BNB has ranged between $538.60 and $1,180.01, reflecting significant volatility amid shifting market conditions. The current price sits near the lower end of this range, indicating potential consolidation or accumulation phases.
Market sentiment for BNB remains mixed. While the slight uptick today aligns with modest buying interest, the lack of strong momentum suggests traders are awaiting clearer signals. Key support at $538.60, the 52-week low, is critical; a sustained break below could trigger further downside. On the upside, resistance near $600 may act as a psychological barrier, with stronger resistance levels likely around $650 and $700.
Traders are closely monitoring BNB’s correlation with Bitcoin and Ethereum, as well as developments within the Binance ecosystem, including regulatory updates and platform adoption. The RSI’s position leaves room for either direction, but without a decisive catalyst, sideways trading may persist. Volume trends and macroeconomic factors, such as Fed policy and institutional inflows, will also influence BNB’s near-term trajectory. For now, the market remains in a wait-and-see mode.
Disclaimer
The content on MarketsFN.com is provided for educational and informational purposes only. It does not constitute financial advice or investment recommendations. All investments involve risk. Cryptocurrency markets are highly volatile. Past performance does not guarantee future results.