Ripple Eyes Recovery as RSI Nears Oversold at $1.10
· Crypto · QuoteReporter
Ripple Eyes Recovery as RSI Nears Oversold at $1.10
Ripple (XRP/USD) | July 03, 2026 $1.0987 +1.12%
🔍 Technical Analysis
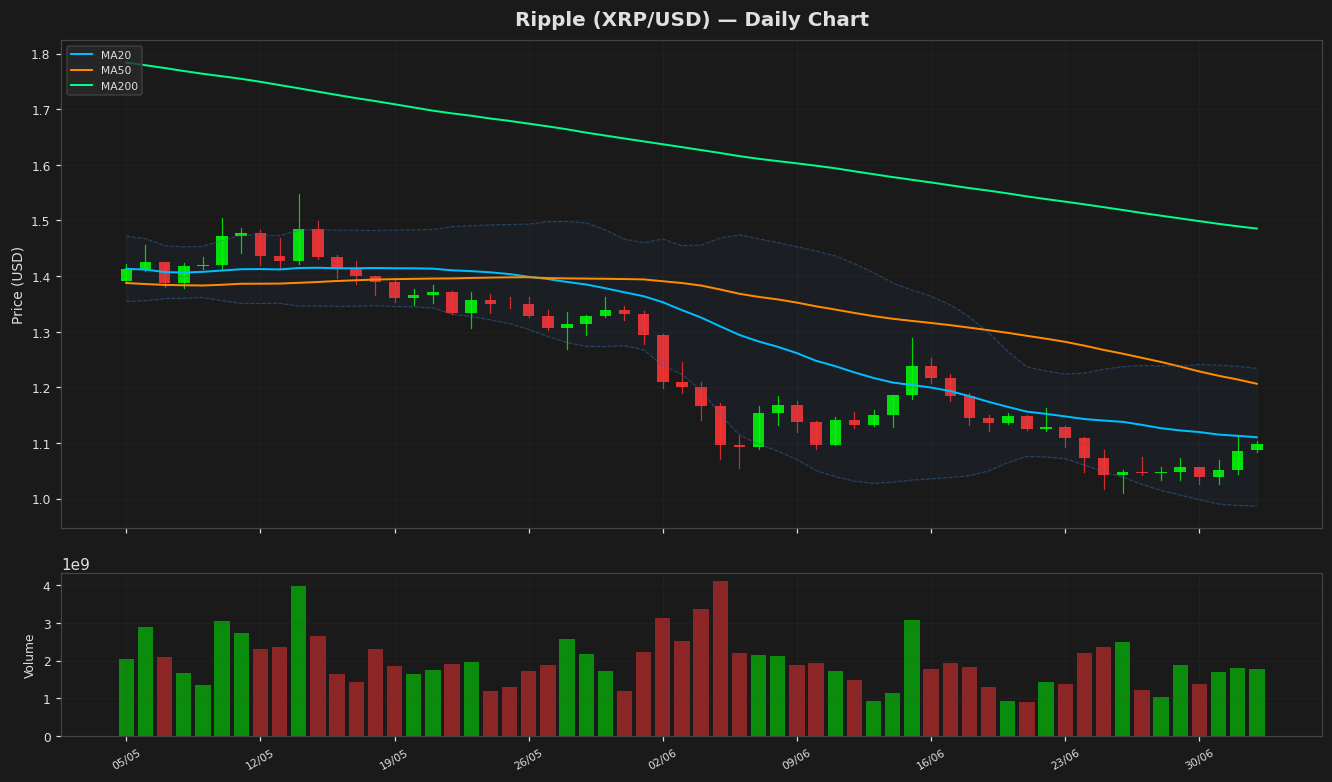
Ripple (XRP) is currently trading at $1.098700, showing a modest daily gain of 1.12%. The price remains below key moving averages, indicating bearish pressure in the medium to long term. The MA20 at $1.110325 and MA50 at $1.20642 act as immediate resistance levels, while the MA200 at $1.48553 underscores a broader downtrend. Bollinger Bands highlight volatility, with the upper band at $1.234302 and the lower band at $0.986349, suggesting potential resistance near $1.23 and support around $0.98. The RSI(14) at 41.61 reflects neutral to slightly bearish momentum, lacking strong directional bias. The MACD histogram at -0.039707 remains below the signal line (-0.046079), indicating persistent bearish momentum, though the narrowing gap suggests weakening downside pressure. The ATR(14) at 0.039603 points to moderate volatility. Key support lies at the 52-week low of $1.00975299, while resistance is observed at the YTD high of $2.41026402. A break above the MA20 could signal short-term bullish potential, but sustained momentum above the MA50 is needed for a stronger recovery. The current technical setup suggests consolidation with a cautious outlook unless key resistance levels are breached.
Technical Metrics
| Metric | Value |
|---|---|
| Current Price | $1.0987 |
| Daily Change | +1.12% |
| MA 20 | $1.1103 |
| % from MA20 | -1.05% |
| MA 50 | $1.2064 |
| % from MA50 | -8.93% |
| MA 200 | $1.4855 |
| % from MA200 | -26.04% |
| BB Upper | $1.2343 |
| % from BB Upper | -10.99% |
| BB Lower | $0.9863 |
| % from BB Lower | +11.39% |
| RSI (14) | 41.61 |
| MACD | -0.039707 |
| MACD Signal | -0.046079 |
| ATR (14) | 0.039603 |
| 3-Day High | $1.1106 |
| 3-Day Low | $1.0266 |
| 52-Week High | $2.6934 |
| % from 52W High | -59.21% |
| 52-Week Low | $1.0098 |
| % from 52W Low | +8.81% |
| YTD High | $2.4103 |
| % from YTD High | -54.42% |
| YTD Low | $1.0098 |
| % from YTD Low | +8.81% |
📊 Market Commentary
Ripple (XRP) is trading at $1.0987, up 1.12% today, as the broader crypto market shows cautious optimism. The Relative Strength Index (RSI) at 41.6 suggests XRP is neither overbought nor oversold, hovering near neutral territory. Over the past 52 weeks, XRP has fluctuated between $1.0098 and $2.6934, reflecting significant volatility amid regulatory developments and shifting market sentiment.
Market sentiment for XRP remains mixed, influenced by ongoing legal clarity surrounding Ripple’s case with the U.S. SEC. Traders are closely monitoring key support and resistance levels, with immediate support near $1.00, a psychological and technical floor. On the upside, resistance is seen around $1.20, a level that has previously acted as a barrier. A sustained break above this could signal renewed bullish interest, while failure to hold $1.00 may invite further downside.
Volume trends and institutional interest are also in focus, as XRP’s liquidity and adoption continue to play a role in its price action. With the RSI indicating room for movement in either direction, traders are watching for shifts in broader market momentum and regulatory updates. For now, XRP remains range-bound, with its near-term trajectory likely tied to macroeconomic factors and developments in Ripple’s legal landscape.
Disclaimer
The content on MarketsFN.com is provided for educational and informational purposes only. It does not constitute financial advice or investment recommendations. All investments involve risk. Cryptocurrency markets are highly volatile. Past performance does not guarantee future results.