BNB at $567: Oversold RSI Hints Rebound Amid 1.29% Daily Gain
· Crypto · QuoteReporter
BNB at $567: Oversold RSI Hints Rebound Amid 1.29% Daily Gain
BNB (BNB/USD) | June 26, 2026 $567.0400 +1.29%
🔍 Technical Analysis
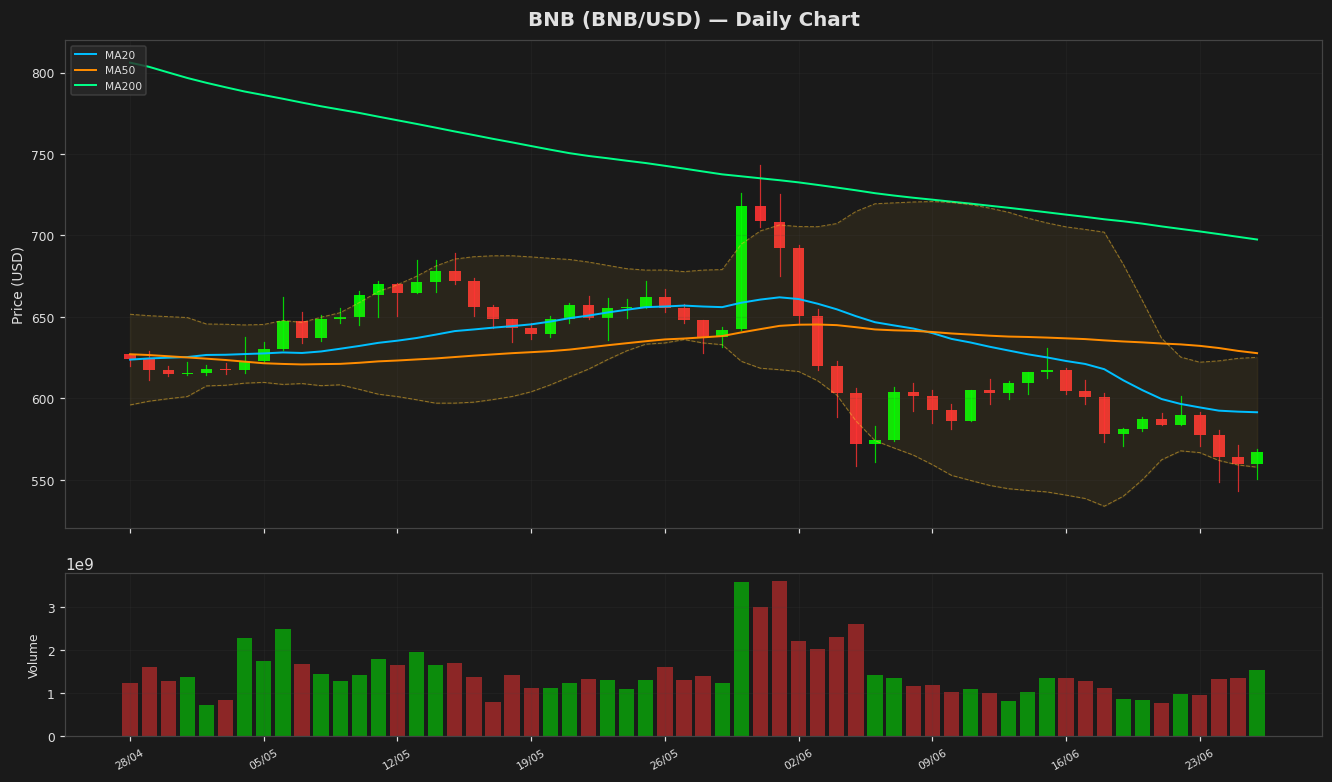
BNB is currently trading at $567.04, showing a modest daily gain of 1.29%. The price remains below key moving averages, indicating bearish momentum in the medium to long term. The MA20 at $591.49 and MA50 at $627.77 are acting as resistance levels, while the MA200 at $697.53 underscores the broader downtrend. Bollinger Bands reveal a narrowing volatility range, with the upper band at $625.20 and the lower band at $557.79. The price hovering near the lower band suggests potential oversold conditions. The RSI(14) at 33.47 is approaching oversold territory but has not yet signaled a reversal. The MACD histogram at -16.35 remains below the signal line at -14.43, confirming bearish momentum. Key support is seen at the 52-week low of $543.18, while resistance levels are at the MA20 ($591.49) and MA50 ($627.77). The ATR(14) at 17.75 indicates moderate volatility. Given the current technical setup, BNB may test lower support levels unless bullish momentum emerges to break above the moving averages. Traders should watch for RSI divergence or MACD crossover for potential trend reversal signals.
Technical Metrics
| Metric | Value |
|---|---|
| Current Price | $567.0400 |
| Daily Change | +1.29% |
| MA 20 | $591.4929 |
| % from MA20 | -4.13% |
| MA 50 | $627.7670 |
| % from MA50 | -9.67% |
| MA 200 | $697.5322 |
| % from MA200 | -18.71% |
| BB Upper | $625.1962 |
| % from BB Upper | -9.30% |
| BB Lower | $557.7896 |
| % from BB Lower | +1.66% |
| RSI (14) | 33.47 |
| MACD | -16.351877 |
| MACD Signal | -14.429292 |
| ATR (14) | 17.753858 |
| 3-Day High | $580.5236 |
| 3-Day Low | $543.1838 |
| 52-Week High | $1,180.0149 |
| % from 52W High | -51.95% |
| 52-Week Low | $543.1838 |
| % from 52W Low | +4.39% |
| YTD High | $954.8583 |
| % from YTD High | -40.62% |
| YTD Low | $543.1838 |
| % from YTD Low | +4.39% |
📊 Market Commentary
**BNB Market Commentary**
BNB is trading at $567.04, up 1.29% today, as the broader crypto market shows cautious recovery. The Relative Strength Index (RSI) at 33.5 indicates BNB is nearing oversold territory, which could attract short-term buyers. However, sentiment remains mixed amid ongoing regulatory scrutiny and broader market uncertainty.
Key resistance levels to watch include $580 (recent swing high) and $600 (psychological barrier). On the downside, support lies near $550 (recent low) and $543 (52-week low). A break below $543 could trigger further selling pressure, while holding above $550 may signal consolidation.
Traders are monitoring Binance-related developments, including regulatory updates and platform activity, as these factors heavily influence BNB’s price. The token’s 52-week range ($543.18 – $1,180.01) highlights significant volatility, with current prices near the lower bound.
Volume remains subdued compared to recent months, suggesting limited conviction in either direction. Institutional interest and broader crypto market trends (e.g., Bitcoin’s stability) will likely dictate near-term momentum. Given the low RSI, some traders may look for a bounce, but caution prevails due to macro risks and regulatory headwinds.
In summary, BNB is testing key support levels with neutral-to-weak sentiment. Traders await clearer signals from both technicals and fundamentals before taking aggressive positions.
Disclaimer
The content on MarketsFN.com is provided for educational and informational purposes only. It does not constitute financial advice or investment recommendations. All investments involve risk. Cryptocurrency markets are highly volatile. Past performance does not guarantee future results.