Crypto Market Dips: Dogecoin, Ethereum, and Solana Slump
· Crypto · QuoteReporter
Crypto Market Dips: Dogecoin, Ethereum, and Solana Slump
Crypto Market Report | May 11, 2026
📊 Crypto Market Overview
The cryptocurrency market is displaying a mixed sentiment as of the latest data, with a slight bearish tilt among major assets, though pockets of strength and optimism persist. Most top cryptocurrencies are trading in the red over the past 24 hours, with Ethereum (ETH) declining 1.63% to $2,330.54, Solana (SOL) dropping 1.19% to $95.28, and Dogecoin (DOGE) seeing the steepest fall at 2.41% to $0.1098. Ripple (XRP) and BNB also recorded losses of 0.71% and 1.18%, respectively, trading at $1.4623 and $655.80. However, Tron (TRX) stands out as a notable exception, gaining 0.36% to reach $0.3519, reflecting isolated bullish momentum.
From a technical perspective, indicators suggest varied conditions across these assets. Tron’s RSI of 91.6 signals overbought territory, potentially indicating a cooling-off period ahead, while its positive MACD of 0.0080 supports short-term upward momentum. Solana’s RSI at 78.2 also leans toward overbought conditions, paired with a strong MACD of 2.2572. Meanwhile, Ethereum’s RSI of 54.0 reflects neutral positioning, with a robust MACD of 21.2776 hinting at bullish undercurrents. XRP, BNB, and Dogecoin show RSIs between 63.0 and 66.8, indicating moderate strength without extreme overbought signals.
In the broader macro context, positive developments are fueling cautious optimism. Crypto funds have reported $858 million in inflows for the sixth consecutive week, per CoinShares, signaling sustained institutional interest. Additionally, Circle’s $222 million raise for its Arc token presale at a $3 billion valuation underscores growing confidence in stablecoin ecosystems. Regulatory advancements, such as Crypto.com’s UAE license for government payments in Dubai and discussions around the CLARITY Act in the U.S., highlight increasing mainstream integration. Meanwhile, Australia’s proposed capital gains tax changes could impact crypto investors, adding a layer of uncertainty.
Market narratives are also shaped by specific asset developments, with XRP metrics aligning for potential bullish signals and veteran investors betting on Ethereum’s role in AI-driven tokenization. Overall, while daily price action leans bearish, underlying fundamentals and technicals suggest a complex landscape with room for selective upside.
📰 Crypto News
- USDC issuer Circle raises $222M in Arc token presale valued at $3B
- XRP metrics line up bull signals for ‘full-scale rally’ to $2
- Crypto funds log $858M in sixth straight week of inflows: CoinShares
- BTC price target becomes $85K next: Five things to know in Bitcoin this week
- Capital B raises $17.8M to expand its Bitcoin treasury
- Crypto.com receives UAE license for Dubai government crypto payments
- This Bitcoin price level will be 'end of the bears' if broken, says analyst
- 7 Democrats seen as ‘key’ to advancing CLARITY Act: Galaxy
- Veteran investor bets on Ethereum as AI agents drive tokenization demand
- Australia plans capital gains tax changes affecting crypto investors: Report
- White hat returns $190K to Renegade hours after hacking the protocol
- Bank of England chief says global stablecoin rules will ‘wrestle’ with US
- SUI spikes 50% amid staking moves, zero-fee stablecoins, privacy push
- Privacy advocates slam reCAPTCHA update they say locks out de-Googled phones
- Bitcoin rallies 2.3% after Trump calls Iran peace proposal ‘totally unacceptable’
🔍 Technical Analysis
Ethereum (ETH) — -1.63%
$2,330.54 52W: $1,748.63 — $4,763.36
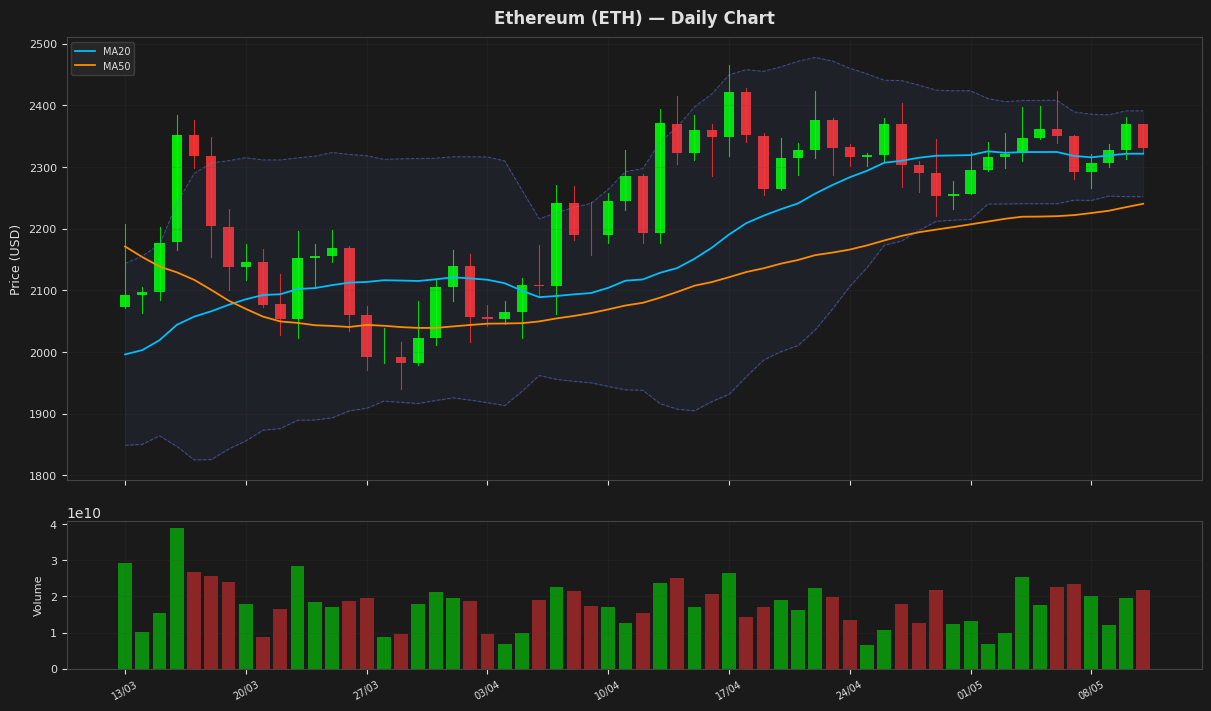
Ethereum is currently trading at $2,330.54, reflecting a daily decline of 1.63%, and sits slightly above its 20-day moving average of $2,321.49 while remaining well above the 50-day moving average of $2,240.35, indicating a generally stable short-term trend. The RSI at 53.99 suggests neutral momentum, though the MACD line at 21.28 is below the signal line at 24.46, hinting at potential bearish pressure, while the price remains within the Bollinger Bands range of $2,251.91 to $2,391.06. Overall, with an ATR of 64.15 indicating moderate volatility and the price far from its 52-week high of $4,763.36, Ethereum may face resistance in the near term but holds above key support levels.
Ripple (XRP) — -0.71%
$1.4623 52W: $1.1335 — $3.1835
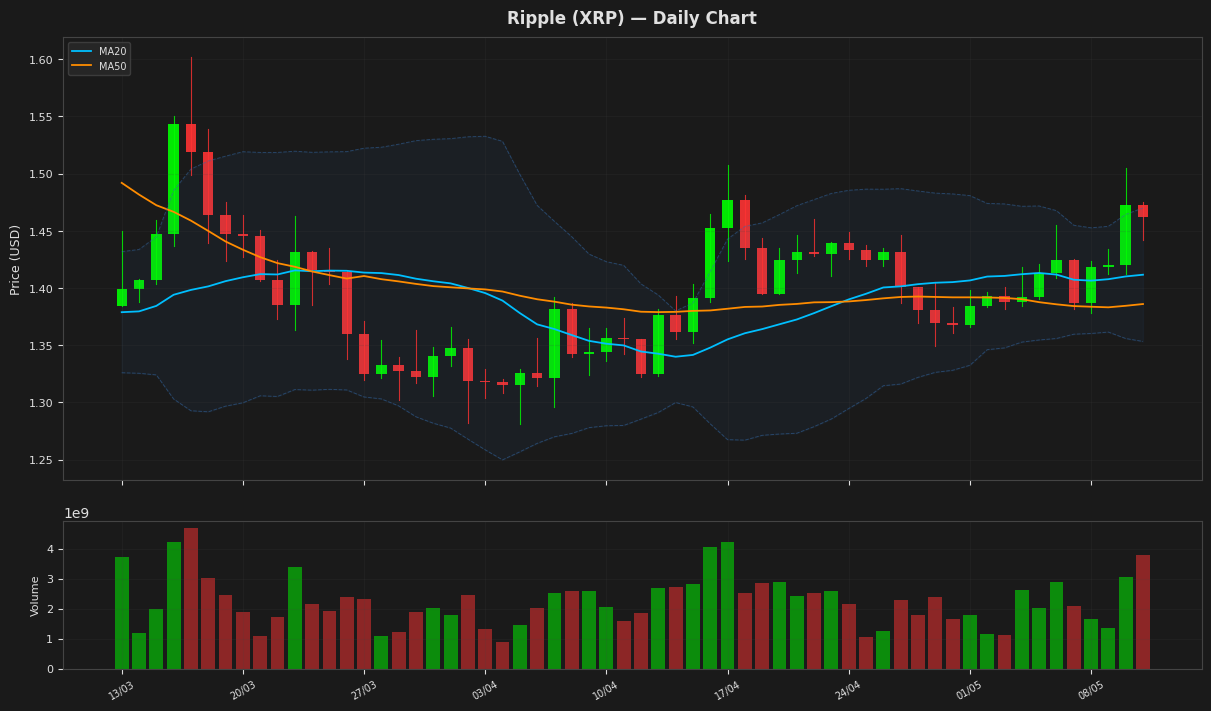
Ripple's current price stands at $1.46, reflecting a modest daily decline of 0.71%, yet it trades above its 20-day moving average of $1.41 and 50-day moving average of $1.39, suggesting a short-term upward trend. The RSI at 63.02 indicates moderate buying momentum without being overbought, while the MACD line at 0.013 is above the signal line at 0.006, supporting bullish signals, though the price is approaching the upper Bollinger Band at $1.47, which may act as resistance. Overall, with XRP positioned between its 52-week high of $3.18 and low of $1.13, and low volatility indicated by an ATR of 0.04, the asset appears stable but could face consolidation in the near term.
Solana (SOL) — -1.19%
$95.2800 52W: $68.6918 — $253.2099
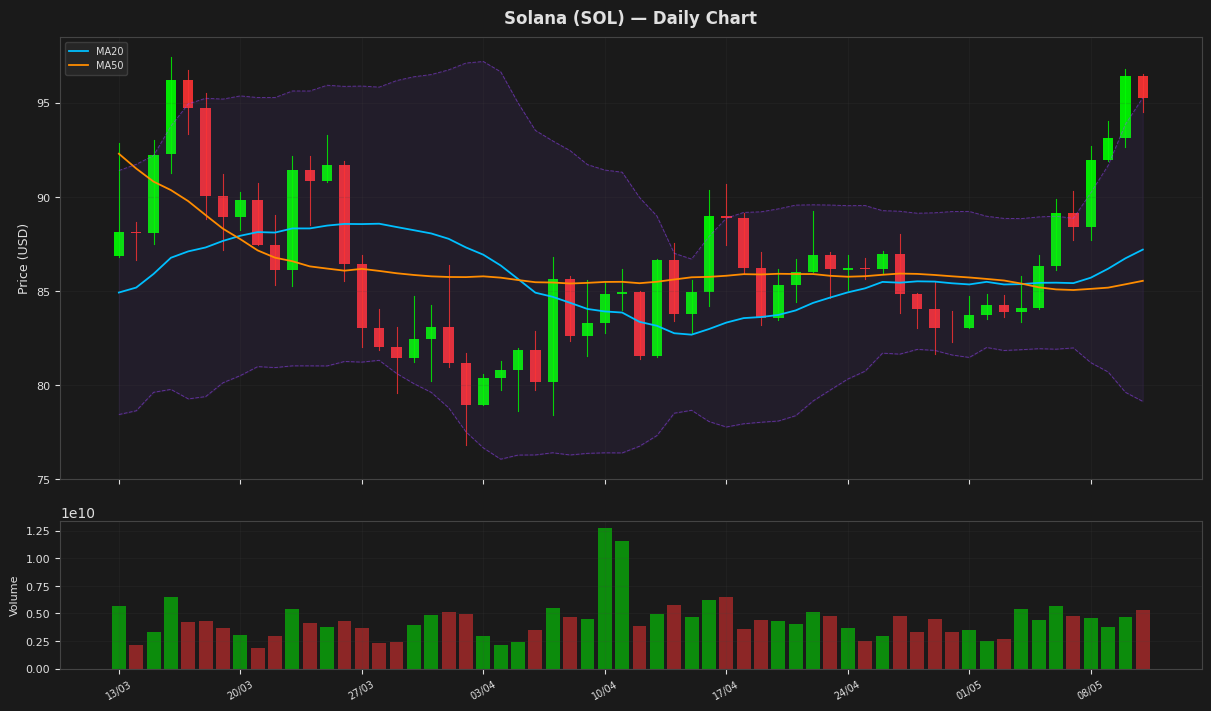
Solana's current price of $95.28 reflects a slight daily decline of 1.19%, positioning it above both its 20-day moving average of $87.20 and 50-day moving average of $85.54, which suggests a short-term upward trend despite the recent dip. The RSI at 78.16 indicates overbought conditions, while the MACD line at 2.26 remains above the signal line at 1.02, signaling continued bullish momentum. Additionally, with the price near the upper Bollinger Band at $95.27 and volatility measured by ATR at 2.61, Solana is trading towards the higher end of its 52-week range between $68.69 and $253.21, warranting caution for potential pullbacks.
BNB (BNB) — -1.18%
$655.8000 52W: $570.6840 — $1,370.55
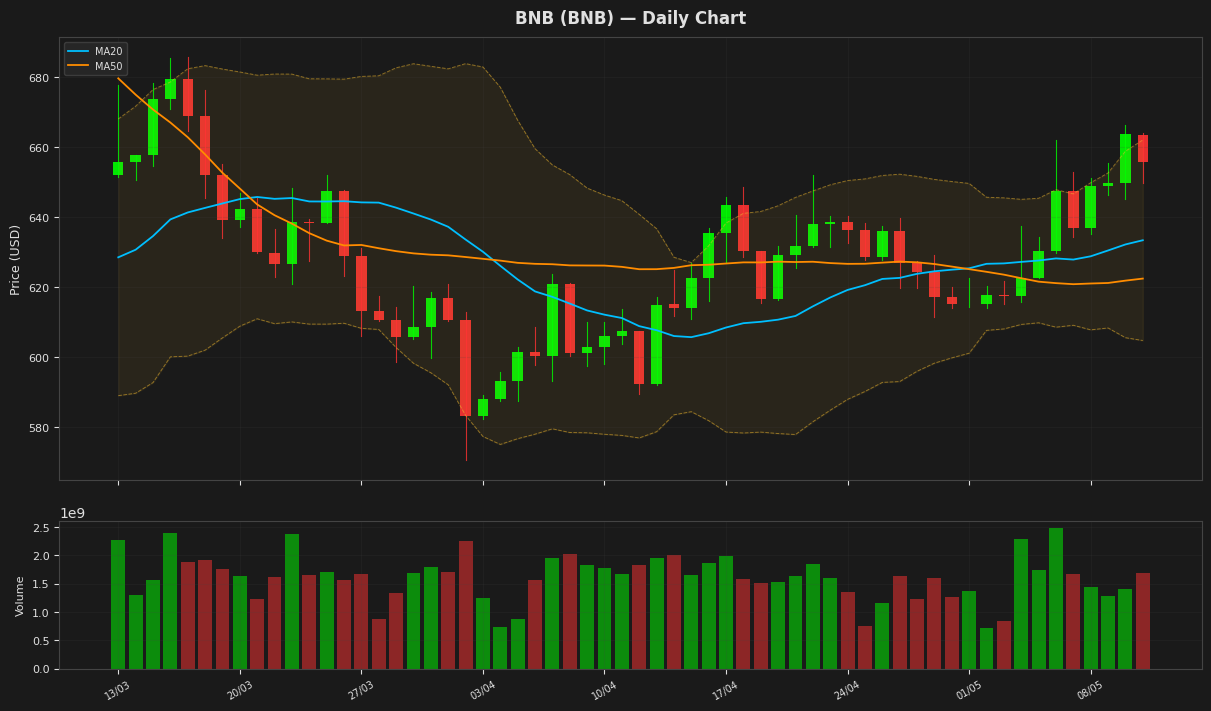
BNB is currently trading at $655.80, down 1.18% from the previous day, and sits above its 20-day moving average of $633.40 and 50-day moving average of $622.45, indicating a short-term upward trend despite the recent decline. The RSI at 65.99 suggests the asset is nearing overbought conditions, while the MACD line at 7.98 above the signal line at 4.31 supports ongoing bullish momentum, with the price positioned between the Bollinger Bands' upper limit of $662.04 and lower limit of $604.76. Additionally, the ATR of 14.16 reflects moderate volatility, and BNB remains significantly below its 52-week high of $1370.55 but above the low of $570.68, leaving room for potential gains if the positive indicators hold.
Tron (TRX) — +0.36%
$0.351945 52W: $0.268138 — $0.354750
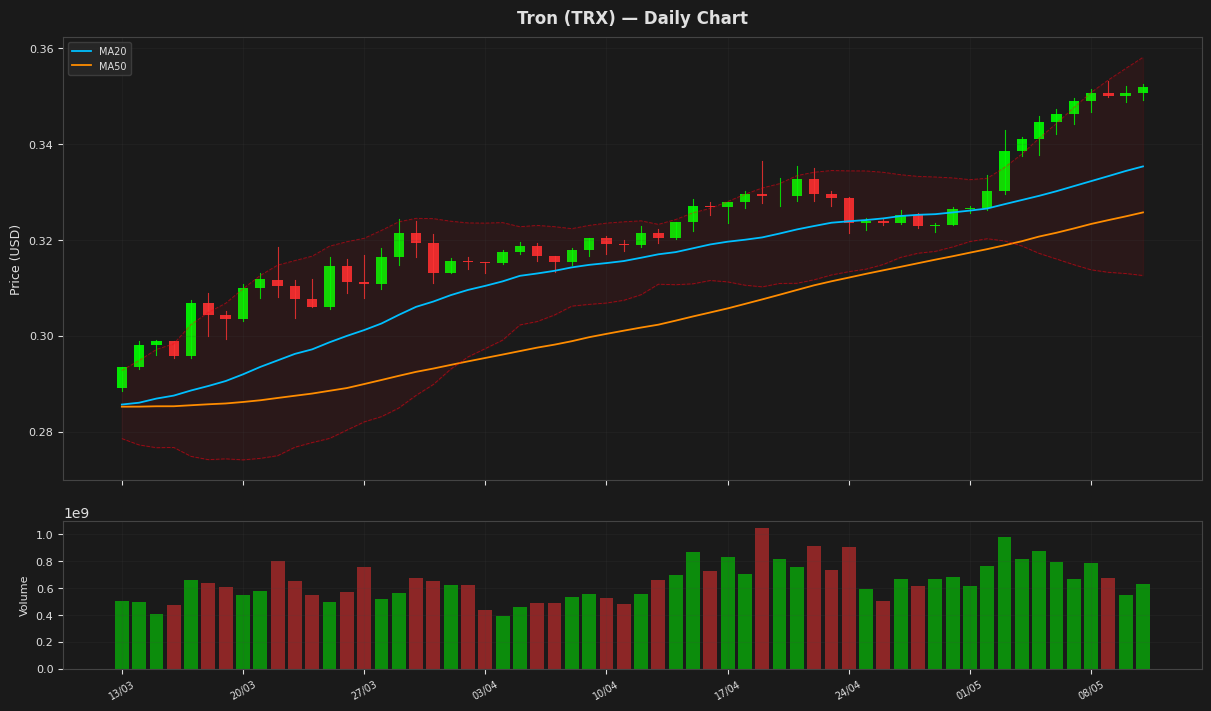
Tron's current price stands at $0.351945, reflecting a modest daily increase of 0.36%, and it trades above both its 20-day moving average of $0.335366 and 50-day moving average of $0.325764, indicating a short-term upward trend. The RSI at 91.62 suggests overbought conditions, while the MACD line at 0.007951 above the signal line of 0.006397 supports bullish momentum, though this could signal potential volatility given the ATR of 0.004886. Additionally, the price is near its 52-week high of $0.35475 and within the Bollinger Bands' upper limit of $0.358135, positioning it close to resistance levels.
Dogecoin (DOGE) — -2.41%
$0.109810 52W: $0.081573 — $0.305642
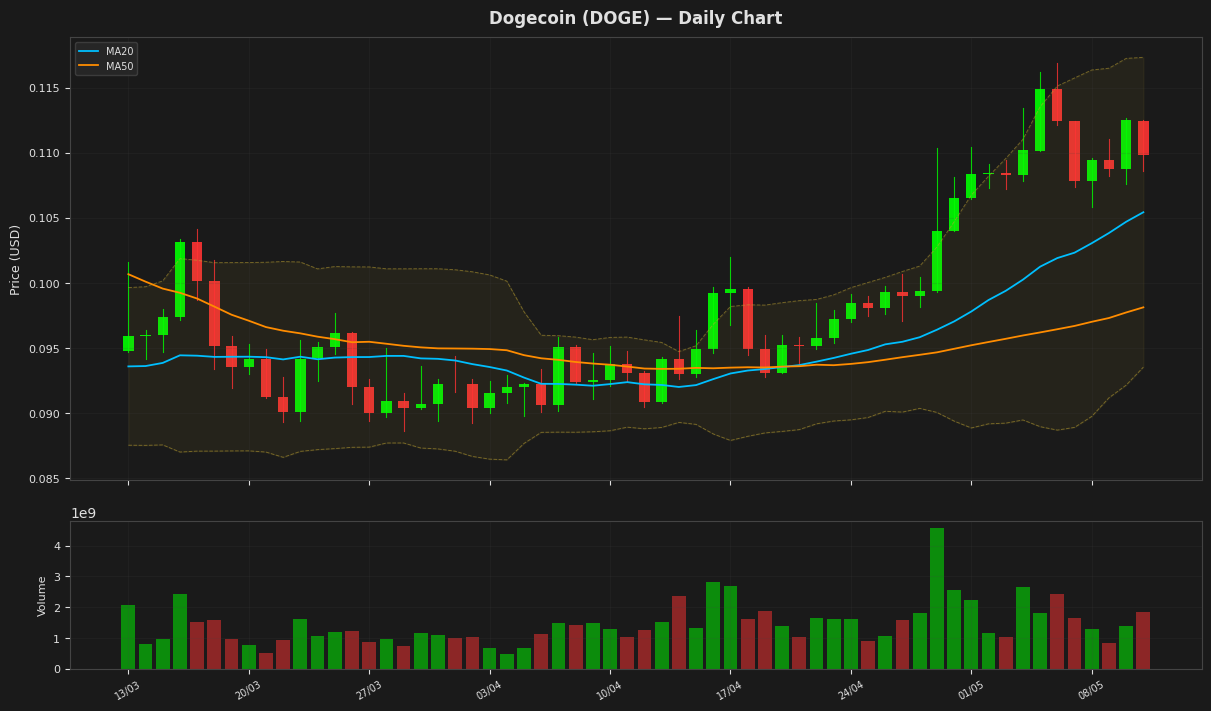
Dogecoin is currently trading at $0.109810, down 2.41% daily, and sits above its 20-day moving average of $0.105426 and 50-day moving average of $0.098119, suggesting a short-term bullish trend despite the recent decline. The RSI at 66.81 indicates the asset is approaching overbought territory, while the MACD line at 0.003925 remains above the signal line at 0.003826, supporting positive momentum. Additionally, with the price positioned between the Bollinger Bands' upper level of $0.117326 and lower level of $0.093525, and an ATR of 0.004484 reflecting low volatility, Dogecoin is trading within a relatively stable range compared to its 52-week high of $0.305642 and low of $0.081573.
Disclaimer
The content on MarketsFN.com is provided for educational and informational purposes only. It does not constitute financial advice or investment recommendations. All investments involve risk. Past performance does not guarantee future results.