Crypto Market Sees Gains: Dogecoin, Ripple, and Ethereum Lead the Charge
· Crypto · QuoteReporter
Crypto Market Sees Gains: Dogecoin, Ripple, and Ethereum Lead the Charge
Crypto Market Report | July 03, 2026
📊 Crypto Market Overview
The cryptocurrency market is currently exhibiting a mixed sentiment, with some assets showing modest gains while others remain relatively stable. Bitcoin, the largest cryptocurrency by market capitalization, is trading at $61,680.0898, having risen by 0.32% over the past 24 hours. The Relative Strength Index (RSI) for Bitcoin stands at 42.7, indicating a neutral territory, while the Moving Average Convergence Divergence (MACD) is negative at -1844.8514, suggesting a bearish trend.
Other major cryptocurrencies, such as Ethereum and Ripple, have seen slight increases in their prices, with gains of 1.12% and 1.23%, respectively. Solana is trading near overbought territory, with an RSI of 70.0, while Dogecoin's RSI is at 25.9, indicating oversold conditions.
The recent surge in US spot Bitcoin ETFs, with daily inflows exceeding $200M for the first time since May, has contributed to the stability in Bitcoin's price. The macroeconomic context, including the release of US jobs data, has also been a factor in the market's current state. The dominance of the US in Polymarket political bets and the development of tokenized stocks on Solana and Avalanche are other notable developments.
From a technical perspective, the MACD indicators for most major cryptocurrencies are either negative or showing signs of convergence, suggesting a lack of clear direction in the market. The recent price movements have resulted in more Bitcoin being held at a loss than at a profit, indicating a shift in investor sentiment. Overall, the cryptocurrency market is currently characterized by a mix of stability and cautious optimism, with investors closely watching macroeconomic indicators and technical signals.
📰 Crypto News
- US spot Bitcoin ETFs top $200M in daily inflows for first time since May
- Teen ‘Scattered Spider’ suspect extradited to US over $8M crypto ransom
- AI agent development hasn’t accelerated as expected, Zuckerberg says
- US dominates Polymarket political bets despite geoblock: Report
- Strategy will be ‘less important’ in Bitcoin after STRC incident: Bitwise
- Securitize gains on NYSE debut with tokenized stocks live on Solana, Avalanche
- Bitcoin holds $61K after US jobs data report, AI sector weakness: Did BTC bottom?
- Is Bitcoin heading for $65K? Sharplink buys $16M ETH: Market Moves
- Ripple co-founder backs venture launched by US senator's son: Report
- Live updates: More bitcoin is now held at a loss than at a profit
- Binance says MiCA should be judged by who it licenses, not who it excludes
- Finally. $221 million flow into Bitcoin ETFs, ending a painful 10-day outflow streak
- XRP bulls test path back toward $1.10 as token zips 4% higher
- Ether and solana extend gains as a short squeeze lifts bitcoin toward $62,000
- OpenAI Offers US Government a $42 Billion Slice of Itself: Report
🔍 Technical Analysis
Bitcoin (BTC) — +0.32%
$61,680.09 52W: $57,747.77 — $116,273.31
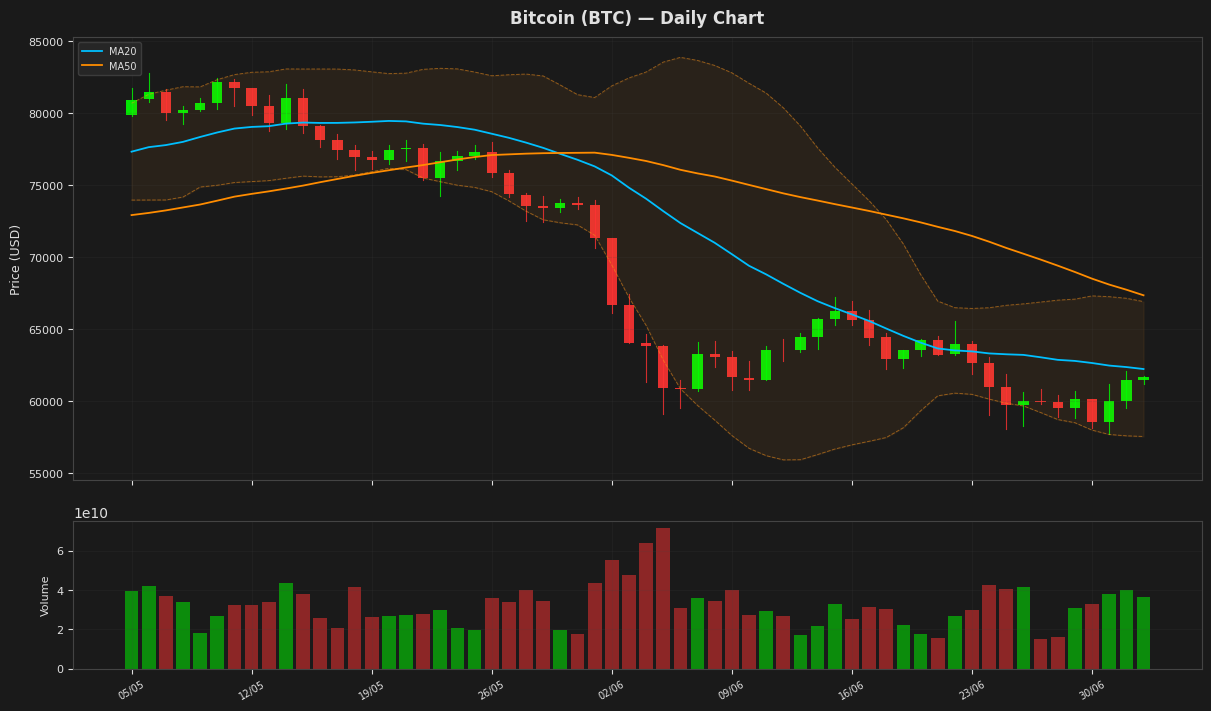
Bitcoin is currently trading at $61,680 with a slight increase of 0.32% in a day, indicating a minor recovery. The RSI value of 42.69 suggests that the asset is nearing oversold territory, while the MACD line is above the signal line, hinting at a potential bullish crossover. The price is below both MA20 and MA50, and also below the upper Bollinger Band, indicating a possible consolidation phase. The ATR suggests high volatility.
Ethereum (ETH) — +1.12%
$1,717.22 52W: $1,506.51 — $4,250.67
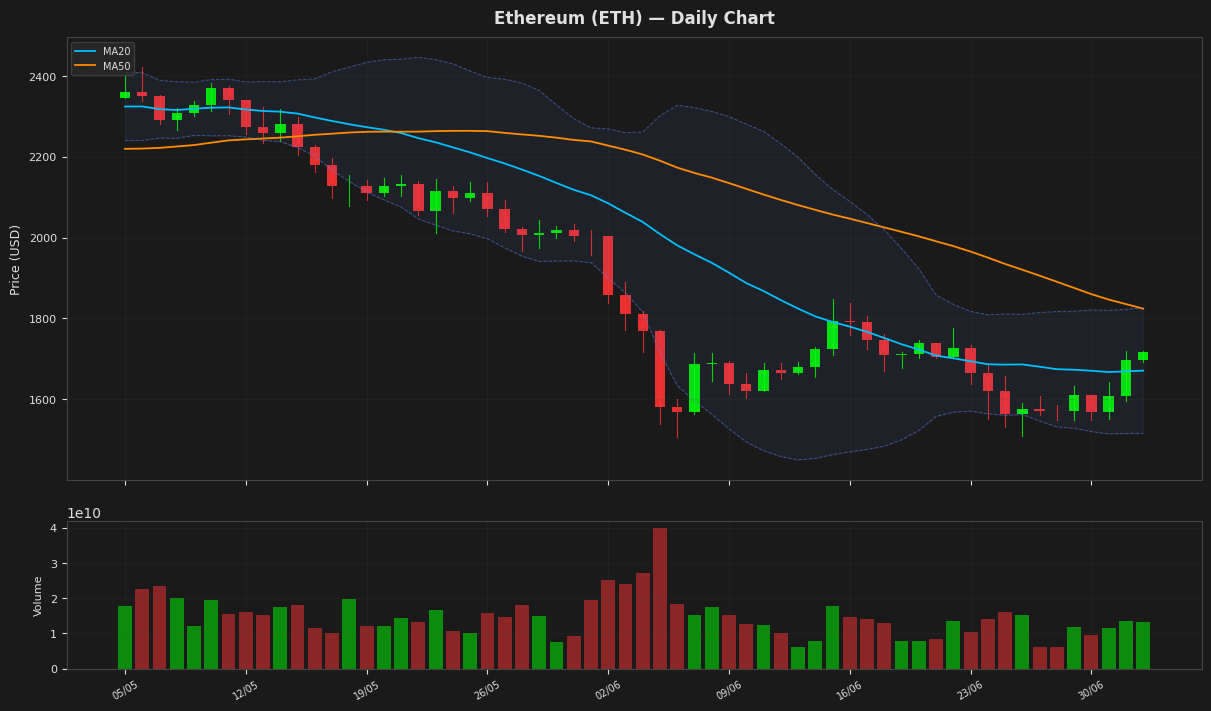
Ethereum is currently trading at $1,717.22, slightly above its 20-day moving average of $1,671.08, indicating a potential for further upward movement. The Relative Strength Index (RSI) at 50.63 suggests a neutral market sentiment. The price is also below the upper Bollinger Band at $1,825.94, indicating that there is still room for the price to move upwards before it reaches the upper limit of the band.
Ripple (XRP) — +1.23%
$1.0999 52W: $1.0098 — $2.6934
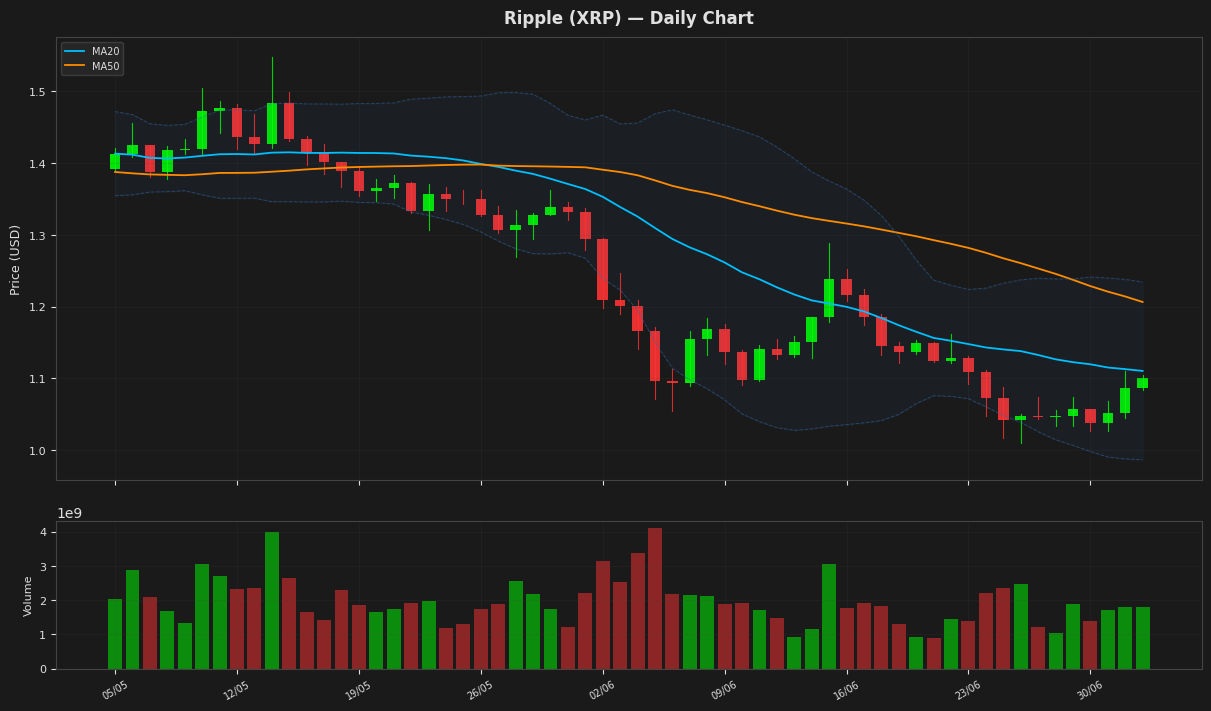
Ripple's price is currently at $1.099900, showing a slight increase of 1.23% daily, and is positioned near the lower end of its recent trading range as indicated by the Bollinger Bands. The RSI is at 41.922108, suggesting that the asset is not oversold but has room to recover. The MACD is negative and close to its signal line, indicating a potential for a slight upward correction. The price is below both MA20 and MA50, indicating a downtrend.
Solana (SOL) — +0.37%
$80.9400 52W: $60.4147 — $205.0200
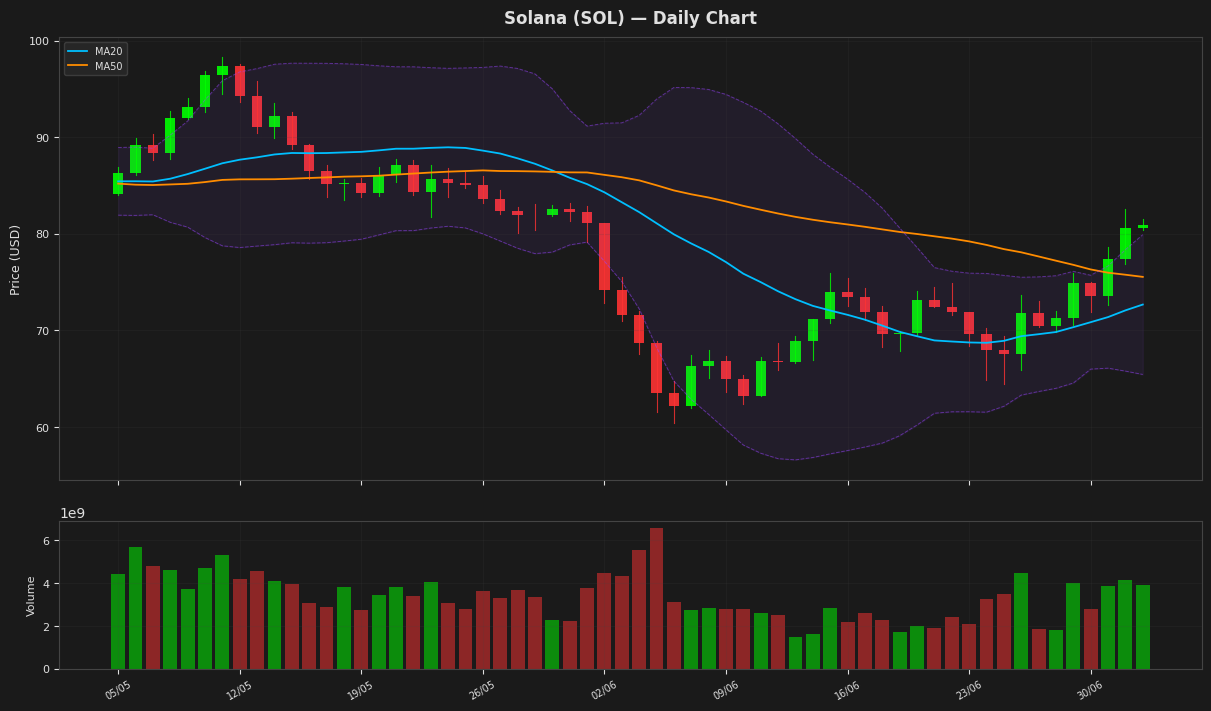
Solana's price is currently at $80.94, showing a slight increase of 0.37% and trading above both its 20-day and 50-day moving averages, indicating a positive short-term trend. The RSI is at 69.95, nearing overbought territory, while the MACD is above its signal line, suggesting a potential continuation of the upward momentum. The Bollinger Bands indicate that the price is near the upper band, suggesting a possible resistance level around $79.91.
BNB (BNB) — +0.62%
$561.4500 52W: $538.5992 — $1,180.01
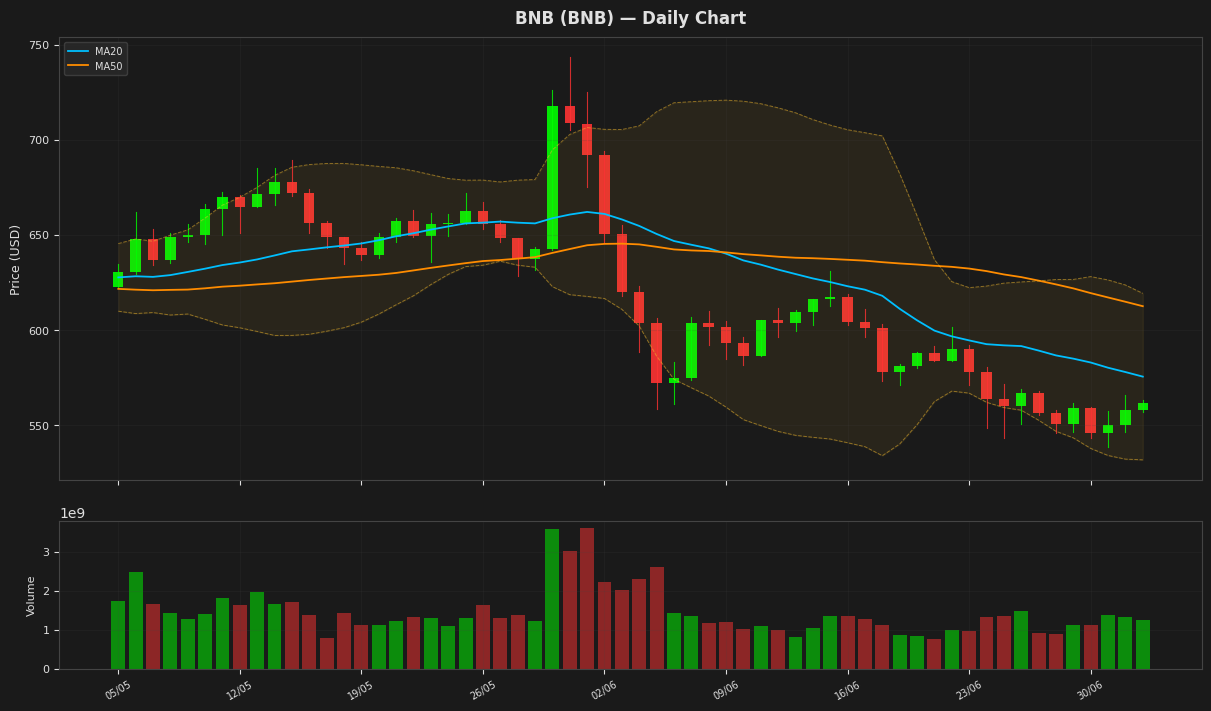
BNB is currently trading at $561.45, near its 52-week low of $538.60, with its RSI indicating a potentially oversold condition at 40.75. The price is below both the MA20 and MA50, suggesting a downtrend. The Bollinger Bands indicate that the price is closer to the lower band, which could be a support level around $531.62. The MACD is slightly above its signal line, hinting at a potential stabilization.
Tron (TRX) — +0.54%
$0.318890 52W: $0.268138 — $0.376332
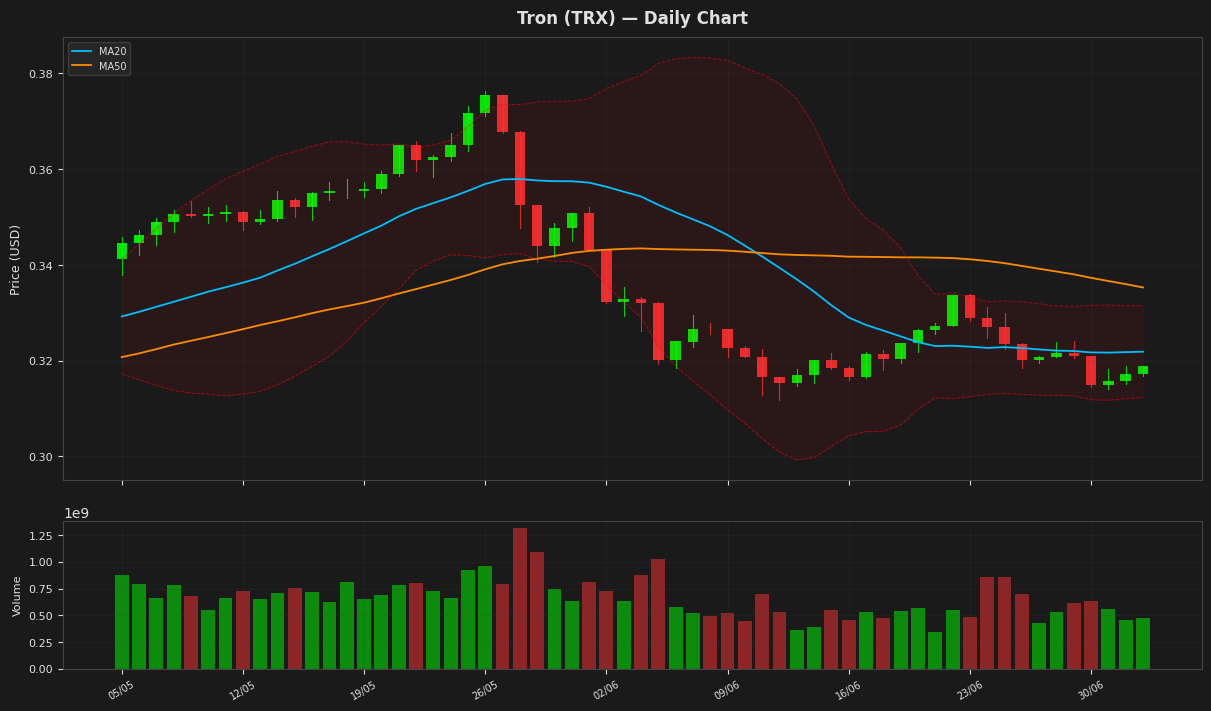
Tron's price is currently at $0.318890, showing a minor increase of 0.54% and trading near the lower end of the Bollinger Bands, indicating potential support around the lower band at $0.312296. The RSI is at 43.373266, suggesting that TRX is not oversold but has room to recover. The MACD is slightly above its signal line, indicating a potential bullish crossover.
Dogecoin (DOGE) — +1.43%
$0.075140 52W: $0.069611 — $0.209315
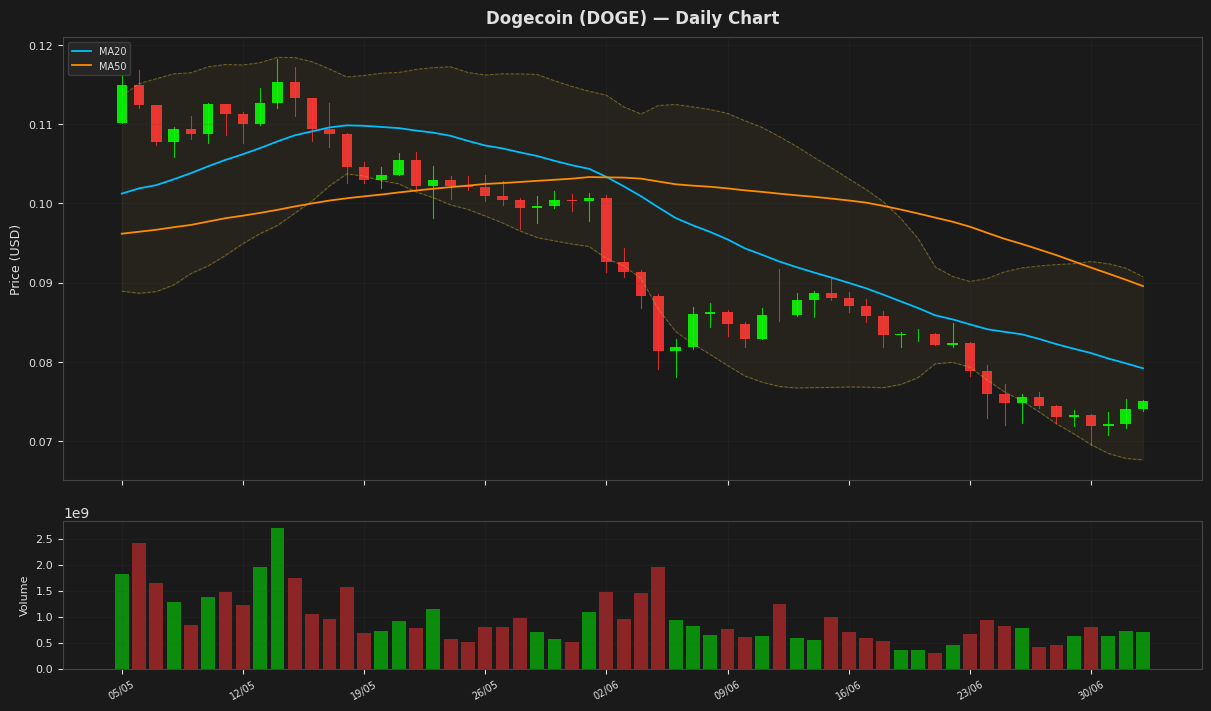
Dogecoin's current price is $0.075140, showing a daily increase of 1.43%, and is positioned near the lower Bollinger Band at $0.067674, indicating potential oversold conditions. The RSI(14) value of 25.92 suggests the cryptocurrency is oversold, while the MACD is slightly below its signal line, indicating a potential for a minor recovery. The price is still below both the MA20 and MA50, indicating a downtrend.
Disclaimer
The content on MarketsFN.com is provided for educational and informational purposes only. It does not constitute financial advice or investment recommendations. All investments involve risk. Past performance does not guarantee future results.