Crypto Market Slumps: Ethereum, Solana, Dogecoin Lead Top Losers Today.
· Crypto · QuoteReporter
Crypto Market Slumps: Ethereum, Solana, Dogecoin Lead Top Losers Today.
Crypto Market Report | June 23, 2026
📊 Crypto Market Overview
The cryptocurrency market experienced a downturn today, with major assets such as Bitcoin and Ethereum recording significant losses. Bitcoin's price fell by 3.05% to $62,004.51, while Ethereum dropped by 4.95% to $1,641. Other notable cryptocurrencies, including Solana and Dogecoin, also saw substantial declines, with Solana decreasing by 4.88% to $68.40 and Dogecoin falling by 4.65% to $0.0786.
The overall market sentiment appears to be cautious, with several key assets exhibiting neutral to bearish technical signals. Bitcoin's RSI stands at 51.3, indicating a relatively neutral position, while its MACD is negative at -2029.78. Ethereum's RSI is similarly neutral at 50.4, with a negative MACD of -67.47. In contrast, Tron is showing a relatively stronger signal with an RSI of 60.3.
Recent news has highlighted the ongoing regulatory developments in the United States. The US Senate's passage of a housing bill that includes a ban on central bank digital currencies (CBDCs) until 2030 has garnered attention. Additionally, the crypto lobby is urging Congress to pass a staking and mining tax bill without amendments. Other news includes the establishment of a dedicated crypto division by Franklin Templeton following its acquisition of 250 Digital.
The macro context continues to influence the cryptocurrency market, with traditional financial institutions increasingly engaging with digital assets. The recent backing of an Ethereum R&D nonprofit by prominent figures and companies underscores the growing interest in the sector. As the market navigates these developments, technical signals will remain crucial in understanding the evolving landscape. The current price movements and indicators suggest a cautious outlook, with traders closely monitoring key support levels and potential breakouts.
📰 Crypto News
- Here’s what happened in crypto today
- US Senate passes housing bill with CBDC ban until 2030
- Crypto lobby urges Congress to pass staking and mining tax bill as is
- Trump signs orders for quantum computer, cryptography upgrades
- Bitmine, Sharplink and Joe Lubin back Ethereum R&D nonprofit
- Bitcoin funding rate hits 2-week high: Is $70K next?
- Franklin Templeton launches dedicated crypto division after closing 250 Digital acquisition
- Bitcoin price has limited downside, likely near bottom, contrarian indicator suggests
- Live updates: An 'altcoin season' signal flashed, but bitcoin's slide is what set it off
- XRP drifts toward $1.10 support as traders await break from three-week range
- SpaceX’s $600 billion plunge erased equivalent of nearly half of bitcoin’s market cap in 3 days
- Bitcoin falls under $63,000 as a tech selloff drags risk assets lower
- Trump signs orders to build a quantum computer and protect against the one that could break encryption
- U.S. Senate passes housing bill that carries four-year ban on a Fed CBDC
- Securitize and tZERO clash over patents as race to bring Wall Street onchain heats up
🔍 Technical Analysis
Bitcoin (BTC) — -3.05%
$62,004.51 52W: $59,108.92 — $116,273.31
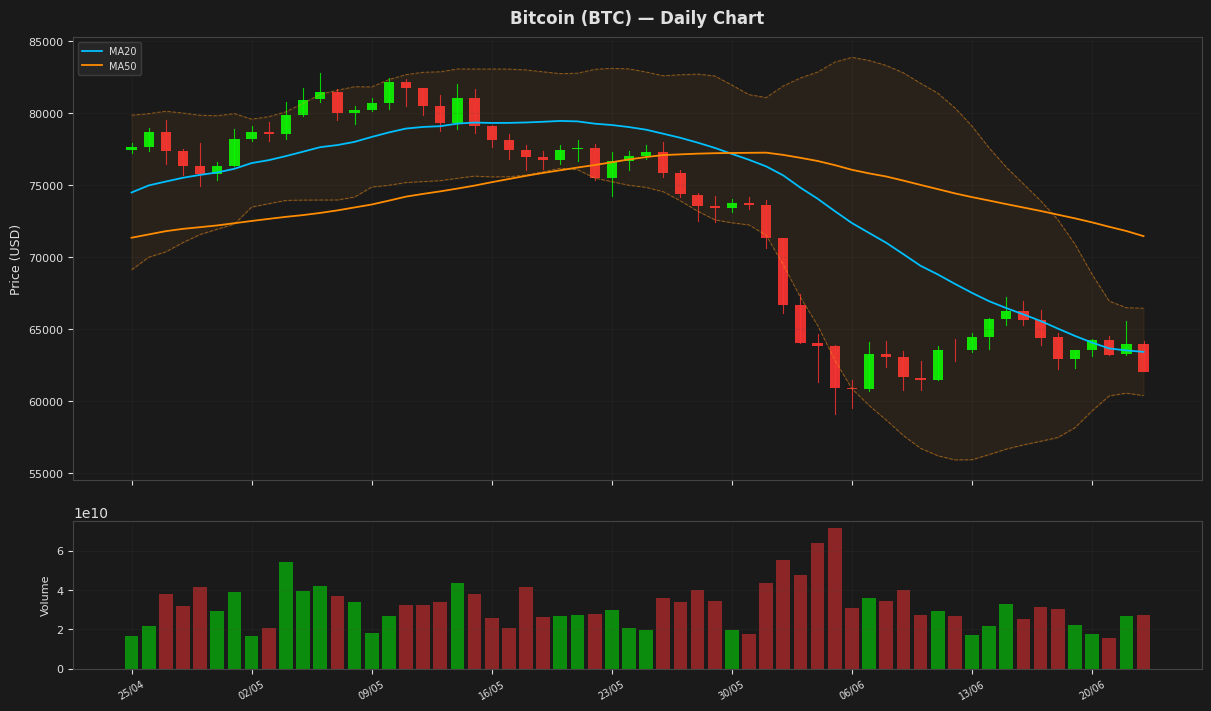
Bitcoin's price is currently at $62,004.51, showing a decline of 3.05% for the day, and is positioned between the Bollinger Band upper and lower limits, indicating a relatively stable trading range. The RSI is at 51.34, suggesting a neutral market sentiment, while the MACD is above its signal line, indicating a potential bullish signal. The price is also above the MA20, further supporting a neutral to slightly bullish outlook.
Ethereum (ETH) — -4.95%
$1,641.00 52W: $1,506.51 — $4,250.67
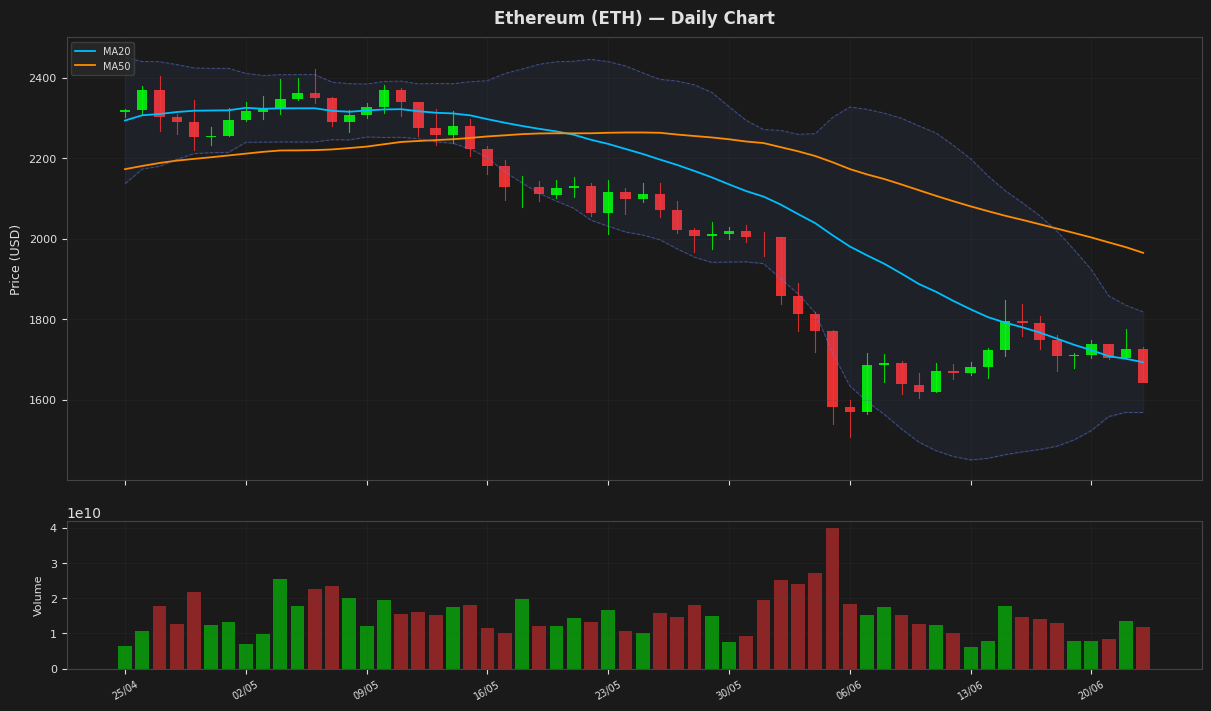
Ethereum's price is currently at $1,641, showing a decline of 4.95% for the day, and is positioned near the middle of its Bollinger Bands, with the current price being above the MA20 at $1,693. The RSI is at 50.35, indicating a neutral stance, while the MACD is below its signal line, suggesting a bearish signal. The price is also below the MA50, indicating a potential downtrend.
Ripple (XRP) — -2.75%
$1.0976 52W: $1.0547 — $2.6934
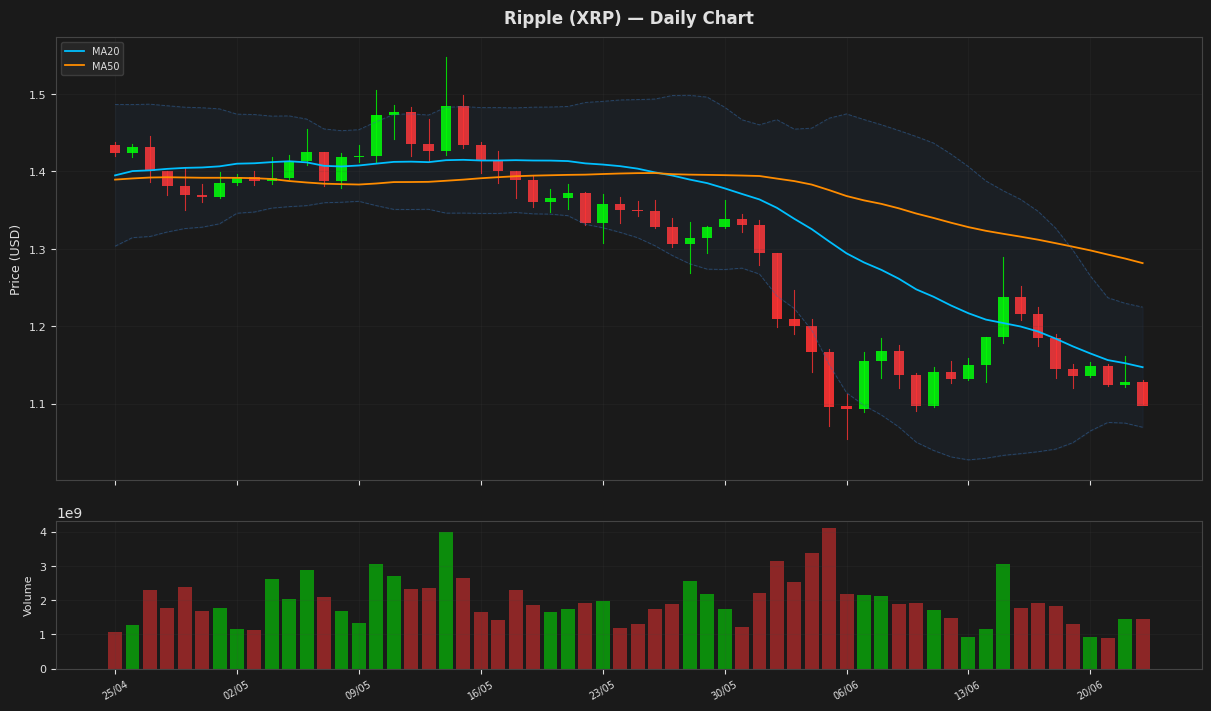
Ripple's price is currently at $1.097600, showing a decline of 2.75% for the day, as it trades near the lower Bollinger Band at 1.069622, indicating potential support. The RSI is at 44.704849, suggesting the asset is not yet oversold. The MACD is slightly above its signal line, indicating a potential stabilization in the downtrend. The price remains below both the MA20 and MA50, indicating a bearish trend.
Solana (SOL) — -4.88%
$68.4000 52W: $60.4147 — $208.3312
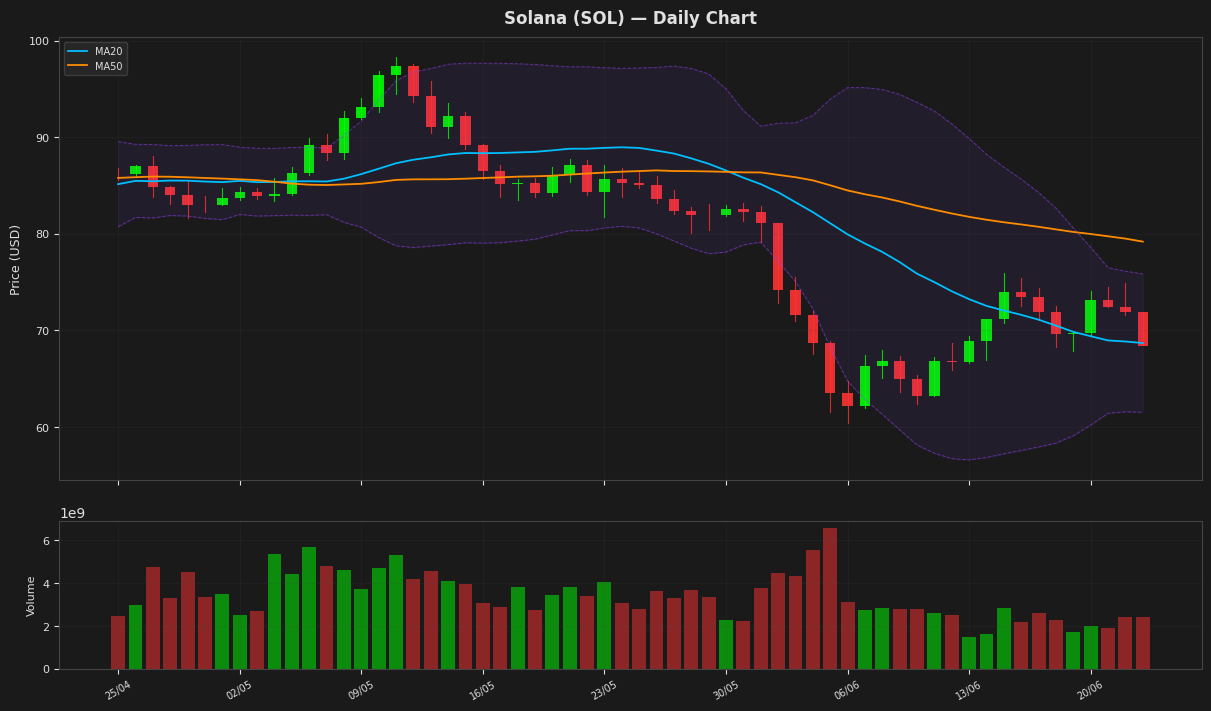
Solana's price is currently at $68.40, showing a decline of 4.88% for the day, and is positioned near the middle of its Bollinger Bands, with the upper and lower bands at $75.85 and $61.53 respectively. The RSI is at 56.76, indicating a neutral stance, while the MACD is negative and below its signal line, suggesting a bearish trend. The price is also below both the MA20 and MA50, further indicating a downward trend.
BNB (BNB) — -2.99%
$572.2800 52W: $558.3898 — $1,221.71
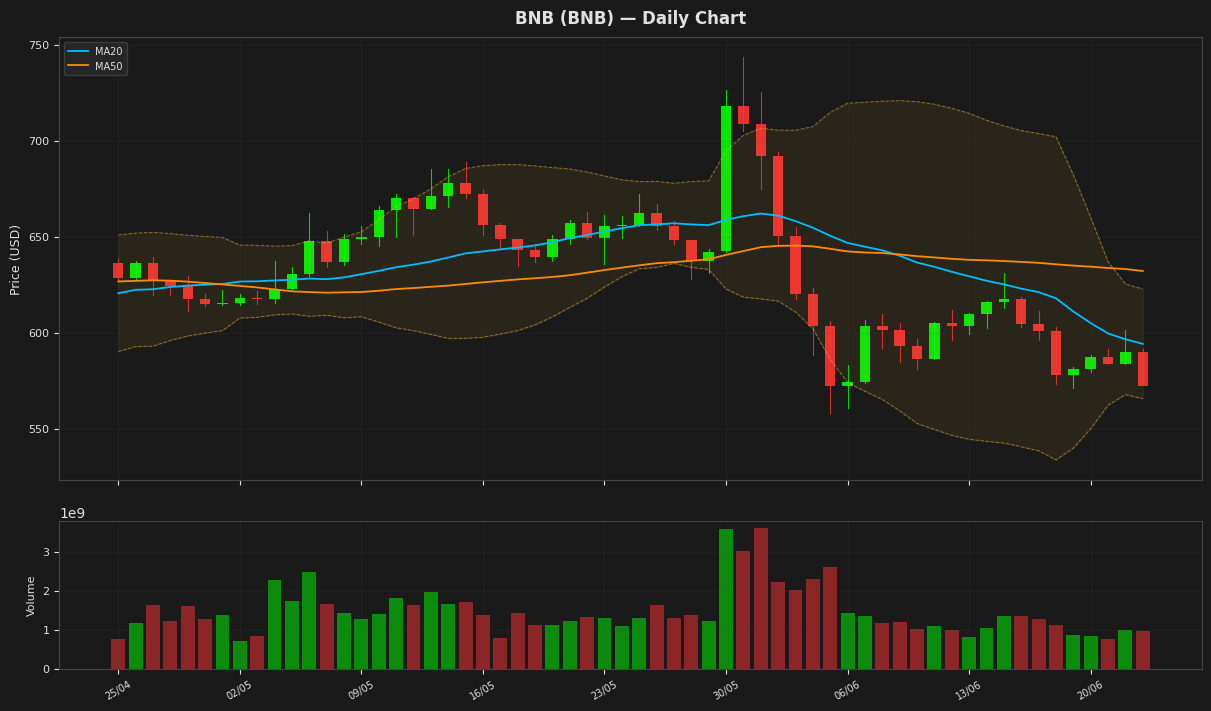
BNB is currently trading at $572.28, showing a decline of 2.99% for the day, with its price hovering near the lower Bollinger Band at $565.69, indicating potential support. The RSI is at 41.26, suggesting the asset is approaching oversold territory, while the MACD is below its signal line, indicating a bearish trend. The price is also below both the MA20 and MA50, further reinforcing the bearish sentiment.
Tron (TRX) — -0.96%
$0.330444 52W: $0.268138 — $0.376332
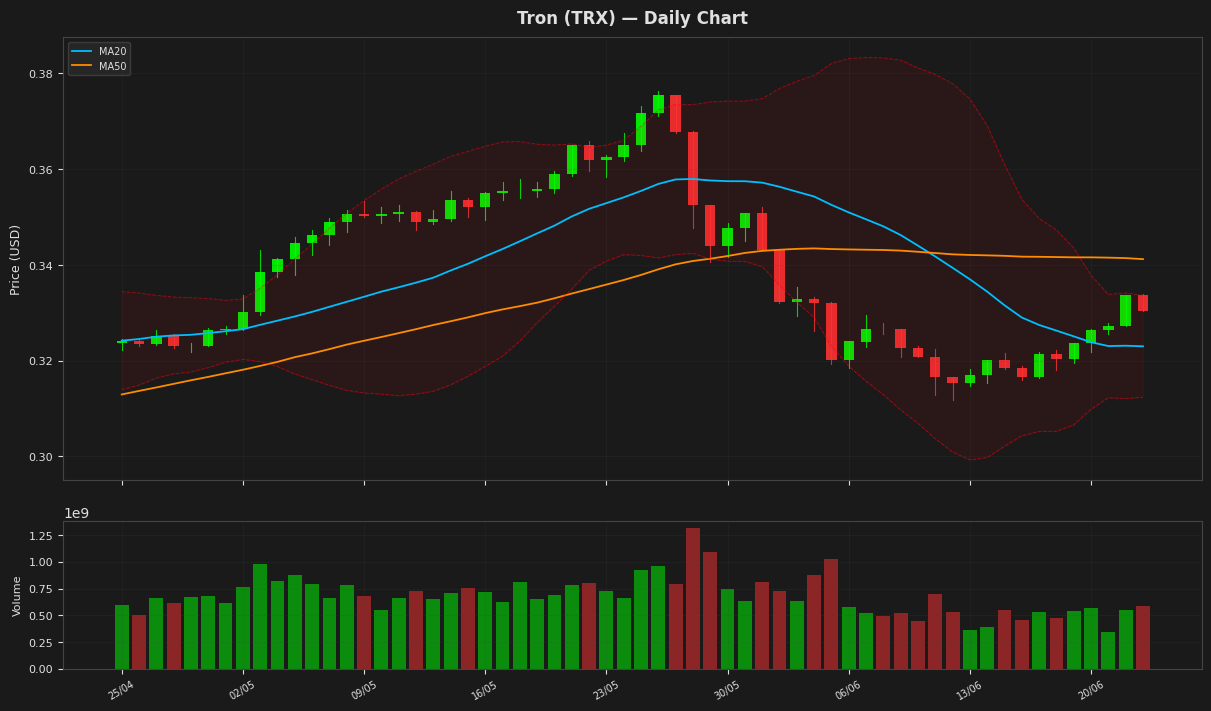
Tron's price is currently at $0.330444, slightly below the upper Bollinger Band at $0.333617, indicating a potential resistance level. The RSI is at 60.25, suggesting a neutral to slightly bullish sentiment. The MACD is negative but above its signal line, indicating a potential bullish crossover. The price is also above the MA20, indicating a short-term uptrend.
Dogecoin (DOGE) — -4.65%
$0.078570 52W: $0.078095 — $0.209315
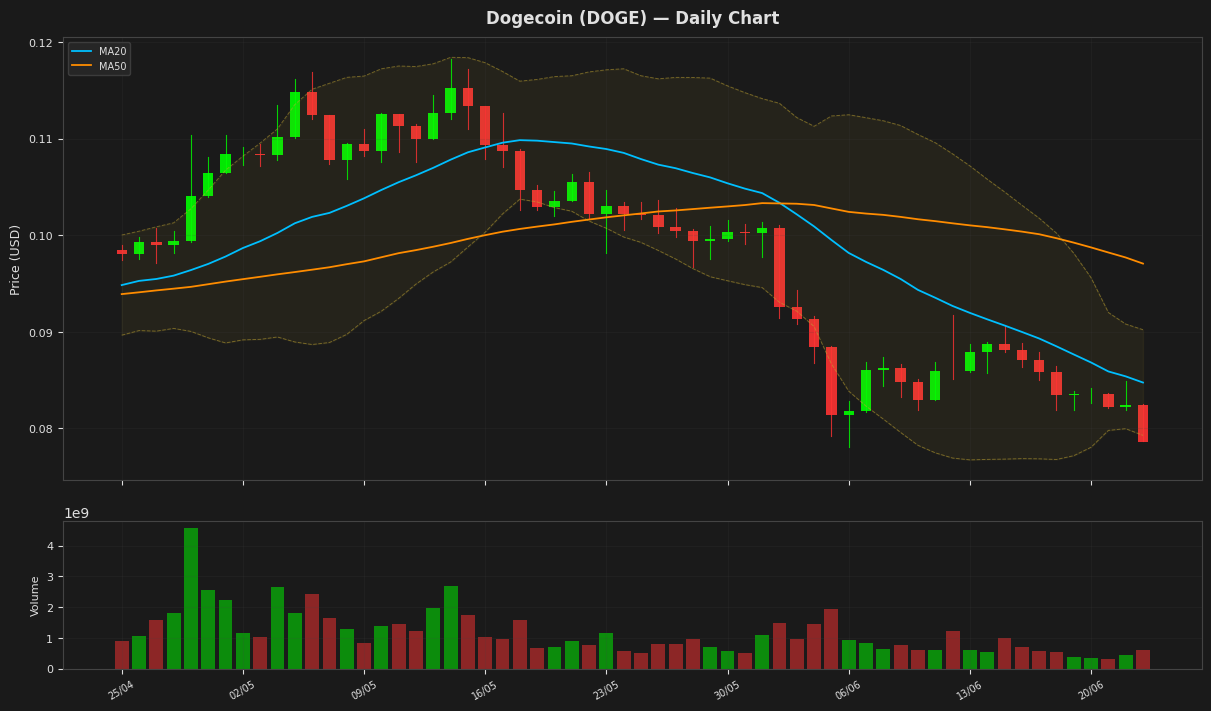
Dogecoin's price is currently at $0.078570, showing a daily decline of 4.65% and trading near its 52-week low of $0.078095. The RSI(14) value of 33.351171 indicates that the cryptocurrency is approaching oversold territory. The MACD is slightly below its signal line, suggesting a bearish trend. The price is also near the lower Bollinger Band at $0.079279, indicating potential support.
Disclaimer
The content on MarketsFN.com is provided for educational and informational purposes only. It does not constitute financial advice or investment recommendations. All investments involve risk. Past performance does not guarantee future results.