Crypto Market Slumps: Ripple, Solana, and BNB Lead Today's Losses
· Crypto · QuoteReporter
Crypto Market Slumps: Ripple, Solana, and BNB Lead Today's Losses
Crypto Market Report | June 24, 2026
📊 Crypto Market Overview
The cryptocurrency market is currently displaying a mixed sentiment, with most major assets trading relatively flat. Bitcoin is hovering around $62,618, having shed a marginal 0.08% today, while its RSI stands at 54.6, indicating a neutral stance. Ethereum is also largely unchanged, up 0.17% to $1,668, with an RSI of 55.7. Other key players like Solana and Tron are showing relative strength, with RSIs above 60, while Ripple and BNB are trading near the 50 mark, suggesting a lack of clear direction.
The macro context is shaped by regulatory developments, with news of OpenPayd securing a MiCA license highlighting the growing adoption of stablecoins in Europe. In contrast, the US is seen to be moving in the opposite direction, with a potential ban on CBDCs until 2030 being considered. The CFTC's lawsuit against Kentucky over the state's prediction market lawsuits adds to the ongoing regulatory scrutiny.
From a technical perspective, the MACD indicators for most major assets are in negative territory, suggesting a bearish trend. Bitcoin's MACD is at -1939.85, while Ethereum's is at -64.77. Dogecoin's RSI of 38.0 is notable, indicating oversold conditions. Overall, the market is characterized by a lack of clear direction, with various assets displaying different technical signals. The ongoing regulatory developments and news flow are likely to continue shaping market sentiment in the near term. As the market digests these developments, traders are likely to remain cautious, awaiting further clarity on the regulatory landscape.
📰 Crypto News
- OpenPayd secures MiCA license as stablecoin adoption grows in Europe
- US nears ban on CBDCs until 2030 as housing bill goes to Trump
- Catholic leaders, US authorities challenge CLARITY Act over illicit activity
- Here’s what happened in crypto today
- Senate Dems urge probe into $500M crypto deal between Trumps, UAE
- StarkWare introduces 'Private KYC' to address personal data breaches
- CFTC sues Kentucky after state’s prediction market lawsuits
- Ethereum’s much-hated staking 'tax' may already be obsolete
- $170M Ether longs liquidated as crypto market tumbles: Is ETH doomed?
- Starmer steps down: What Andy Burnham means for crypto in the UK
- Mark Zuckerberg ordered Meta staff to develop moneyless prediction market: NYT
- CryptoQuant says Michael Saylor's Strategy should halt its bitcoin buying
- Trump lands in Senate's crosshairs over $500 million UAE investment in his crypto venture
- Bitcoin’s ‘OG’ investors have slowed selling in a bullish sign for the market
- Live markets: Bitcoin could drop to $59,000 in the short-term as liquidity dries up
🔍 Technical Analysis
Bitcoin (BTC) — -0.08%
$62,618.68 52W: $59,108.92 — $116,273.31
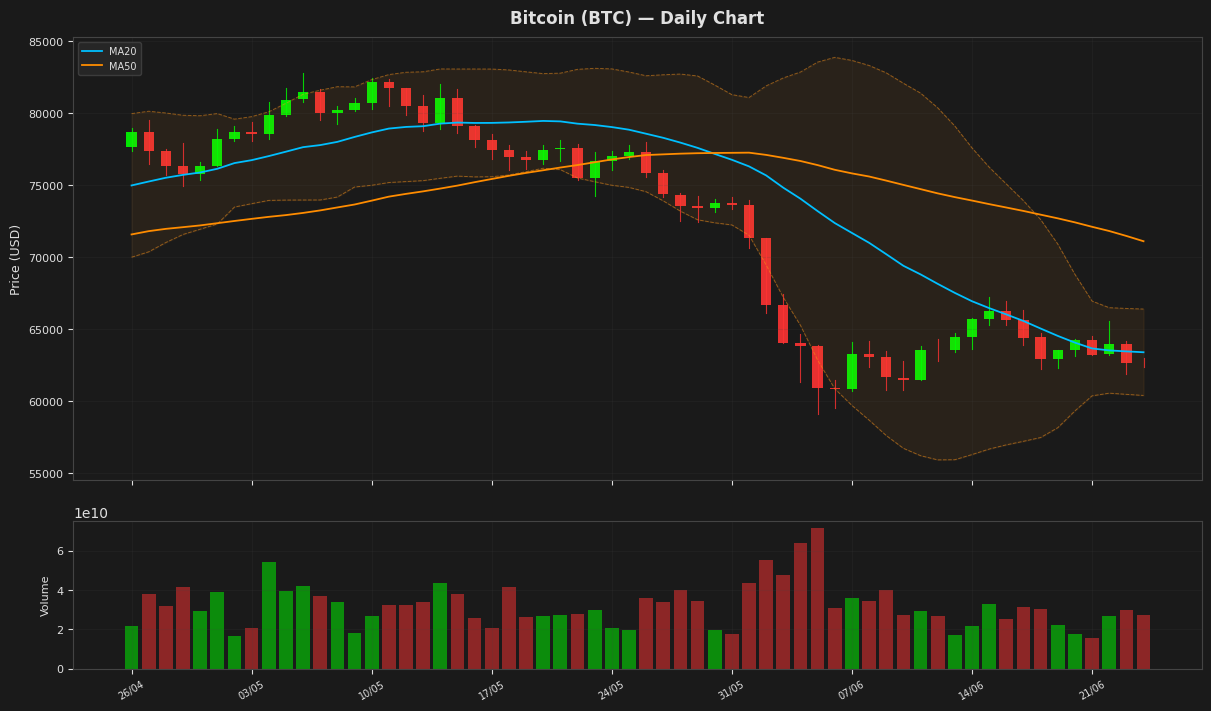
Bitcoin is currently trading at $62,618.68, near the middle of the Bollinger Bands, indicating a lack of strong directional momentum. The RSI is at 54.62, suggesting a neutral market sentiment. The MACD is below its signal line, indicating a potential bearish trend, while the price is above the MA20, showing some short-term support. The ATR remains relatively high, indicating ongoing market volatility.
Ethereum (ETH) — +0.17%
$1,668.29 52W: $1,506.51 — $4,250.67
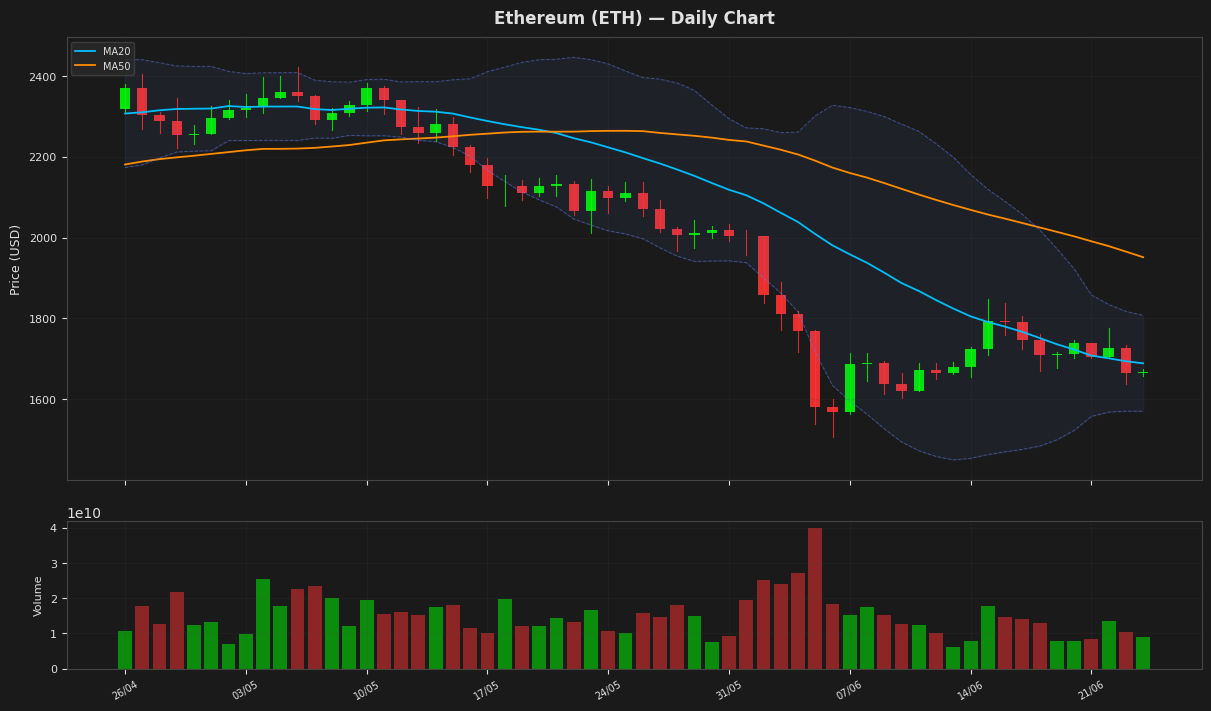
Ethereum is currently trading at $1,668.29, slightly below its 20-day moving average of $1,689.21, indicating a lack of strong directional momentum. The RSI at 55.67 suggests a neutral stance, while the MACD being below its signal line indicates a bearish signal. The price is also below the 50-day moving average, further indicating a potential downtrend.
Ripple (XRP) — -1.00%
$1.0983 52W: $1.0547 — $2.6934
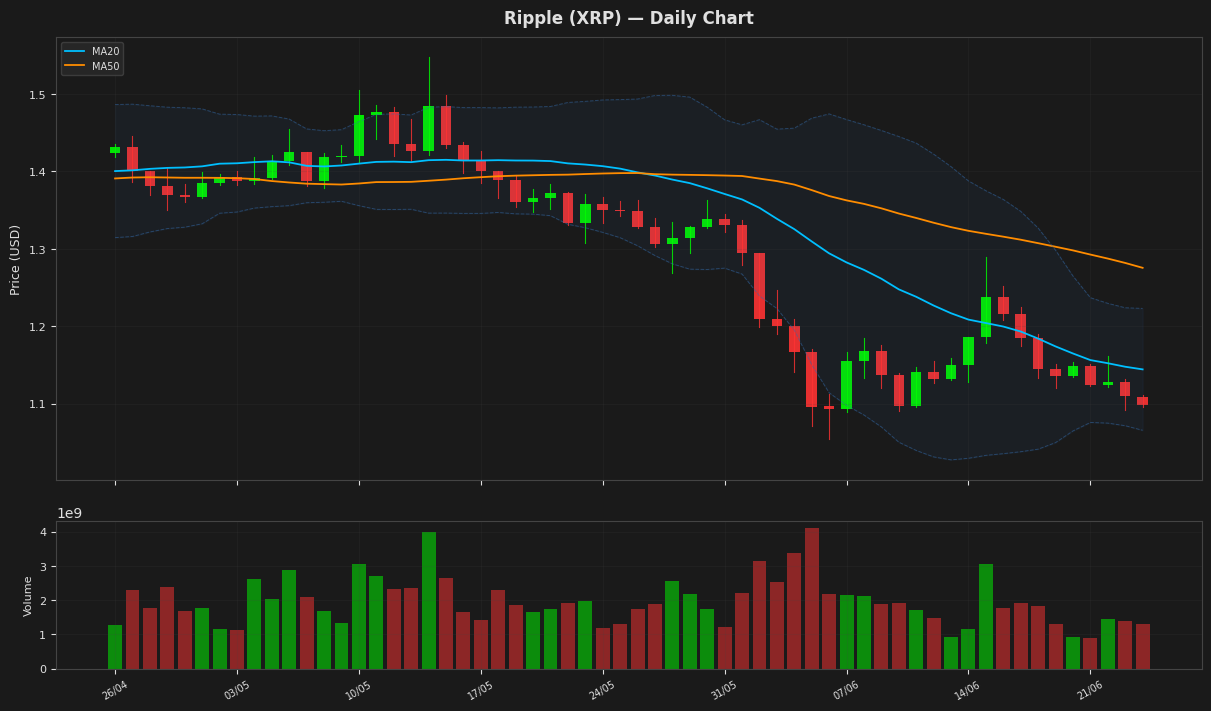
Ripple's price is currently at $1.098300, showing a slight decline, and is positioned between the upper and lower Bollinger Bands, indicating a relatively stable trend. The RSI is near 50, suggesting a neutral market sentiment. The MACD is below the signal line, indicating a potential bearish signal, while the ATR suggests moderate volatility. The price is still above the 52-week low, indicating some support.
Solana (SOL) — -0.44%
$69.3400 52W: $60.4147 — $205.0200
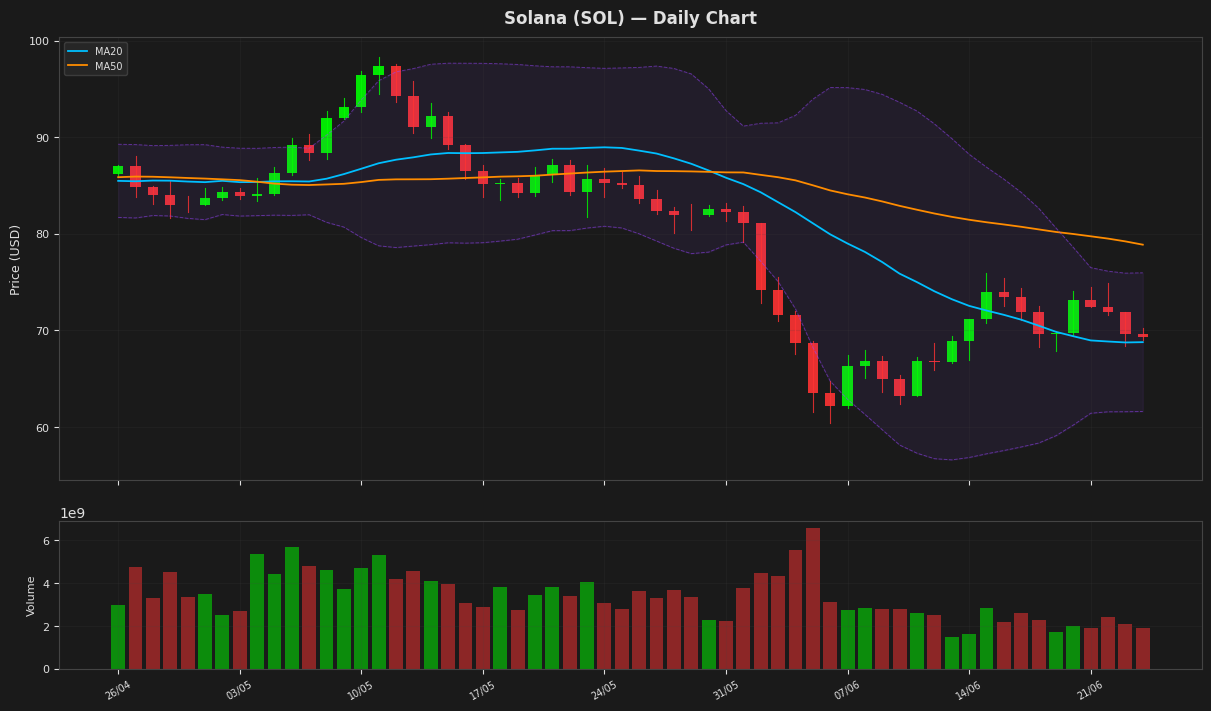
Solana's price is currently at $69.34, slightly above its 20-day moving average of $68.78, indicating a potential support level. The RSI at 63.61 suggests a neutral to slightly bullish sentiment, while the MACD being below its signal line indicates a bearish signal. The price is also below the 50-day moving average and within the upper and lower Bollinger Bands, indicating a possible consolidation phase.
BNB (BNB) — -0.23%
$576.3000 52W: $558.3898 — $1,193.77
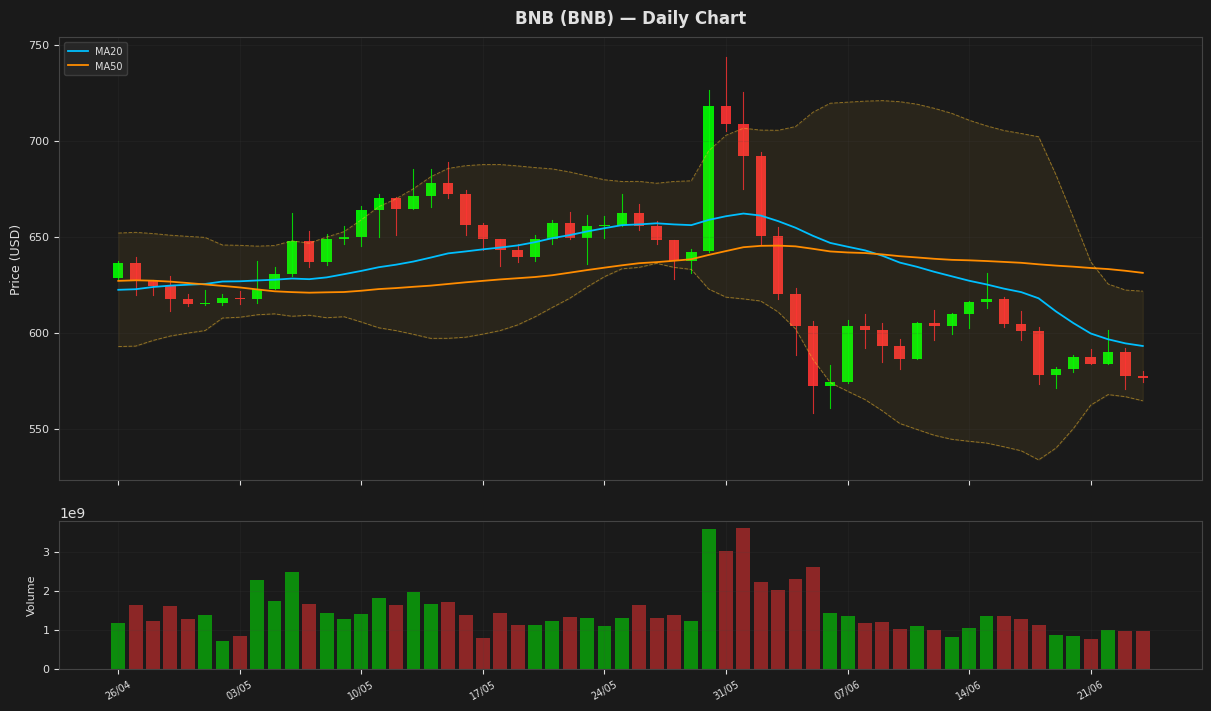
BNB is currently trading at $576.30, slightly above its 52-week low, with a downward trend indicated by its MA20 and MA50 values being above the current price. The RSI is nearing the oversold territory, while the MACD is below its signal line, suggesting bearish momentum. The price is near the lower Bollinger Band, indicating potential support around $564.57.
Tron (TRX) — +0.00%
$0.328902 52W: $0.268138 — $0.376332
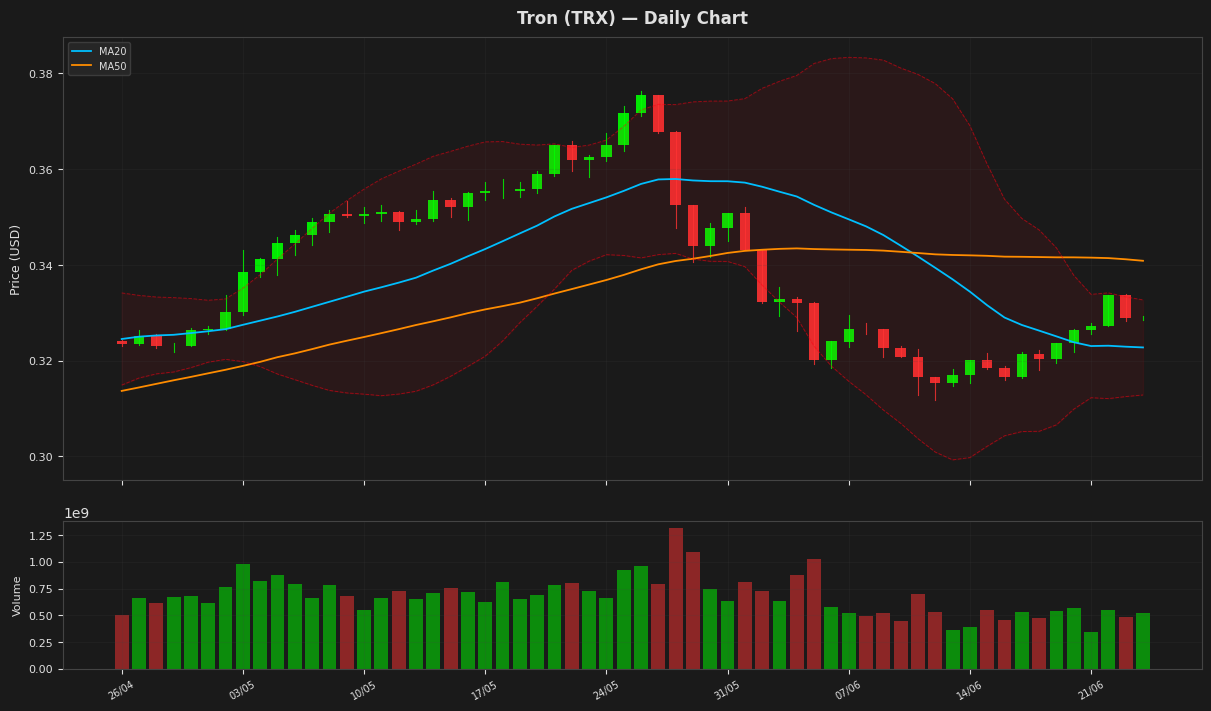
Tron's price is currently stable at $0.328902, indicating a neutral trend as it is hovering near the upper Bollinger Band at 0.332685. The RSI is at 60.75838, suggesting a slightly bullish sentiment, while the MACD is below the signal line, indicating a potential bearish crossover. The short-term moving average MA20 is at 0.32276, above which the price is trading, indicating some support.
Dogecoin (DOGE) — +0.14%
$0.078950 52W: $0.078095 — $0.209315
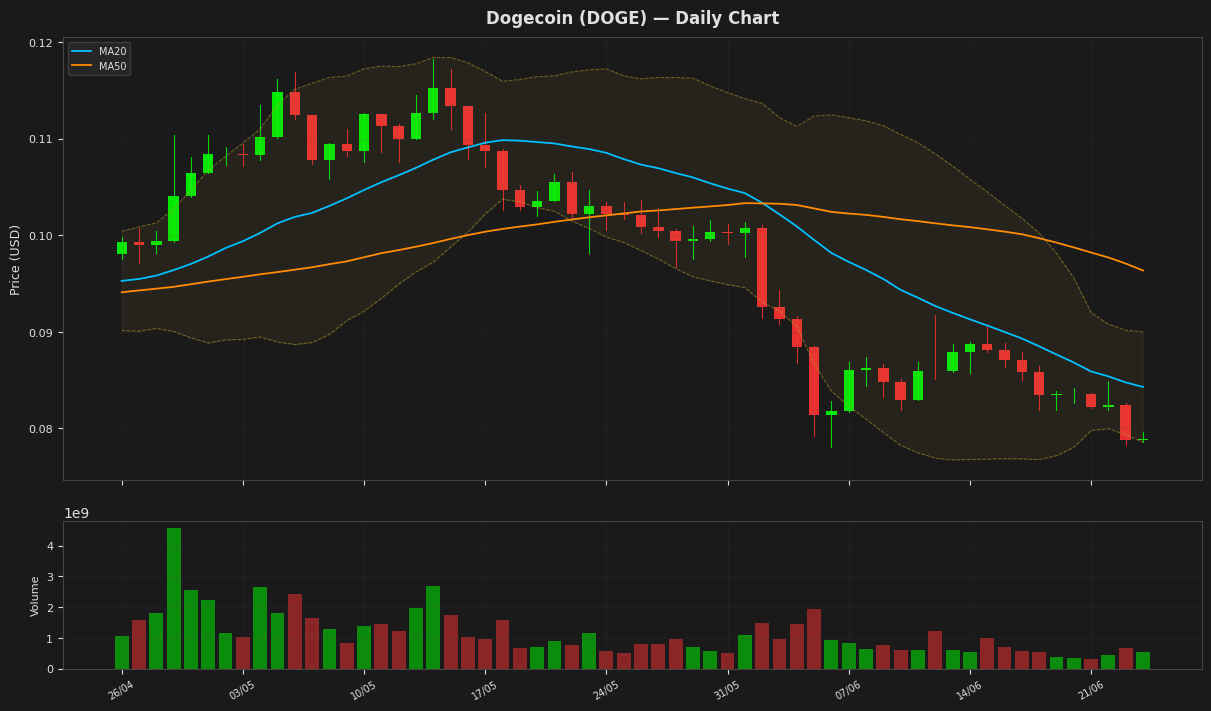
Dogecoin is currently trading at $0.078950, near its 52-week low of $0.078095, and below both its MA20 and MA50, indicating a bearish trend. The RSI is at 37.992439, suggesting the coin is approaching oversold territory. The Bollinger Bands indicate that the price is near the lower band at $0.078577, potentially signaling a support level. The MACD is below its signal line, further indicating a bearish sentiment.
Disclaimer
The content on MarketsFN.com is provided for educational and informational purposes only. It does not constitute financial advice or investment recommendations. All investments involve risk. Past performance does not guarantee future results.