Crypto Market Update: Dogecoin, Ethereum, and Ripple Show Minor Declines
· Crypto · QuoteReporter
Crypto Market Update: Dogecoin, Ethereum, and Ripple Show Minor Declines
Crypto Market Report | August 18, 2026
📊 Crypto Market Overview
The cryptocurrency market is experiencing a cautious sentiment as Bitcoin (BTC) hovers around $64,152, reflecting a modest decline of 0.55% today. This slight downturn comes amidst a backdrop of mixed macroeconomic indicators, including rising yields and fluctuating oil prices, which have dampened risk appetite among investors. Ethereum (ETH) is also down by 0.82%, trading at $1,896.60, while other major altcoins like Ripple (XRP) and Dogecoin (DOGE) have similarly faced losses, with XRP notably dipping below $1 for the first time since early 2024.
Among the key movers, Tron (TRX) stands out with a 0.53% gain, buoyed by a strong RSI of 68.1, indicating bullish momentum. Conversely, XRP's RSI of 26.9 suggests it is heavily oversold, which could be a point of concern for traders. Technical indicators reveal that Bitcoin's MACD is currently negative at -106.9159, suggesting bearish momentum, while Ethereum's MACD of 9.1593 indicates a more stable outlook.
Recent news has also influenced market dynamics, with the Ethereum Foundation warning that certain tools may become incompatible following the upcoming Glamsterdam upgrade. Meanwhile, South Korea's Jeonbuk Bank has adopted Ripple's technology for cross-border payments, highlighting ongoing institutional interest in blockchain solutions. However, the market is also grappling with negative headlines, including allegations against a Ponzi scheme mastermind and regulatory scrutiny of crypto companies. As the market navigates these developments, traders remain vigilant, particularly as Bitcoin's price level is closely watched for potential leveraged positions.
Among the key movers, Tron (TRX) stands out with a 0.53% gain, buoyed by a strong RSI of 68.1, indicating bullish momentum. Conversely, XRP's RSI of 26.9 suggests it is heavily oversold, which could be a point of concern for traders. Technical indicators reveal that Bitcoin's MACD is currently negative at -106.9159, suggesting bearish momentum, while Ethereum's MACD of 9.1593 indicates a more stable outlook.
Recent news has also influenced market dynamics, with the Ethereum Foundation warning that certain tools may become incompatible following the upcoming Glamsterdam upgrade. Meanwhile, South Korea's Jeonbuk Bank has adopted Ripple's technology for cross-border payments, highlighting ongoing institutional interest in blockchain solutions. However, the market is also grappling with negative headlines, including allegations against a Ponzi scheme mastermind and regulatory scrutiny of crypto companies. As the market navigates these developments, traders remain vigilant, particularly as Bitcoin's price level is closely watched for potential leveraged positions.
📰 Crypto News
- BitBox patches ‘severe’ wallet flaws that could put funds at risk
- Here’s what happened in crypto today
- Ethereum Foundation warns some tools may break with Glamsterdam upgrade
- South Korea’s Jeonbuk Bank taps Ripple for cross-border payments
- Alleged $165M crypto Ponzi mastermind faces US charges after Fiji deportation
- ‘Fabricated rumors’ about BitMart founder, Binance bStocks dominate: Asia Express
- OCC approves Trump family crypto company for trust charter
- Live updates: Bitcoin holds $64,000 as surging yields and oil drain risk appetite
- The bitcoin price level where leveraged bulls could get whacked
- XRP sinks below $1 for first time since 2024 as Korean bank adopts Ripple Payments
- Monad, an Ethereum rival, offered early investors up to $60 million to cash out. Almost all said no
- Bitcoin climbs above $64,000 while most majors slip
- Kraken parent Payward joins Anthropic’s Project Glasswing for AI security push
- Kraken Parent Payward Joins Glasswing, Gets Access to Claude Mythos to Hunt Security Flaws
- Minnesota Says xAI's Grok Created 'Marketplace for Digital Sexual Violence'
🔍 Technical Analysis
Bitcoin (BTC) — -0.55%
$64,152.57 52W: $57,747.77 — $97,860.60
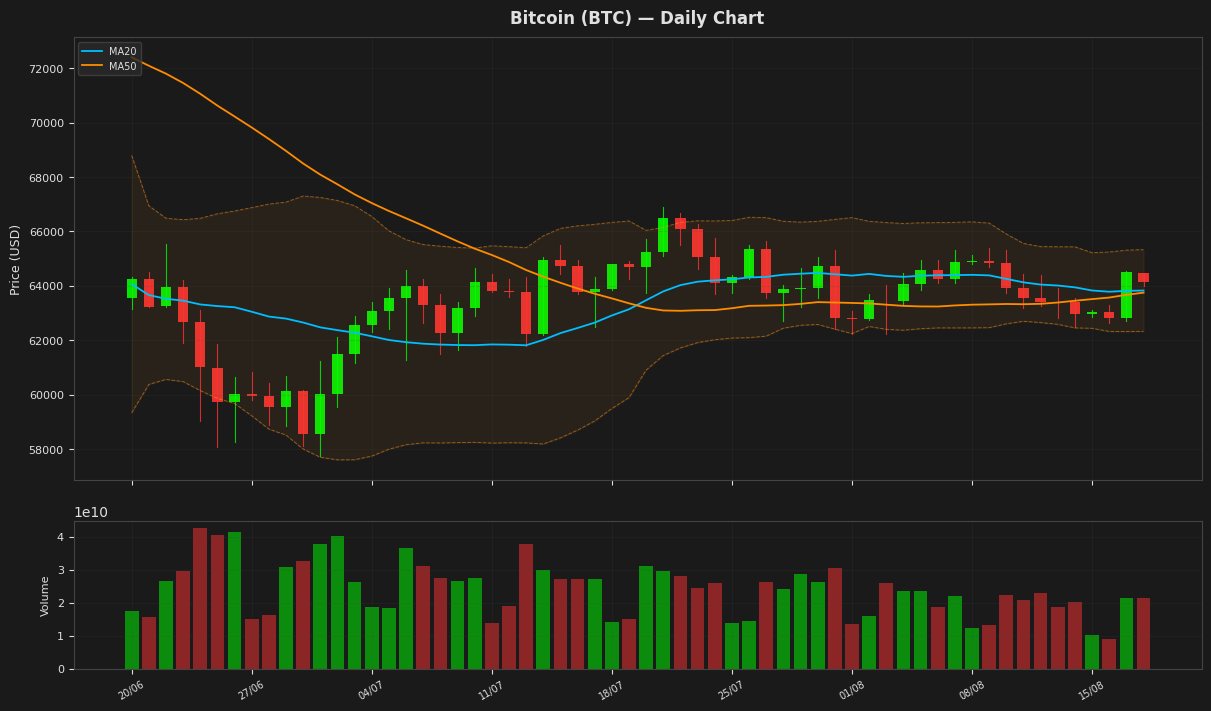
Bitcoin is currently trading at $64,152.57, reflecting a slight daily decline of 0.55%. The price is hovering around the 20-day moving average of $63,826.75 and the 50-day moving average of $63,748.27, indicating a potential consolidation phase. The RSI at 50.84 suggests that Bitcoin is neither overbought nor oversold, while the MACD shows a bearish trend with a negative value. The Bollinger Bands indicate that Bitcoin is trading within a range, with the upper band at $65,331.62 and the lower band at $62,321.88, suggesting limited volatility in the near term.
Ethereum (ETH) — -0.82%
$1,896.60 52W: $1,506.51 — $3,446.62
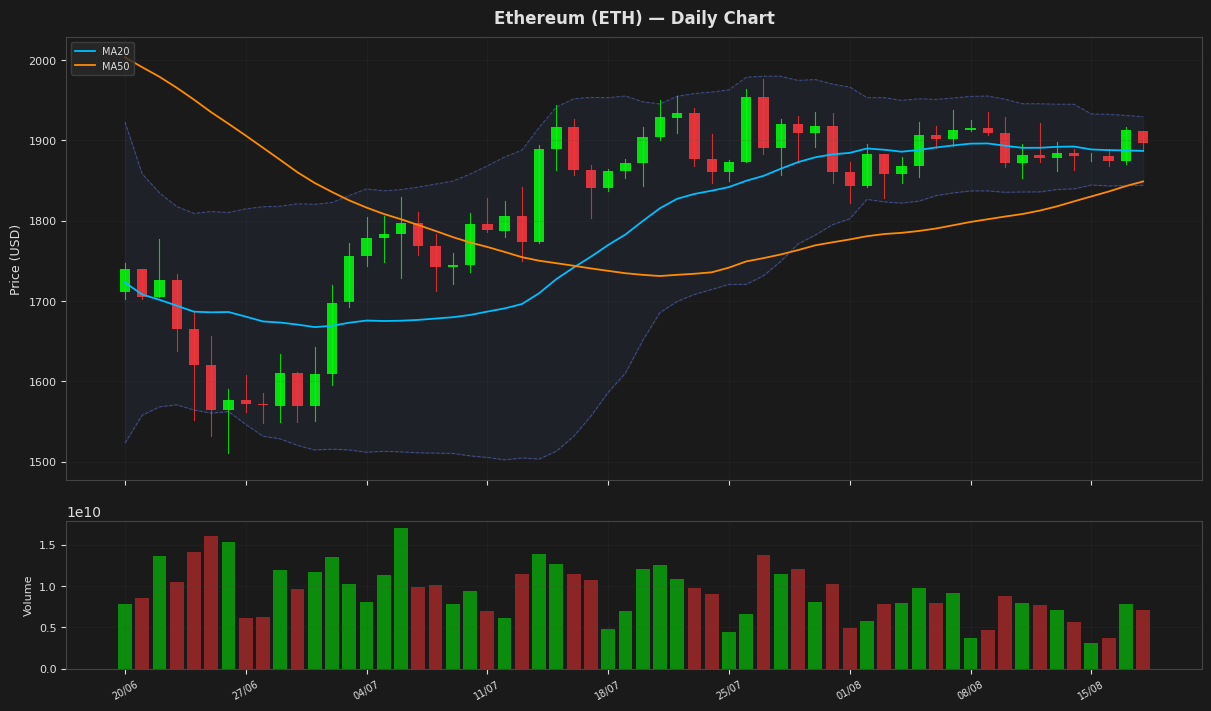
Ethereum is currently trading at $1,896.60, reflecting a daily decline of 0.82%. The price is above both the 20-day moving average (MA20) of $1,886.77 and the 50-day moving average (MA50) of $1,848.78, indicating a bullish trend in the short to medium term. The Relative Strength Index (RSI) at 57.67 suggests that ETH is approaching overbought territory, while the MACD indicates a positive momentum, though the signal line is above the MACD line, suggesting potential weakening momentum ahead. The Bollinger Bands show resistance at $1,929.44 and support at $1,844.10, with the Average True Range (ATR) indicating moderate volatility.
Ripple (XRP) — -0.72%
$0.995400 52W: $0.988422 — $2.4103
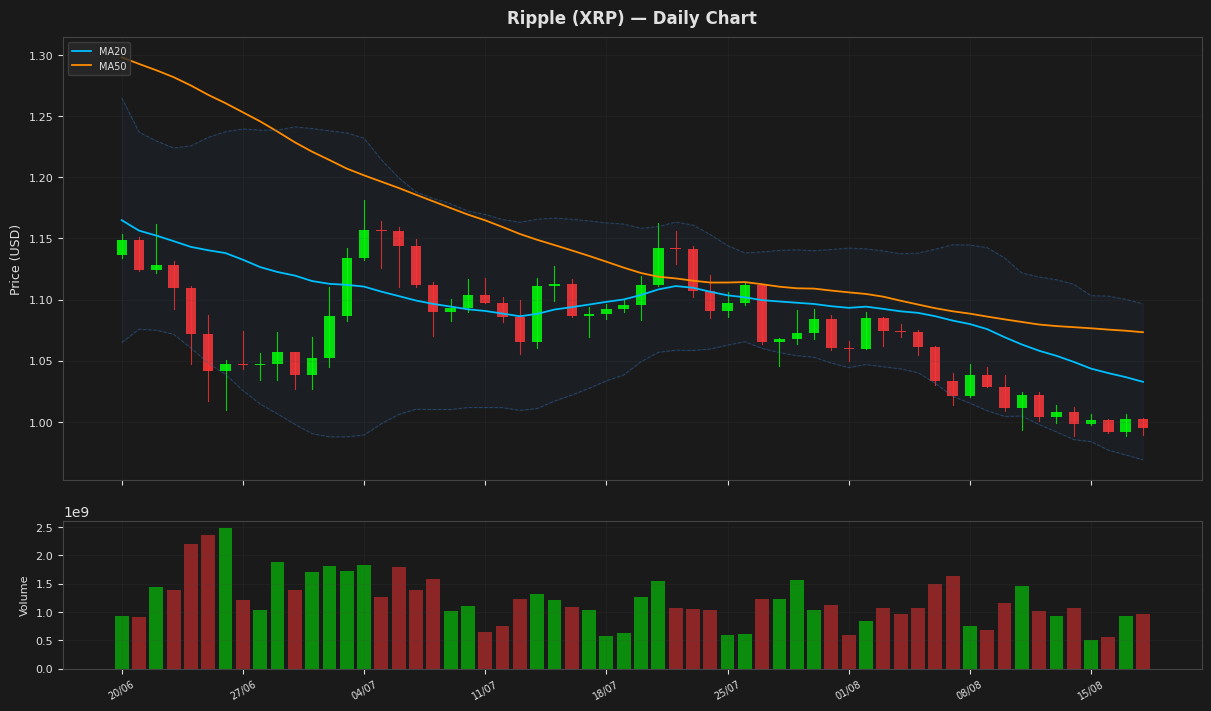
Ripple (XRP) is currently trading at $0.995400, reflecting a daily decline of 0.72%. The price is below both the 20-day moving average (MA20) of 1.032767 and the 50-day moving average (MA50) of 1.073332, indicating a bearish trend. The RSI is at 26.95, suggesting that XRP is in oversold territory, while the MACD shows a slight negative momentum. With the price approaching the lower Bollinger Band at 0.969017, there may be potential for a rebound if buying interest increases.
Solana (SOL) — -0.12%
$75.8500 52W: $60.4147 — $148.2160
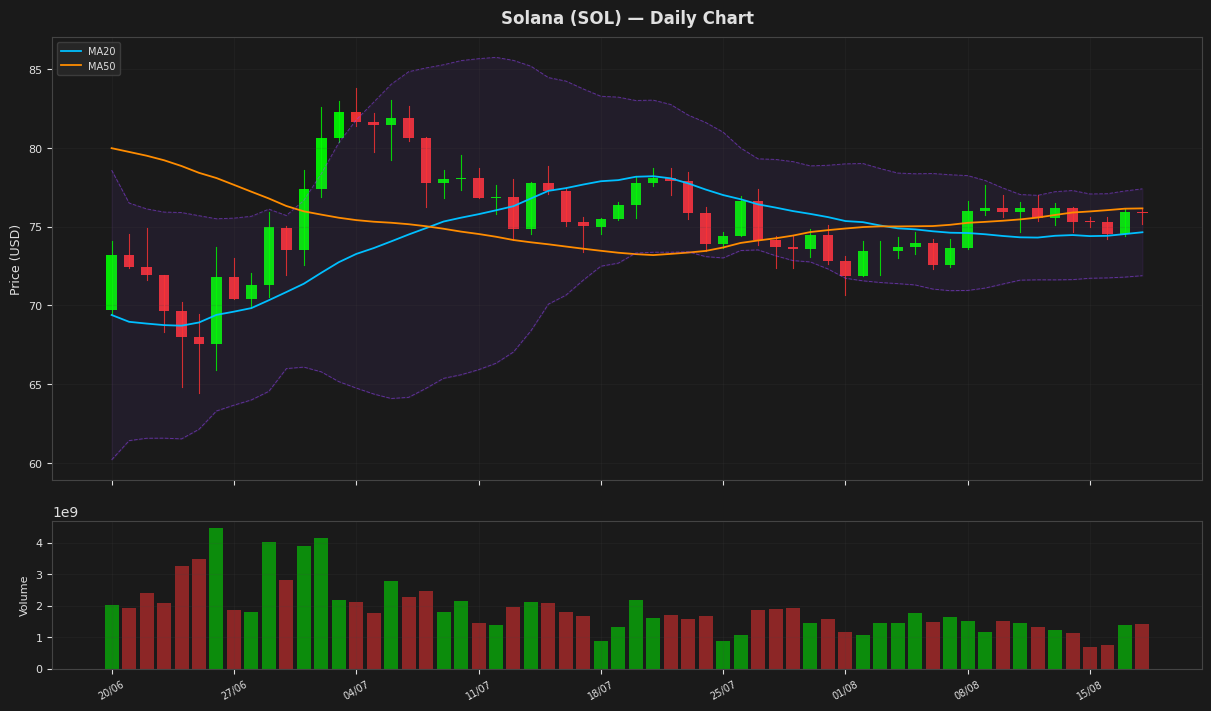
Solana is currently trading at $75.85, reflecting a slight daily decline of 0.12%. The price is above the 20-day moving average of $74.65 but below the 50-day moving average of $76.16, indicating a potential consolidation phase. The RSI at 60.41 suggests that Solana is nearing overbought conditions, while the MACD shows a positive divergence, hinting at potential upward momentum. The Bollinger Bands indicate a range between $71.89 and $77.40, suggesting that the price may remain within this channel unless a breakout occurs.
BNB (BNB) — -0.47%
$602.3200 52W: $538.5992 — $954.8583
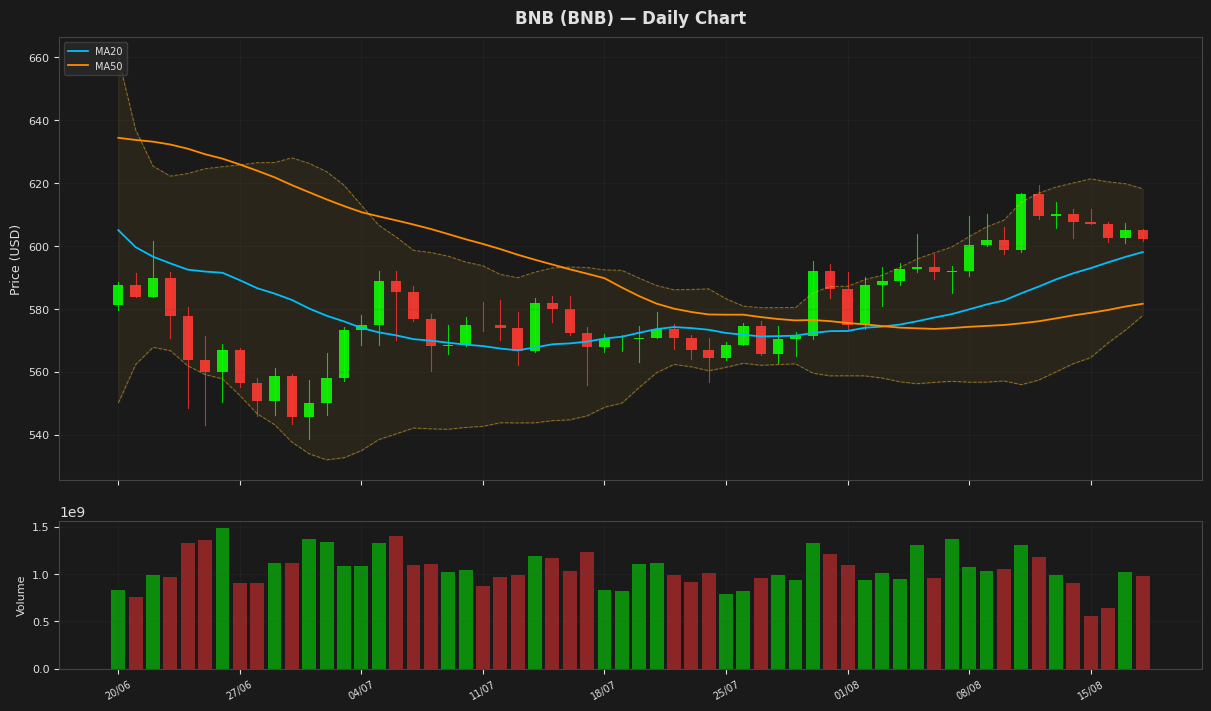
BNB is currently trading at $602.32, experiencing a slight daily decline of 0.47%. The price is above both the 20-day moving average (MA20) of $598.07 and the 50-day moving average (MA50) of $581.63, indicating a bullish trend in the short to medium term. The RSI is at 58.93, suggesting that BNB is approaching overbought territory, while the MACD shows a positive momentum with a value of 7.26, although it is slightly below the signal line. The Bollinger Bands indicate that the price is within a range, with the upper band at $618.21 and the lower band at $577.93, suggesting potential volatility ahead.
Tron (TRX) — +0.53%
$0.332824 52W: $0.268138 — $0.376332
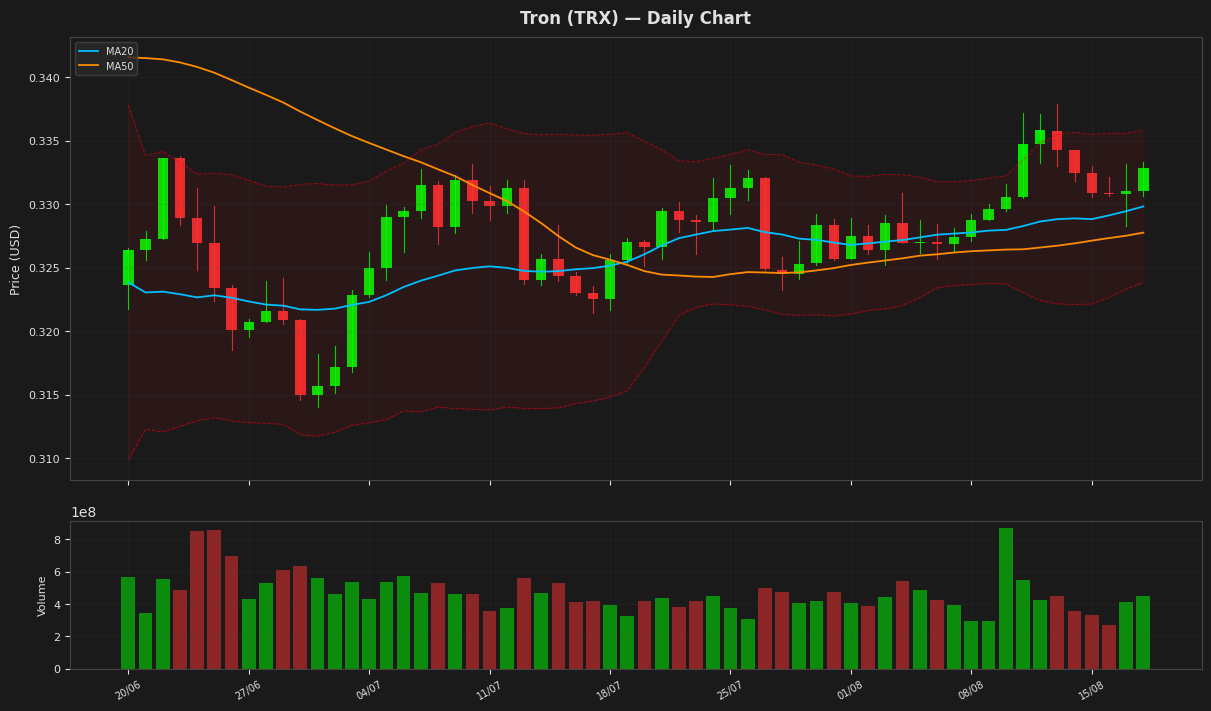
Tron (TRX) is currently trading at $0.332824, reflecting a daily increase of 0.53%. The price is above both the 20-day moving average (MA20) of 0.329828 and the 50-day moving average (MA50) of 0.327762, indicating a bullish trend. The relative strength index (RSI) at 68.08 suggests that TRX is approaching overbought territory, while the MACD shows a slight upward momentum. With the price nearing the upper Bollinger Band at 0.335812, potential resistance may be encountered in the short term.
Dogecoin (DOGE) — -0.89%
$0.069720 52W: $0.067973 — $0.156091
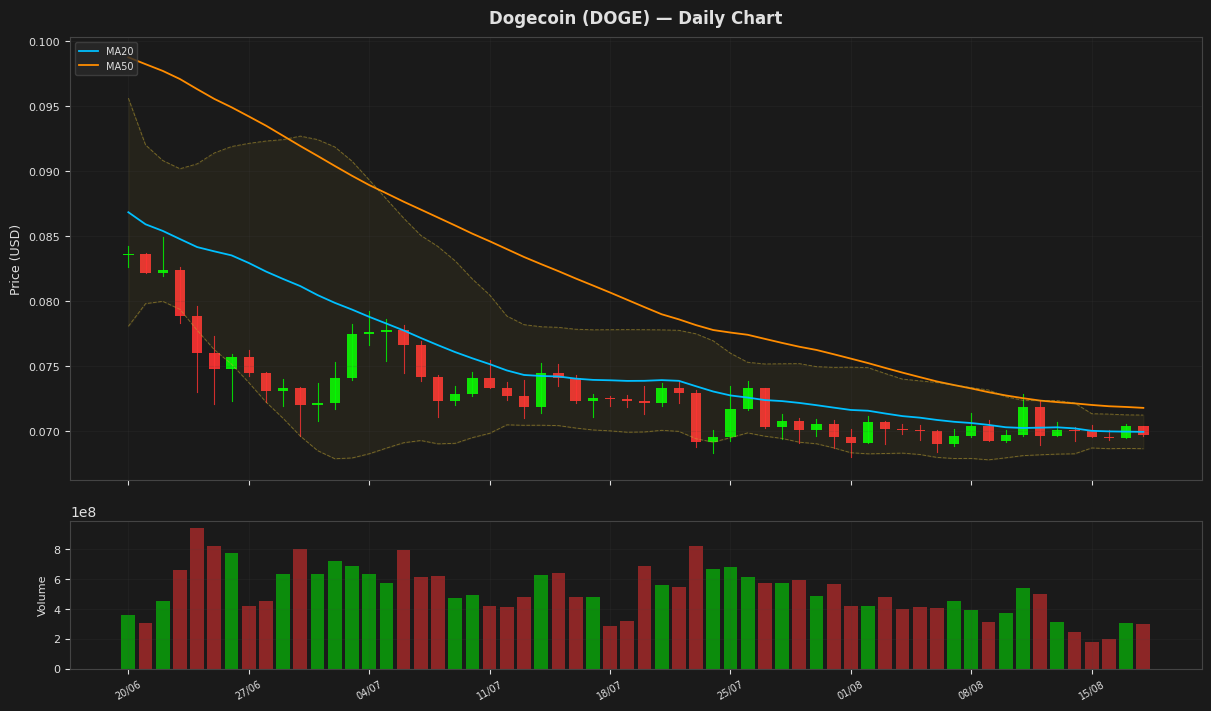
Dogecoin is currently trading at $0.069720, reflecting a slight daily decline of 0.89%. The price is positioned just above the lower Bollinger Band at $0.068634, indicating potential support, while the moving averages suggest a bearish trend as the MA20 is below the MA50. The RSI is at 48.53, indicating that Dogecoin is neither overbought nor oversold, and the MACD shows a negative value, suggesting a lack of upward momentum. Overall, the technical indicators point to a cautious outlook for Dogecoin in the near term.
Disclaimer
The content on MarketsFN.com is provided for educational and informational purposes only. It does not constitute financial advice or investment recommendations. All investments involve risk. Past performance does not guarantee future results.