Ethereum Dips 0.64% to $2,260 with Neutral RSI 50.9
· Crypto · QuoteReporter
Ethereum Dips 0.64% to $2,260 with Neutral RSI 50.9
Ethereum (ETH/USD) | May 13, 2026 $2,260.0000 -0.64%
🔍 Technical Analysis
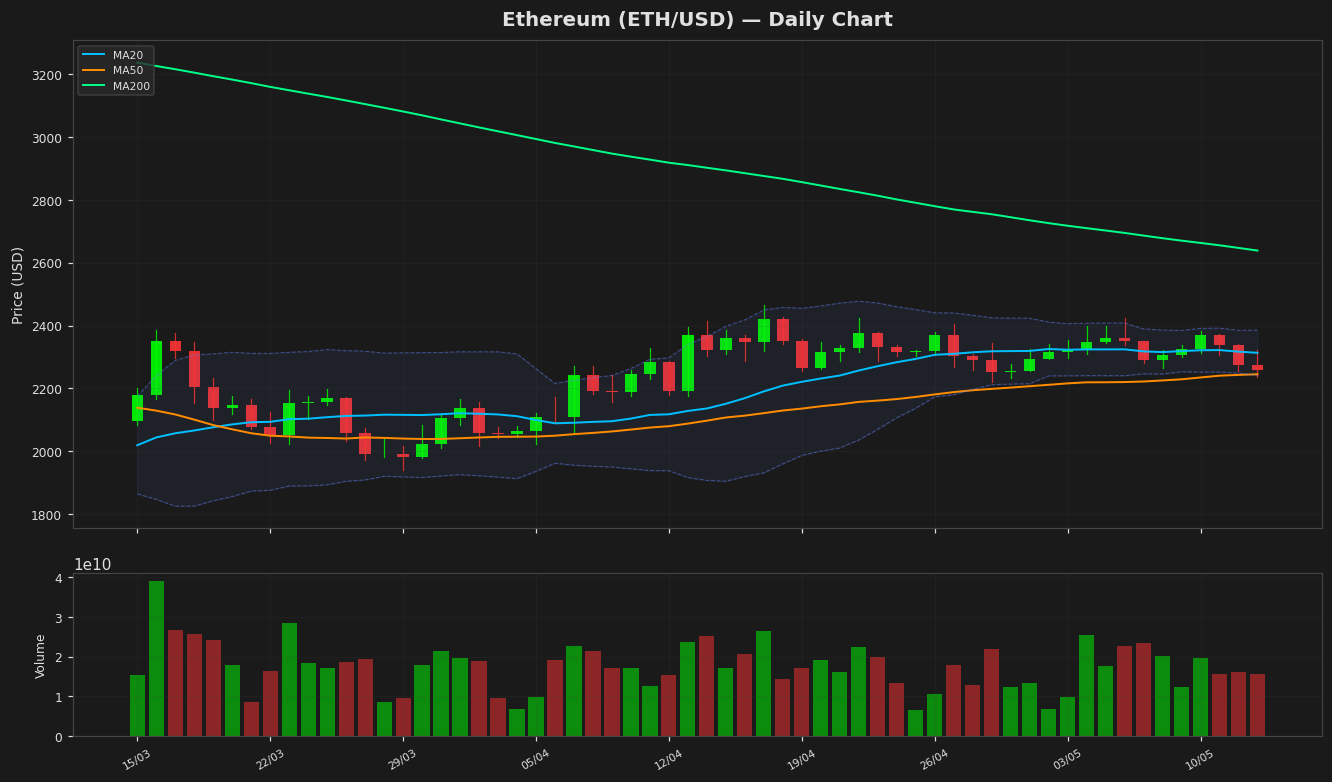
Ethereum (ETH) is currently trading at $2,260.00, reflecting a daily decline of 0.64%. The price action shows ETH hovering near key levels after a period of consolidation, with recent bearish momentum evident in the slight downward movement. Analyzing moving averages, the price is below the 20-day MA of $2,313.28, indicating short-term bearish pressure, but above the 50-day MA of $2,245.06, suggesting medium-term support. However, it remains significantly below the 200-day MA of $2,638.49, highlighting a longer-term downtrend.
Using Bollinger Bands, ETH is trading near the lower band of $2,241.06, with the upper band at $2,385.50, indicating potential oversold conditions or a continuation of bearish momentum if the lower band is breached. The RSI (14) stands at 50.90, reflecting neutral momentum, neither overbought nor oversold, which aligns with the current consolidation phase. On the MACD, the line at 10.13 is below the signal line of 20.34, confirming bearish momentum in the short term, though the narrowing gap suggests a potential reversal.
Key support lies at $2,241 (BB lower band) and $2,200, with resistance at $2,313 (MA20) and $2,385 (BB upper band). A break below $2,241 could target the yearly low of $1,748.63, while a move above $2,313 may signal bullish recovery toward $2,638 (MA200). The ATR of 65.29 indicates moderate volatility, warranting caution in position sizing.
Technical Metrics
| Metric | Value |
|---|---|
| Current Price | $2,260.0000 |
| Daily Change | -0.64% |
| MA 20 | $2,313.2799 |
| % from MA20 | -2.30% |
| MA 50 | $2,245.0607 |
| % from MA50 | +0.67% |
| MA 200 | $2,638.4891 |
| % from MA200 | -14.34% |
| BB Upper | $2,385.5002 |
| % from BB Upper | -5.26% |
| BB Lower | $2,241.0595 |
| % from BB Lower | +0.85% |
| RSI (14) | 50.90 |
| MACD | 10.131818 |
| MACD Signal | 20.345214 |
| ATR (14) | 65.290737 |
| 3-Day High | $2,374.3035 |
| 3-Day Low | $2,235.5913 |
| 52-Week High | $4,763.3613 |
| % from 52W High | -52.55% |
| 52-Week Low | $1,748.6277 |
| % from 52W Low | +29.24% |
| YTD High | $3,397.8977 |
| % from YTD High | -33.49% |
| YTD Low | $1,748.6277 |
| % from YTD Low | +29.24% |
📊 Market Commentary
Ethereum (ETH) is currently trading at $2,260.00, reflecting a slight decline of 0.64% over the past 24 hours. Market sentiment around ETH appears neutral at the moment, as indicated by an RSI of 50.9, which sits near the midpoint of the 30-70 range, suggesting neither overbought nor oversold conditions. This balance indicates that traders are cautiously observing the asset without strong directional bias in the short term.
Looking at the 52-week range, ETH has fluctuated between a low of $1,748.6277 and a high of $4,763.3613, positioning the current price closer to the lower end of this spectrum. Key price levels to monitor include the psychological support around $2,200, which could act as a near-term floor if selling pressure intensifies. On the upside, resistance near $2,400 remains significant, as it has historically capped upward moves in recent months.
Traders are closely watching on-chain activity, including staking metrics related to Ethereum’s transition to Proof of Stake, as well as broader market dynamics such as macroeconomic indicators and Bitcoin’s price action, which often influences ETH. Additionally, network upgrades and developer activity continue to play a role in shaping long-term sentiment. For now, the market remains in a consolidation phase, with participants likely awaiting clearer catalysts to drive momentum in either direction. Volume trends and breakout signals from current levels will be critical for gauging the next major move.
Disclaimer
The content on MarketsFN.com is provided for educational and informational purposes only. It does not constitute financial advice or investment recommendations. All investments involve risk. Cryptocurrency markets are highly volatile. Past performance does not guarantee future results.