Ethereum Dips Below $1,650 as RSI Hints at Potential Rebound
· Crypto · QuoteReporter
Ethereum Dips Below $1,650 as RSI Hints at Potential Rebound
Ethereum (ETH/USD) | June 23, 2026 $1,649.9600 -4.43%
🔍 Technical Analysis
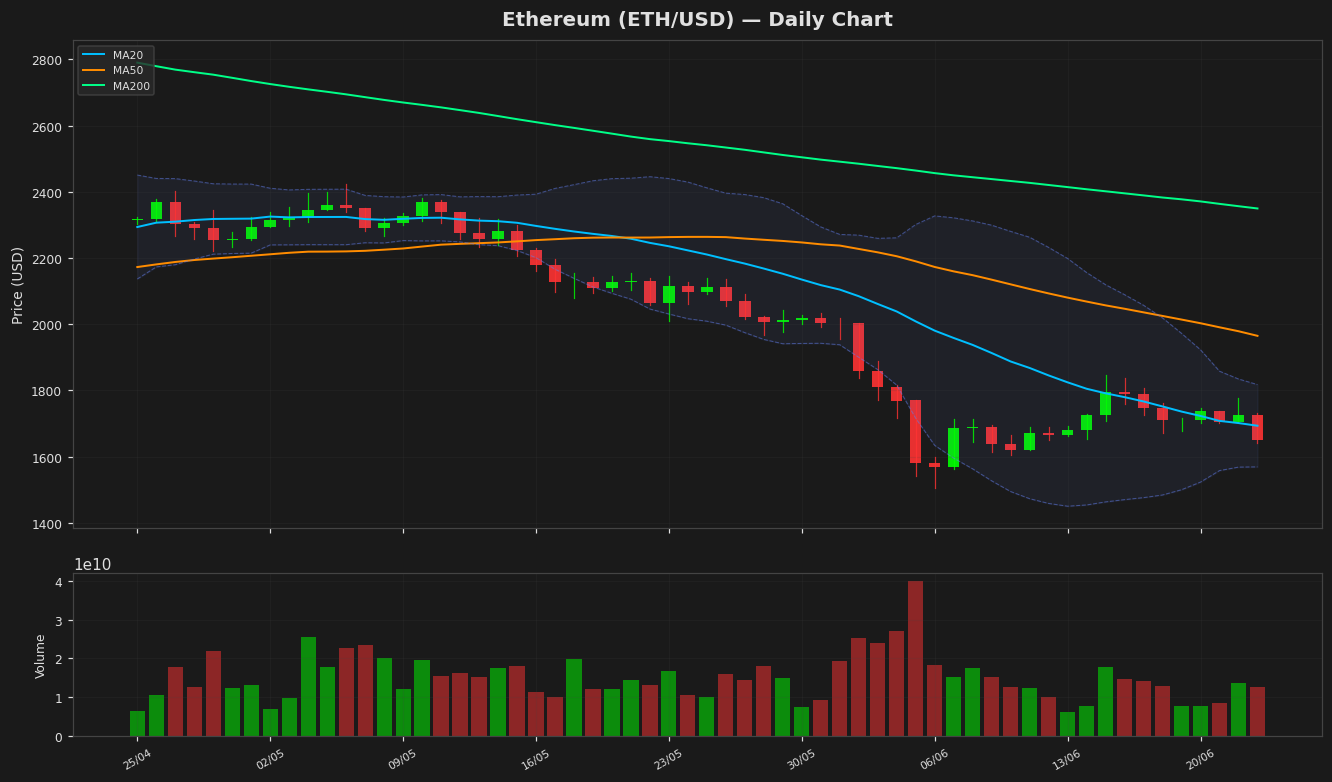
Ethereum (ETH) is currently trading at $1,649.96, reflecting a daily decline of 4.43%. The price action shows ETH struggling to maintain momentum below the 20-day moving average (MA20) at $1,693.50, signaling short-term bearish pressure. The 50-day moving average (MA50) at $1,965.10 and the 200-day moving average (MA200) at $2,349.87 highlight a broader downtrend, with ETH trading well below these key levels. The Bollinger Bands indicate volatility contraction, with the upper band at $1,817.81 and the lower band at $1,569.19, suggesting potential for a breakout or breakdown depending on market sentiment.
The Relative Strength Index (RSI) at 51.35 is neutral, neither overbought nor oversold, indicating a lack of strong directional bias. The Moving Average Convergence Divergence (MACD) histogram shows a negative value of -66.76, with the signal line at -81.74, reinforcing bearish momentum in the near term. Key support levels to watch are $1,569 (Bollinger Lower Band) and the yearly low of $1,506.51, while resistance lies at $1,817.81 (Bollinger Upper Band) and the MA20 at $1,693.50. The Average True Range (ATR) of 68.10 suggests moderate volatility, implying cautious trading conditions. Ethereum remains in a downtrend, needing a sustained break above MA20 to shift near-term sentiment.
The Relative Strength Index (RSI) at 51.35 is neutral, neither overbought nor oversold, indicating a lack of strong directional bias. The Moving Average Convergence Divergence (MACD) histogram shows a negative value of -66.76, with the signal line at -81.74, reinforcing bearish momentum in the near term. Key support levels to watch are $1,569 (Bollinger Lower Band) and the yearly low of $1,506.51, while resistance lies at $1,817.81 (Bollinger Upper Band) and the MA20 at $1,693.50. The Average True Range (ATR) of 68.10 suggests moderate volatility, implying cautious trading conditions. Ethereum remains in a downtrend, needing a sustained break above MA20 to shift near-term sentiment.
Technical Metrics
| Metric | Value |
|---|---|
| Current Price | $1,649.9600 |
| Daily Change | -4.43% |
| MA 20 | $1,693.4974 |
| % from MA20 | -2.57% |
| MA 50 | $1,965.0982 |
| % from MA50 | -16.04% |
| MA 200 | $2,349.8704 |
| % from MA200 | -29.79% |
| BB Upper | $1,817.8064 |
| % from BB Upper | -9.23% |
| BB Lower | $1,569.1884 |
| % from BB Lower | +5.15% |
| RSI (14) | 51.35 |
| MACD | -66.758463 |
| MACD Signal | -81.738947 |
| ATR (14) | 68.098642 |
| 3-Day High | $1,776.8322 |
| 3-Day Low | $1,641.0892 |
| 52-Week High | $4,250.6699 |
| % from 52W High | -61.18% |
| 52-Week Low | $1,506.5057 |
| % from 52W Low | +9.52% |
| YTD High | $3,397.8977 |
| % from YTD High | -51.44% |
| YTD Low | $1,506.5057 |
| % from YTD Low | +9.52% |
📊 Market Commentary
**Ethereum (ETH) Market Commentary**
Ethereum (ETH) is currently trading at **$1,649.96**, down **4.43%** today, reflecting broader market weakness. The Relative Strength Index (RSI) at **51.3** suggests neutral momentum, neither oversold nor overbought, indicating a balanced but cautious sentiment. ETH remains within its 52-week range of **$1,506.51 – $4,250.67**, with the lower bound acting as a critical support level.
Market sentiment is mixed, influenced by macroeconomic uncertainty and fluctuating risk appetite in crypto. Traders are closely monitoring **$1,600** as near-term support—a breach could signal further downside toward the yearly low. Conversely, resistance is seen around **$1,700–$1,750**, where previous consolidation occurred.
Key factors influencing ETH include network activity, gas fees, and adoption trends, particularly in decentralized finance (DeFi) and layer-2 scaling solutions. The upcoming Ethereum network upgrades, including further optimizations post-Merge, remain a focal point for long-term holders.
Institutional interest and regulatory developments also play a role, with the SEC’s stance on ETH’s classification as a security still under scrutiny. Derivatives data shows subdued open interest, suggesting traders are waiting for clearer signals before taking aggressive positions.
Overall, ETH’s price action reflects cautious sentiment, with technical indicators pointing to range-bound movement unless a decisive breakout occurs. Traders are watching volume trends and macroeconomic catalysts for directional cues.
Disclaimer
The content on MarketsFN.com is provided for educational and informational purposes only. It does not constitute financial advice or investment recommendations. All investments involve risk. Cryptocurrency markets are highly volatile. Past performance does not guarantee future results.