Ethereum Eyes $1,700 as RSI Nears 50, Bulls Gain Momentum
· Crypto · QuoteReporter
Ethereum Eyes $1,700 as RSI Nears 50, Bulls Gain Momentum
Ethereum (ETH/USD) | June 25, 2026 $1,650.3300 +1.88%
🔍 Technical Analysis
### Ethereum (ETH) Technical Analysis
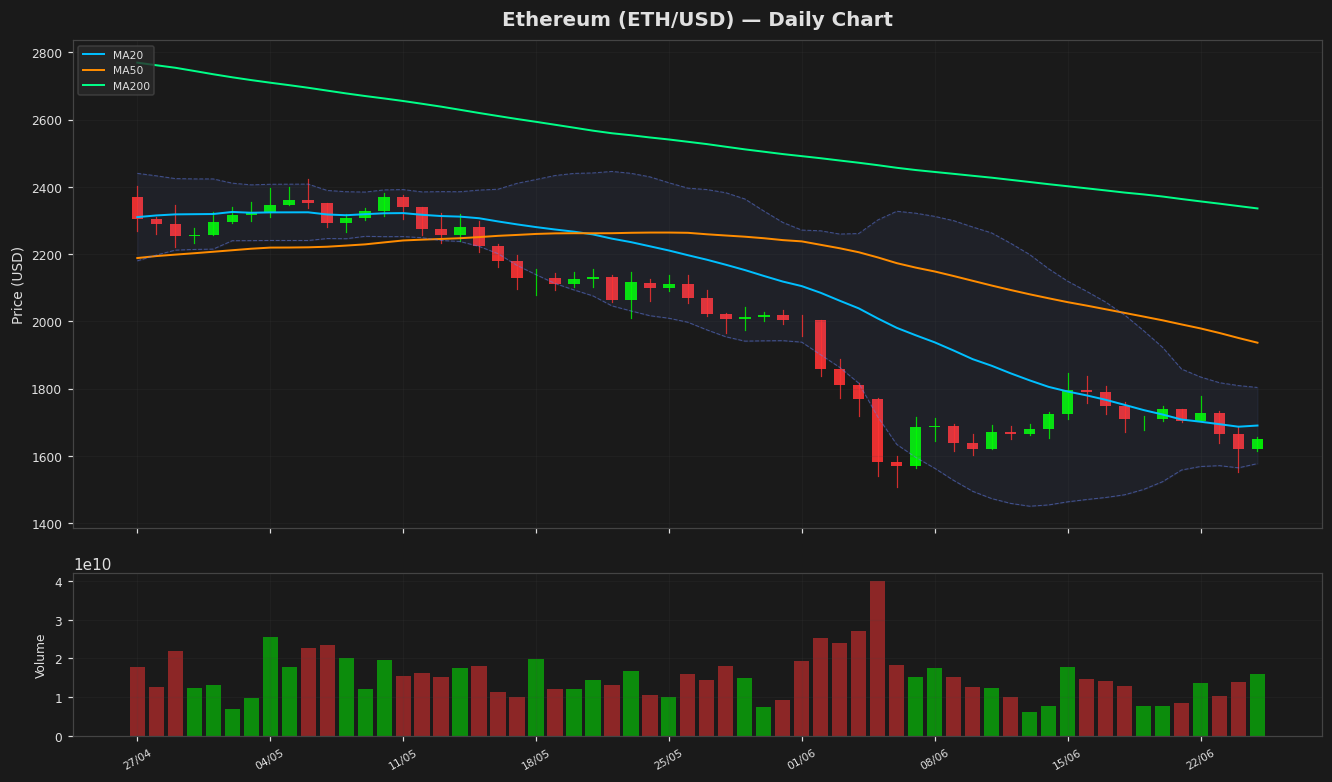
Ethereum is currently trading at **$1,650.33**, up **1.88%** on the day, showing mild bullish momentum. The price remains below key moving averages, indicating persistent bearish pressure in the medium to long term. The **20-day MA ($1,690.26)** acts as immediate resistance, while the **50-day MA ($1,936.57)** and **200-day MA ($2,335.79)** reinforce the downtrend, suggesting ETH is in a broader bearish phase unless it reclaims these levels.
Bollinger Bands show a narrowing range, with the upper band at **$1,803.48** and the lower band at **$1,577.05**, signaling reduced volatility. The price hovering near the mid-band suggests consolidation, with a potential breakout needed for directional bias.
The **RSI (14) at 47.54** is neutral, neither oversold nor overbought, indicating indecision among traders. The **MACD (-67.85)** remains below its signal line (-76.70), confirming bearish momentum, though the histogram shows slight convergence, hinting at weakening downward pressure.
Key support lies at the **52-week low of $1,506.51**, while resistance is at the **20-day MA ($1,690.26)** and the **YTD high of $3,397.90**. A break below support could trigger further declines, whereas reclaiming the 20-day MA may signal a short-term recovery. The **ATR (14) at 71.69** suggests moderate volatility, reinforcing the need for confirmation before trend continuation.
In summary, ETH remains in a bearish structure, requiring a decisive move above the 20-day MA to shift sentiment. Traders should watch for RSI divergence and MACD crossover for potential reversals.
Technical Metrics
| Metric | Value |
|---|---|
| Current Price | $1,650.3300 |
| Daily Change | +1.88% |
| MA 20 | $1,690.2619 |
| % from MA20 | -2.36% |
| MA 50 | $1,936.5731 |
| % from MA50 | -14.78% |
| MA 200 | $2,335.7916 |
| % from MA200 | -29.35% |
| BB Upper | $1,803.4769 |
| % from BB Upper | -8.49% |
| BB Lower | $1,577.0470 |
| % from BB Lower | +4.65% |
| RSI (14) | 47.54 |
| MACD | -67.845108 |
| MACD Signal | -76.703732 |
| ATR (14) | 71.690805 |
| 3-Day High | $1,733.6123 |
| 3-Day Low | $1,551.4843 |
| 52-Week High | $4,250.6699 |
| % from 52W High | -61.17% |
| 52-Week Low | $1,506.5057 |
| % from 52W Low | +9.55% |
| YTD High | $3,397.8977 |
| % from YTD High | -51.43% |
| YTD Low | $1,506.5057 |
| % from YTD Low | +9.55% |
📊 Market Commentary
**Ethereum (ETH) Market Commentary**
Ethereum (ETH) is trading at $1,650.33, up 1.88% today, as the broader crypto market shows cautious optimism. The Relative Strength Index (RSI) at 47.5 suggests ETH is neither overbought nor oversold, indicating neutral momentum. Over the past 52 weeks, ETH has traded between $1,506.51 and $4,250.67, reflecting significant volatility amid macroeconomic uncertainty and shifting crypto market dynamics.
Market sentiment remains mixed. On-chain activity shows steady network usage, but ETH has struggled to break key resistance levels decisively. Traders are closely watching the $1,700 level, which has acted as both support and resistance in recent weeks. A sustained move above this level could signal renewed bullish interest, while failure to hold may see a retest of the $1,600 support zone.
The upcoming Ethereum network upgrades, including further developments in layer-2 scaling solutions, continue to be a focal point for long-term investors. However, short-term price action remains influenced by macroeconomic factors, including Fed policy and risk asset performance.
Volume remains subdued compared to previous bull cycles, suggesting cautious participation. Traders are monitoring Bitcoin’s price action for directional cues, as ETH often correlates with BTC in the near term. With the RSI neutral, ETH’s next move may depend on broader market sentiment rather than internal catalysts alone.
Disclaimer
The content on MarketsFN.com is provided for educational and informational purposes only. It does not constitute financial advice or investment recommendations. All investments involve risk. Cryptocurrency markets are highly volatile. Past performance does not guarantee future results.