Ethereum Tests Key Support as RSI Nears Oversold
· Crypto · QuoteReporter
Ethereum Tests Key Support as RSI Nears Oversold
Ethereum (ETH/USD) | June 26, 2026 $1,561.4100 -0.22%
🔍 Technical Analysis
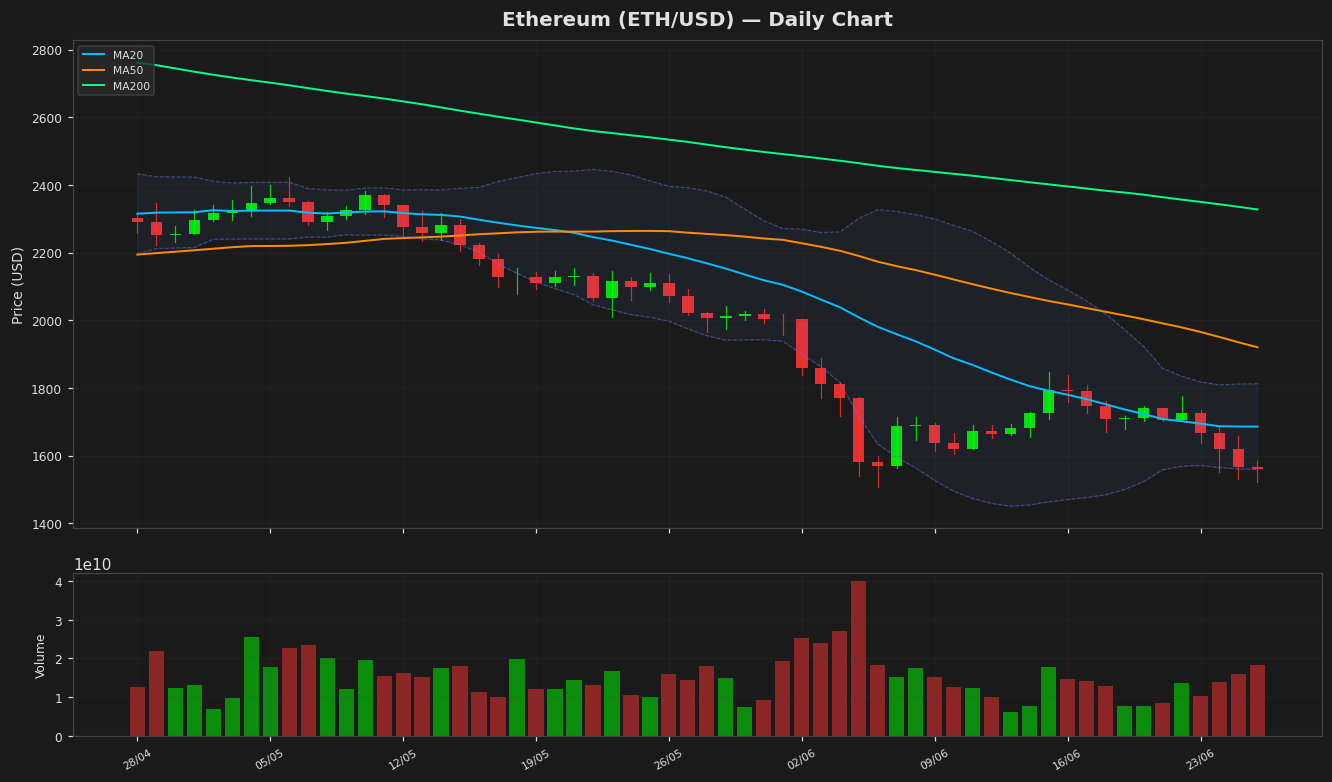
Ethereum (ETH) is currently trading at $1,561.41, showing a slight daily decline of 0.22%. The price remains below key moving averages, indicating bearish momentum. The 20-day MA at $1,685.62 acts as immediate resistance, while the 50-day MA at $1,920.27 and the 200-day MA at $2,327.55 suggest stronger overhead supply. Bollinger Bands highlight volatility compression, with the upper band at $1,812.47 and the lower band at $1,558.76. The price hovering near the lower band signals potential oversold conditions, though a break below could accelerate downside momentum.
The RSI at 38.89 reflects weakening bullish momentum but remains above oversold territory (30), leaving room for further downside. The MACD histogram at -78.82, below its signal line at -78.22, confirms bearish divergence, though the narrowing gap hints at potential slowing momentum. Key support lies at $1,558.76 (Bollinger lower band), followed by the 52-week low of $1,506.51. Resistance levels are $1,685.62 (20-day MA) and $1,920.27 (50-day MA). The ATR at 79.27 suggests moderate volatility, indicating cautious market sentiment.
Year-to-date, ETH has struggled to reclaim its $3,397.90 high, remaining in a downtrend. A sustained break below $1,506.51 could trigger deeper losses, while reclaiming the 20-day MA may signal short-term recovery. Traders should monitor RSI and MACD for potential reversals.
Technical Metrics
| Metric | Value |
|---|---|
| Current Price | $1,561.4100 |
| Daily Change | -0.22% |
| MA 20 | $1,685.6184 |
| % from MA20 | -7.37% |
| MA 50 | $1,920.2689 |
| % from MA50 | -18.69% |
| MA 200 | $2,327.5451 |
| % from MA200 | -32.92% |
| BB Upper | $1,812.4721 |
| % from BB Upper | -13.85% |
| BB Lower | $1,558.7646 |
| % from BB Lower | +0.17% |
| RSI (14) | 38.89 |
| MACD | -78.821949 |
| MACD Signal | -78.218827 |
| ATR (14) | 79.276088 |
| 3-Day High | $1,687.4923 |
| 3-Day Low | $1,520.5581 |
| 52-Week High | $4,250.6699 |
| % from 52W High | -63.27% |
| 52-Week Low | $1,506.5057 |
| % from 52W Low | +3.64% |
| YTD High | $3,397.8977 |
| % from YTD High | -54.05% |
| YTD Low | $1,506.5057 |
| % from YTD Low | +3.64% |
📊 Market Commentary
**Ethereum (ETH) Market Commentary**
Ethereum (ETH) is currently trading at $1,561.41, down 0.22% today, as the broader crypto market shows muted activity. The Relative Strength Index (RSI) at 38.9 suggests ETH is nearing oversold territory but has not yet reached extreme levels, indicating potential for further downside or consolidation before a reversal. Over the past 52 weeks, ETH has traded between $1,506.51 and $4,250.67, reflecting significant volatility and a steep decline from its highs amid macroeconomic pressures and reduced risk appetite.
Market sentiment remains cautious, with traders closely monitoring Ethereum’s network activity, including gas fees and decentralized application (dApp) usage, for signs of demand. The upcoming Ethereum network upgrades, particularly the continued transition to a proof-of-stake (PoS) model, remain a focal point for long-term investors.
Key technical levels to watch include the psychological support at $1,500, which has held firm in recent weeks, and resistance near $1,650, where selling pressure has previously intensified. A break below $1,500 could trigger further downside toward the yearly low, while a sustained move above $1,650 may signal short-term bullish momentum.
Traders are also eyeing Bitcoin’s price action, as ETH often correlates with BTC’s movements. With macroeconomic uncertainty persisting, including Fed policy and inflation concerns, ETH’s near-term direction may hinge on broader market trends rather than standalone fundamentals.
Disclaimer
The content on MarketsFN.com is provided for educational and informational purposes only. It does not constitute financial advice or investment recommendations. All investments involve risk. Cryptocurrency markets are highly volatile. Past performance does not guarantee future results.