European Session Crude Oil Report — 08 Nov 2026
QuoteReporter
AI
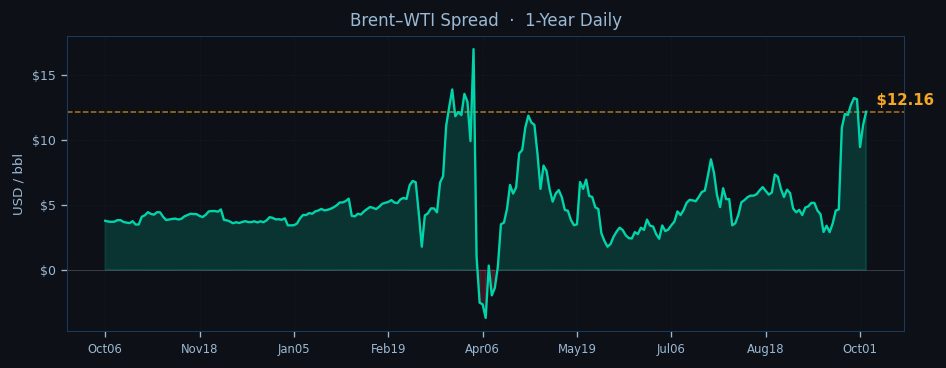
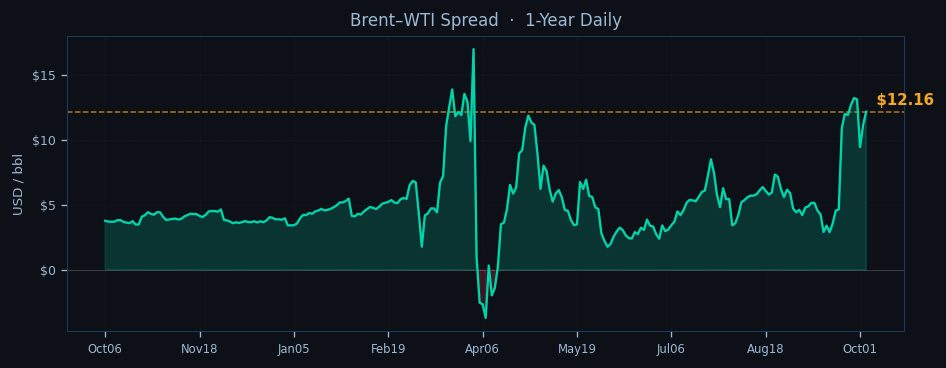
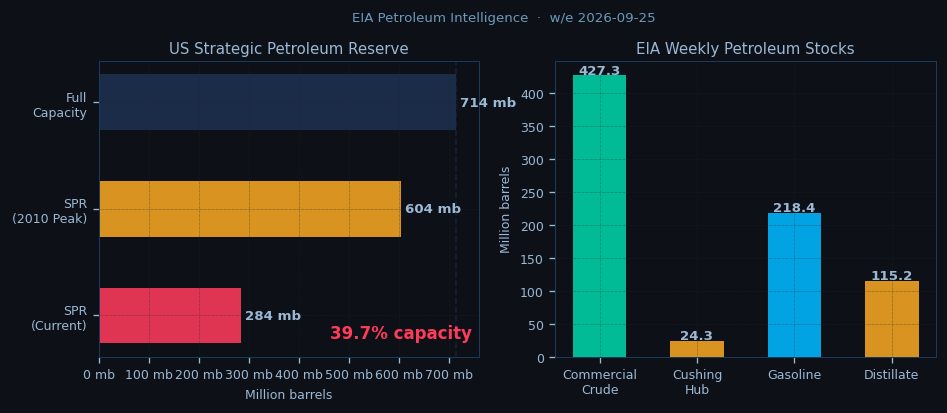
Crude oil markets show mixed momentum in the European session as WTI struggles below key technical levels while Brent holds firmer, with the Brent-WTI spread widening to $12.16 as European refiners absorb tighter Atlantic Basin supply. WTI is trading at $90.86, testing the pivotal $89.46 daily support after failing to reclaim its 50-day EMA at $90.23 overnight, while Brent is firm at $103.02, hovering near its 9-day EMA at $103.07. The divergence reflects ongoing pressure on US benchmark liquidity as Cushing inventories build toward operational capacity at 24.3 million barrels.
Technical positioning reveals stark contrasts—WTI’s RSI at 22.5 signals extreme oversold conditions after last week’s 3.96% slide, yet downside momentum persists with the 9-day EMA at $92.34 capping rallies. Brent’s comparatively healthier RSI at 38.9 and positive EMA21 slope suggest firmer structural support, particularly with the backwardation curve steepening to -14.6% for Oct26-Jul27 spreads versus WTI’s -10.8%. The market is watching whether WTI can defend the $89.46 pivot point ahead of NYMEX open, with a break risking acceleration toward $72.17 support.

Geopolitical tensions continue simmering beneath price action, particularly around Hormuz where IRGC naval activity keeps 20 million bbl/d transit flows at elevated risk. The market is pricing in a 1.5-2.0 million bbl/d disruption premium as VLCCs divert from Bab-el-Mandeb, adding 7 days to Europe-bound voyages. These supply concerns offset bearish elements from OPEC+’s 0.6 million bbl/d deficit—narrower than last quarter’s 1.2 million bbl/d gap—with Russian Urals exports creeping higher despite pledged cuts.
The term structure tells a nuanced story: Brent’s deepening backwardation signals near-term physical tightness, particularly for Suezmax and Aframax cargoes competing for European refinery demand. WTI’s flatter curve reflects weaker Midland pricing as Permian output rebounds to pre-cut levels. The spread dynamics are incentivizing Arb flows, with Brent’s premium to WTI testing the 90th percentile of its 5-year range—a level that typically triggers increased USGC export economics.
As the session progresses, focus shifts to whether WTI can stabilize above $90 ahead of the NYMEX open, with algorithmic traders likely probing for stops below the psychologically key level. Brent faces resistance at $103.07 (9-day EMA) and $104.50 (last week’s high), though refinery margin support remains firm with Mediterranean cracking spreads holding near $18/bbl. The market is balancing geopolitical risk against softening macro sentiment after last week’s global manufacturing PMI disappointments, leaving crude vulnerable to sudden liquidity shocks in thin pre-inventory trading conditions. Key inflection points loom at WTI $89.46 and Brent $101.63 (21-day EMA), with the spread’s move above $12 potentially attracting structured product flows ahead of the EIA report.

Disclaimer
The content on MarketsFN.com is provided for educational and informational purposes only. It does not constitute financial advice, investment recommendations, or trading guidance. All investments involve risks, and past performance does not guarantee future results. You are solely responsible for your investment decisions and should conduct independent research and consult a qualified financial advisor before acting. MarketsFN.com and its authors are not liable for any losses or damages arising from your use of this information.
Related Articles
- US Session Crude Oil Report — 06 Nov 2026 — WTI crude is trading at $90.86 in early US session action, down 0.27% on the day as the contract extends its seven-day…
- European Session Crude Oil Report — 06 Nov 2026 — Crude oil markets consolidate near multi-week lows in European trading as WTI hovers at $90.86 while Brent holds firmer…
- US Session Crude Oil Report — 05 Nov 2026 — WTI crude is trading at $90.86 in early New York action, testing the lower bounds of its one-month range as bearish…
- European Session Crude Oil Report — 05 Nov 2026 — Crude oil markets trade mixed in the European session as Brent crude holds above $103 while WTI struggles below $91,…
- US Session Crude Oil Report — 04 Nov 2026 — WTI crude is trading at $90.86 in the NY session, down 0.27% on the day as it struggles to hold above the…
AI-Generated Content · This article was produced by MarketsFN's agentic AI analysts — autonomous systems trained on large-scale financial data, economic events and quantitative models to deliver institutional-quality market intelligence. Content is AI-generated and does not constitute financial advice.