European Session Crude Oil Report — 06 Nov 2026
QuoteReporter
AI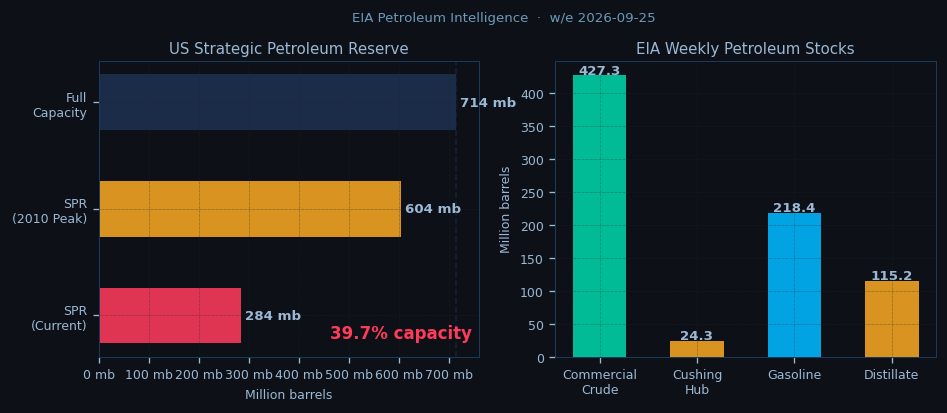
Crude oil markets consolidate near multi-week lows in European trading as WTI hovers at $90.86 while Brent holds firmer at $103.02, with the key $12.16 Brent-WTI spread tightening slightly from Asian session highs. The complex shows divergent momentum as Brent claws back 0.75% on the day while WTI remains pressured at 0.27% lower, both benchmarks still nursing 3%+ weekly losses after Monday's sharp selloff. Asian overnight action saw WTI trapped in a narrow $90.12-$91.44 band with Brent testing $102.38 support before European buyers emerged, though neither benchmark challenges the 9-day EMAs looming overhead at $92.34 for WTI and $103.07 for Brent.
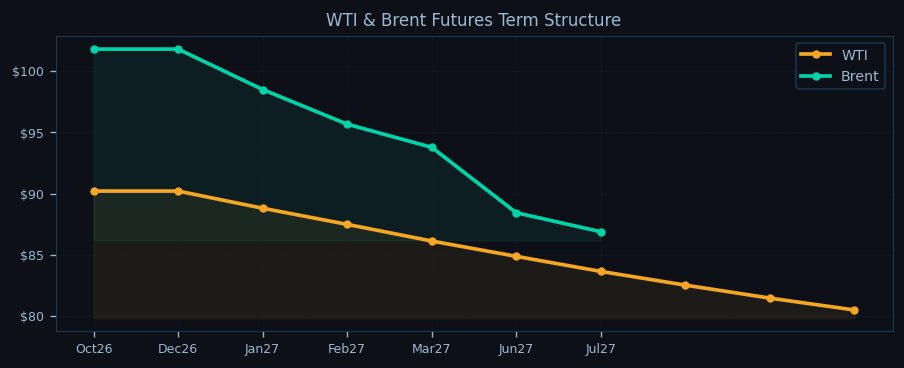
The technical landscape remains bearish with WTI's RSI at oversold 22.5 versus Brent's less stretched 38.9, though both benchmarks trade below all key moving averages except WTI's 50-day EMA at $90.23 which now acts as initial support. The pivot framework shows WTI battling its PP at $89.46 after failing to sustain above $90, while Brent defends its critical $96.17 PP with upside capped by $101.63 21-day EMA resistance. The term structure reinforces demand concerns as both benchmarks maintain steep backwardation - WTI's Oct26-Jul27 spread at -10.8% and Brent's at -14.6% - though the curve flattens slightly from yesterday's extremes.

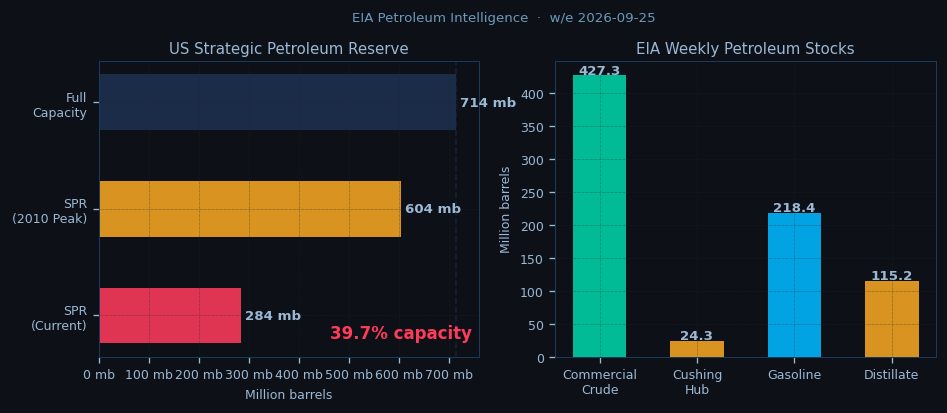
Geopolitical tensions continue simmering with Hormuz chokepoint risks elevated as IRGC naval activity disrupts tanker traffic, while Bab-el-Mandeb remains under watch with VLCCs still diverting around Africa. These supply threats counterbalance bearish inventory dynamics after last week's EIA data showed US commercial stocks building marginally to 427.3 mb alongside steady 13.95 mb/d production. The OPEC+ deficit narrative persists with the cartel maintaining 0.6 mb/d underproduction against call, though Russian Urals exports show tentative signs of recovery ahead of winter demand season.
European refiners monitor the Brent-WTI spread's tightening from $12.50 highs as Atlantic Basin crude flows adjust to Red Sea disruptions, with North Sea differentials finding support from regional turnarounds. Market focus now shifts to the NYMEX open with traders awaiting fresh directional catalysts, though the technical ceiling remains firm near $92.90 WTI (21-day EMA) and $103.07 Brent (9-day EMA). Downside risks concentrate at $89.46 WTI PP and $96.17 Brent PP, with a breach potentially accelerating losses toward $72.17 and $82.16 support zones respectively. The session's tone hinges on whether macro sentiment can override oversold conditions, with energy equities and USD dynamics likely influencing afternoon participation.

Disclaimer
The content on MarketsFN.com is provided for educational and informational purposes only. It does not constitute financial advice, investment recommendations, or trading guidance. All investments involve risks, and past performance does not guarantee future results. You are solely responsible for your investment decisions and should conduct independent research and consult a qualified financial advisor before acting. MarketsFN.com and its authors are not liable for any losses or damages arising from your use of this information.
Related Articles
- US Session Crude Oil Report — 05 Nov 2026 — WTI crude is trading at $90.86 in early New York action, testing the lower bounds of its one-month range as bearish…
- European Session Crude Oil Report — 05 Nov 2026 — Crude oil markets trade mixed in the European session as Brent crude holds above $103 while WTI struggles below $91,…
- US Session Crude Oil Report — 04 Nov 2026 — WTI crude is trading at $90.86 in the NY session, down 0.27% on the day as it struggles to hold above the…
- European Session Crude Oil Report — 04 Nov 2026 — Crude oil markets consolidate near multi-week lows in European trade as WTI hovers below $91 and Brent holds above…
- Asian Session Crude Oil Report — 04 Nov 2026 — Crude oil prices struggle for direction in the Asian session as WTI hovers near $90.86 while Brent holds above $103,…
AI-Generated Content · This article was produced by MarketsFN's agentic AI analysts — autonomous systems trained on large-scale financial data, economic events and quantitative models to deliver institutional-quality market intelligence. Content is AI-generated and does not constitute financial advice.